


1. Introduction
Means-tested social programmes, including subsidised health insurance, often have low take-up rates among their target population (Baicker et al., Reference Baicker, Congdon and Mullainathan2012; Bhargava and Manoli, Reference Bhargava and Manoli2015; Chernew et al., Reference Chernew, Frick and McLaughlin1997; Currie, Reference Currie, Auerbach, Card and Quigley2006; Wright et al., Reference Wright, Garcia-Alexander, Weller and Baicker2017). Non-take-up undermines the effectiveness of these programmes, and also creates inequities among the affected population (Hernanz et al., Reference Hernanz, Malherbet and Pellizzari2004). Non-take-up may derive from stigma (Aizer, Reference Aizer2007; Baumberg, Reference Baumberg2016; Iyengar and Lepper, Reference Iyengar and Lepper2000), administrative hassle (Aizer, Reference Aizer2003), behavioural barriers (Baicker et al., Reference Baicker, Congdon and Mullainathan2012), and limited programme generosity (Hahn, Reference Hahn2013). A more straightforward explanation could be that eligible households are poorly informed about their entitlement and programme benefits (Bhargava and Manoli, Reference Bhargava and Manoli2015; Chetty et al., Reference Chetty, Friedman and Saez2013; Ettelt et al., Reference Ettelt, Williams, Perkins, Wittenberg, Lombard, Damant and Mays2018; Liebman and Luttmer, Reference Liebman and Luttmer2015; Shaefer, Reference Shaefer2010). In the latter case, take-up could be increased through the targeted provision of information. Increased digitalisation of the welfare state creates new possibilities for proactively informing citizens about their social rights. In this paper, we study to what extent proactively reaching out to potential beneficiaries improved the take-up of the Increased reimbursement of health care (IR) in Belgium.
Research suggests that, indeed, individuals are poorly informed of their health insurance options and find it difficult to choose a health insurance plan suited to their needs and preferences (Baicker et al., Reference Baicker, Congdon and Mullainathan2012; Handel et al., Reference Handel, Kolstad and Spinnewijn2019; Kaufmann et al., Reference Kaufmann, Müller, Hefti and Boes2018; Kling et al., Reference Kling, Mullainathan, Shafir, Vermeulen and Wrobel2012). Informing eligible individuals about benefits of subsidised health insurance and/or their eligibility for it may be an effective strategy to improve take-up rates (Currie, Reference Currie, Auerbach, Card and Quigley2006). Bhargava and Manoli (Reference Bhargava and Manoli2015) demonstrated that information about eligibility for a cash transfer programme, the earned income credit in the U.S., had a substantial effect on applications for it. In the context of health care, mailing of relevant information has been found to positively impact health behaviours in the form of uptake of cancer screening (Lantz et al. (Reference Lantz, Stencil, Lippert, Beversdorf, Jaros and Remington1995) and dental check-ups (Altmann and Traxler, Reference Altmann and Traxler2014). In a high-income country context, we know of only one study that has tested for an effect of information sent by mail on the choice of health insurance. Kling et al. (Reference Kling, Mullainathan, Shafir, Vermeulen and Wrobel2012) found that letters with personalized information on different prescription drug insurance plans in US Medicare induced switching to the lowest-cost plan. In another study, Guthmuller et al. (Reference Guthmuller, Jusot and Wittwer2014) sent out an invitation for a meeting in which information was provided on a French subsidised complementary health insurance plan. They found that take-up was substantially higher among the people that attended the meeting, whereas those who could not make it were less likely to apply for complementary health insurance in comparison to the control group.
Those who potentially benefit most from informative notices generally seem to respond more to the notices, indicating that these notices seem to succeed in reaching out to the target group (Bettinger et al., Reference Bettinger, Long, Oreopoulos and Sanbonmatsu2012; Bhargava and Manoli, Reference Bhargava and Manoli2015). Specifically in the context of healthcare benefits and insurance, Guthmuller et al. (Reference Guthmuller, Jusot and Wittwer2014) found that people’s response to information provided in the meeting on healthcare benefits was mainly explained by healthcare needs. As such, people with higher healthcare needs were also more sensitive to information on a public programme for health care benefits.
The digitalisation of the welfare state offers new opportunities for identifying people who are potentially eligible for benefits on a large scale. This generates new possibilities for reaching out to those who are eligible for benefits, but do not take them up. In 2014, the Belgian government decided to set up a new data flow between the health insurers and the tax authority to identify all potential beneficiaries of the Increased Reimbursement programme. IR is a subsidised health insurance scheme in which households pay lower co-payments after an eligibility assessment that is partly based on household income. Having an IR status automatically generates other tied benefits, including discounts for public transport, gas and electricity. For large parts of the population, take-up of the programme is neither automatic, nor compulsory and many of those entitled do not benefit from it (Avalosse et al., Reference Avalosse, Vancorenland and Verniest2015). With this study we add new experimental evidence which shows that informing potential beneficiaries using non-intrusive techniques, such as sending letters and flyers, can indeed be an effective strategy for increasing the take-up of subsidised health care among vulnerable populations in developed economies. More specifically, we report on a field experiment with more than 55,000 low-income households in Belgium in which we evaluate the effect of proactively contacting potential beneficiaries to improve take-up of the IR. In line with the findings by Guthmuller et al. (Reference Guthmuller, Jusot and Wittwer2014) for France, and Kowalski (Reference Kowalski2016) for the Oregon Health Insurance Experiment, we expect that these proactive contacts increase take-up, in particular among those who would benefit the most from IR.
We contribute to the limited evidence on health insurance decisions obtained experimentally outside of the lab and provide a more detailed evaluation of the effectiveness and efficiency of the intervention by combining experimental evidence and rich administrative data. We find that mailing the information raises take-up by 10 to 15 percentage-points, which is a three- to four-fold increase compared to the control group. Further, we find that the households that take up the programme because of the mailing have significantly higher healthcare expenditures and pharmaceutical consumption compared to households that do not take up the programme, in spite of being contacted. This suggests that the intervention is effective in reaching those in highest need. Along the same line, among those households that obtain IR, the early responders are those in highest need. However, we find that the mailing reduces the efficiency of the application procedure as the mailing also induced more non-eligible households to apply.
The remainder of this paper is organized as follows. In section 2 we briefly discuss the institutional context of this study. Subsequently, in section 3, we provide a detailed overview of the experimental setup. We present the main findings in section 4 and we conclude in section 5.
2. Institutional context: The Increased Reimbursement
In Belgium, mandatory health insurance has led to near universal coverage. The same basic health insurance package with extensive coverage is provided by seven nation-wide non-profit health insurers that are supervised by the National Institute for Health and Disability Insurance. Standard insurance can be supplemented: for instance, with hospitalisation insurance or privately organised additional insurance schemes (e.g. Schokkaert et al., Reference Schokkaert, Van Ourti, De Graeve, Lecluyse and Van de Voorde2010). In contrast to the situation in some other countries, these non-profit health insurers are generally considered to be benevolent and are oriented at helping their members to realize their social security rights. In this experiment, we collaborated with the National Alliance of Christian Mutualities (henceforth NACM). With approximately 4.5 million members, or about 40% of the entire Belgian population, NACM is the largest Belgian health insurerFootnote 1. NACM is organized in 19 regional departments that closely collaborate, but that also have a certain degree of administrative independence, and has a widespread network of local offices throughout the country.
The predominant social safety net in Belgium’s healthcare is the subsidised insurance scheme “Increased Reimbursement” (IR). Although renamed and restructured in 2014, IR has been available since 2007. Eligibility for IR is either granted automatically based on access to other social protection benefitsFootnote 2, or requires passing an income test. In the latter case, clients have to file an application and are subjected to an investigation of household income at a local health insurance office. The income threshold in 2021 was about 19,900 EUR gross taxable income, increased with about 3,680 EUR for each additional family memberFootnote 3. For a single person, depending on the sector of employment, this is close to, but mostly below, the level of the minimum wage for someone employed full-year full time without seniorityFootnote 4. In contrast, the threshold is well above the level of many social benefits, including social assistance and minimum pension entitlements for employees with a career of 45 yearsFootnote 5. Once the IR is approved, the right is retrospectively applied from the first day of the month or quarter of application onwards. In 2015, about 8% of the entire Belgian population received IR on the basis of access to other benefits, while another 10% received it based on household incomeFootnote 6.
Under IR, beneficiaries pay lower co-payments for a range of care provisions and, importantly, benefit from a third party payer system for visits to the General Practitioner (GP). Under the third party payer system, IR beneficiaries only pay the co-payment on the spot in comparison to the full fee for non-IR beneficiaries. Although this third party payer system does not strictly affect healthcare prices, it removes part of the hurdle to access care. Overall, the reduction in co-payments is significant. On average, for a 15-65 year old employed man (woman) co-payments decrease from 16.03% (17.58%) to 6.55% (7.38%) under IR (De Graeve et al., Reference De Graeve, Van Mechelen, Vandelannoote and De Wilde2013), corresponding to an average increase in reimbursements of 150 to 250 euros per year. Since the IR status applies to the household, the reduction in co-payments may be significant. Moreover, IR beneficiaries pay less for hotel costs during hospitalisation and profit from a lower out-of-pocket maximum in the population-wide Maximum Billing system. The Belgian Maximum Billing scheme is an out-of-pocket maximum of around 459 euros per year for low-income individuals. Next to benefits in the healthcare system, IR beneficiaries are also eligible for several discounts, including discounts on telephone bills, discounts on fuel prices for electricity and heating, and lower public transport fares. Also at the local level IR is often used as a shortcut for targeting discounts at low-income households.
Some years ago, health insurers and policy-makers considered that many of the people who would be eligible for IR based on their low income did not take up this benefit. Therefore, the Royal Decree of January 15th 2014Footnote 7 stipulated that potential beneficiaries of IR should be contacted proactively and be invited to file an application by their health insurer. Before, potential beneficiaries were informed in a more ad-hoc manner by health insurers, providers of health care and social workers, or more indirectly by word of mouth, and national or local news. The Decree mandated a new data flow between health insurers and the federal tax administration, called the ‘proactive flux’. The health insurers had to provide the tax administration with a list of households who did not benefit from IR. Subsequently, the tax administration indicated which of these households had a taxable income that was below the threshold for IR eligibility in 2013. This information was then relayed back to the relevant health insurers, who had to contact all those with an income below the threshold, to inform them about their potential eligibility for IR. To soften the workload for its local offices, NACM decided to contact households in six mailings over the course of 18 months. This gave us the opportunity to set up a field experiment to assess the impact of this outreach effort (without affecting the speed with which potential beneficiaries would be contacted). To this end, we agreed with the NACM that we could assign potential beneficiaries randomly to the six mailings.
3. Experimental setup
In this section, we describe (1) the intervention in the experiment; (2) the allocation of households to the intervention; (3) the data extraction and available background variables; (4) the quality of the randomized assignment to mailings.
3.1. Outreaching to potential beneficiaries: the intervention
The Royal Decree did not stipulate how health insurers should contact potential beneficiaries. Furthermore, while a common method was approved, NACM’s regional departments were free to deviate from this common approach. Therefore, our focus is on evaluating the total effect of the outreaching activity organised within the context of the Royal Decree. All households in the intervention group received the same basic intervention, consisting of a letter and a flyer, both sent by regular mail. The content of the letter was very brief and formally explained that the household was potentially eligible for IR if the income of its members was below a certain threshold. It also invited them to make an appointment for filing an application and included the necessary contact information for doing so. The flyer clearly listed the main benefits of IR, contact details for filing an application as well as a list of documents that should be brought for completing the application (see supplementary material).
Additional aspects regarding the intervention varied across households and regions. Firstly, those with a known e-mail address (about one in six households) first received an e-mail through the digital platform of NACM a couple of days before the regular mailing. This e-mail contained the same information as the letter sent by regular mail. Secondly, several regional departments decided to additionally remind their members of the mailing by telephone. All contacts took place in the principal language of the Community in which people lived (Dutch-speaking, French-speaking, or German-speaking), even though a sizeable part of the target population may not fluently speak and/or understand this language. However, the majority of households was only contacted by regular mail.
It is important to stress that all regional departments have the same organisational structure and make use of the same front office and back office procedures and software, implying that application procedures for IR are highly streamlined, and the outcome of the application procedure should not depend on the regional department to which one belongs. However, regional departments vary in the degree to which they actively encouraged take-up of IR among their members in the past (i.e. before the experiment) as well as in the socio-demographic and socio-economic composition of their members.
3.2. Allocation to intervention (sub)groups
The original list with potential beneficiaries to be contacted by NACM consisted of 183,024 household heads, spread over the 19 regional departments. 11 out of these 19 departments agreed to participate in the experiment. Reasons for non-participation were either the desired administrative independence or the will to contact all potential beneficiaries as soon as possible, rather than spread out over a longer time period. Further, household heads born after 1985 are not included in the analysis, as they were contacted at a later point in time. This selection left us with a sample of 55,407 household heads representing 92,312 household members included in the current study.
Households were randomly assigned to one of six mailings spread over 18 months. To reduce sampling error and improve the allocation of households to intervention and control groups, household heads were stratified by the variables available to us when randomly assigning the households to the mailings. These include regional department, postcode and age in three broad categories: household heads born before 1940 (incl.), before 1965 (incl.) and after 1965. Also, to avoid direct contamination through “household” network effects, we allocated all people living on the same address to the same mailing (except for addresses with more than five people to be contacted). For administrative purposes requested by NACM, the number of households and share of regional departments differed across mailings. To ensure representativeness of each intervention subgroup, analogously to what is done in the analysis of random samples with unequal probabilities of selection, weights were used throughout the analysis that reflect the inverse of the probability of selection into each of the intervention subgroups. This ensures that in the analysis the relative weight of regional departments stays constant across all intervention subgroups and the control group.
We compare the take-up of IR for households in the first three mailings (the intervention group) with take-up by households originally allocated to later mailings (the control group). Throughout all analyses, and for ease of exposition, we assign all people in the last three mailings to one control group. While the first three mailings are considered distinct intervention subgroups, we refer to the intervention group when considering the three groups together. We analyse the intervention subgroups (mailings 1-3) separately because this uncovers interesting patterns. The first subgroup was contacted on 25/11/2015 and subgroups two and three were contacted on 07/04/2016 and 26/05/2016 (see Table 1). The control group accounts for about 46 percent of the sample. In the results presented below, the household head and his/her associated household is used as the unit of analysis.
TABLE 1. Number of households and number of household members in the experiment

3.3. Data
IR status and background variables were collected in September 2016, and refer to the situation just before the control group was contacted. All data were retrieved from administrative data available to NACM. Table A1 in the supplementary material provides descriptive statistics for all variables included in the analysis. Because we collect data in September 2016 for all groups, the number of months we can observe after receiving the mailing differs between intervention subgroups (cf. Figure A1 in the supplementary material). We analysed both the total effect of the mailing over the entire period of observation and the effect of the intervention for each subgroup separately over a fixed time range.
We observe several indicators related to take-up of IR: application status for IR (yes/no), take-up of IR (yes/no), date of application and date of approval. Of these variables, effective take-up is more reliable than the other three variables. Application status and date of application are not uniformly registered across local NACM offices and we noticed some processing errors for date of approval. Even though we emphasized the importance of uniform registration, it is possible that registration differed somewhat between office workers. Therefore, we focus primarily on effective take-up of IR.
The background characteristics could roughly be divided into three categories. Firstly, socio-demographic variables like age, gender (both for the head of household), the number of family members, the number of adults in the family and whether or not the family was a one parent household were included. All these variables referred to the situation in September 2016. These characteristics may be related both to the extent of awareness of IR and to opportunity costs to apply for IR. For example, older people may, ceteris paribus, find it less bothersome and easier to apply for benefits at a local office during normal office hours.
Secondly, variables that define healthcare use were included. All these variables referred to the calendar year 2015 and were aggregated at the household level. This category of variables contained health expenditures for both the health insurer and the householdFootnote 8 (equal to co-payments), the number of daily defined doses (DDD)Footnote 9 to measure pharmaceutical use, days in general hospitalization and number of days in a psychiatric institution in particular. In addition, we included an indicator of whether someone in the household had crossed the maximum billing threshold, which would automatically result in a cap on co-payments to be paid by the household. Health care use might be related to take-up of IR in opposite ways. Possibly, frequent healthcare users face a higher incentive to apply for IR and have more opportunities to be informed about IR by health insurers and health providers. On the other hand, their health status may impede them from going to a local office to apply for IR. Furthermore, intensive use of health care may point to a financially more vulnerable situation of households. At the same time, financial vulnerability may also result in under-consumption of health care.
Thirdly, information was available on two variables that describe absence from work. Both variables referred to the calendar year 2015. A first variable measured days being unemployed whereas a second variable captured the number of days that an individual was unable to work because of sickness, a work accident or disability. Those who are absent from work (controlling for healthcare use) can be expected to face lower opportunity costs of applying for IR. Also, generally speaking, the longer household members are absent from work, the more vulnerable they are.
3.4. Characteristics of contacted vs. non-contacted individuals
Comparing the characteristics of the intervention and control group with independent samples t-tests validates the randomization procedure and supports the internal validity of further analyses (see Table A2 in the supplementary material).
As expected, most differences between the intervention groups and the control group are statistically insignificant. Only one variable – historic household expenditures on health care in Intervention subgroup 1 – differs significantly at the 95% confidence level. On average, household expenditures in 2015 were 18.9 euros higher in the control group (i.e. about 5% of average expenditures). However, the significance does not transfer to the historic health insurer expenditures. Because of multiple simultaneous comparisons, we may overestimate the significance of this result. With a Bonferroni correction for only three simultaneous tests, the result becomes insignificant. Another test of successful randomization can be obtained by comparing the take-up rates in the intervention subgroups and the control group one week before each intervention subgroup is contacted. As can be observed from Figure A2 in the supplementary material, no substantial difference shows up in this regard.
4. Results
4.1. Applications and approvals of IR
Results in Figure 1 show that the intervention effect on applications is about 17 to 22 percentage points. These numbers are obtained by subtracting the application rates in the control group from those in the intervention subgroups. There is also a significantly higher take-up rate of IR, which is about 10 to 15 percentage points higher in the intervention subgroups than in the control group. With overall take-up of IR increasing with a factor of three (Group 3) to four (Group 1), the intervention has a non-negligible effect on the number of low-income households that benefit from IR, and can be considered very effective in increasing the take-up of IR. These results are confirmed when controlling for background characteristics and adding fixed effects for regional departments (see Table A3 in the supplementary material). However, the fact that the post-intervention application rate remains fairly low (at approximately 30% in the group that was first contacted) may point to various limitations to the intervention. First of all, it may be that the intervention is not sufficiently targeted (e.g. because of using out-of-date information on taxable income by the tax administration), with NACM reaching out to households who are not eligible. Second, it may also point to the need for another type of intervention to achieve full take-up among the hard-to-reach population: for instance, by reducing the ‘application cost’ (e.g. in terms of “hassle”, cf. Figure A7 in the supplementary material on the documents to bring for an eligibility test). While also stigma might play a role, we expect this to be less of an issue for any remaining non-take-up because about 18% of the entire Belgian population benefits from IR (approximately 2 million individuals).

FIGURE 1. Percentage of households that have applied, and percentage that have received IR in the intervention and control groups, as well as the percentage of approved applications (results at the household level), September 2016
Note. The approval rate is obtained by dividing the take-up by the number of applications. 95% confidence intervals.
Figure 1 also reports on the ‘approval rate’, i.e. the number of households that receive IR as a proportion of the total number of households that applied for IR. While the approval rate is as high as 80 per cent for households submitting an application in the control group, this drops to 70 per cent for the intervention subgroups. The lower approval rate in the intervention subgroups indicates that the intervention also induced more non-eligible households to apply for IR, imposing unnecessary additional costs both on households and health insurers. The use of more up-to-date tax data to identify potential beneficiaries of IR could probably lower costs for households and Belgian health insurers in terms of mailing and personnel involved in the follow-up of applications. For the same reason, the time between receiving tax information and contacting households should be kept as short as possible. This would most likely improve the efficiency of similar initiatives in the future.
Finally, Figure 1 shows that the intervention’s effect on the application rate and take-up is higher for the first as compared to the second and the third intervention subgroups. However, when the period of observation is restricted to 50 days after the intervention for all three subgroups, we do no longer observe this pattern. In that case, the application, take-up and approval rate are even slightly lower in the first as compared to the other two intervention subgroups (see Table A4 in the supplementary material). This is because the moment at which take-up is measured varies. If the level of ‘spontaneous’ take-up in the control group is deducted (cf. Figure A2), there is no longer a noteworthy difference between Intervention Subgroup 1 vs. the other two in the level of take-up 50 days after the intervention.
4.2. Never takers, always takers and treated compliers of IR
The profile of those receiving IR as a consequence of the intervention (the ‘treated compliers’), as opposed to those not receiving IR in spite of being contacted by NACM (the ‘never takers’), is important information for evaluating the effectiveness of proactively contacting potential beneficiaries. However, it is impossible to directly observe the characteristics of those who take up IR in reaction to the intervention: households taking up IR in the intervention group are a mixture of households who would take up IR also without being contacted by NACM (the ‘always takers’) and households that take up IR in response to the intervention. Yet, it is possible to indirectly derive the average profile of both groups. This is because the average of any characteristic of those who do take up IR in the intervention group is a weighted average of the characteristics of the treated compliers and the always takers. Due to the random allocation of households to intervention and control groups, one could expect that the characteristics of the always takers in the intervention group (i.e. those who would have taken up IR even without receiving the intervention) are similar to those of the always takers in the control group (i.e. all households taking up IR in the control group). Under this assumption it is possible to compute the average characteristics of the treated compliers and compare them to the never takers and always takers (Kowalski, Reference Kowalski2016; see supplementary material for more details).
The results of the comparison of group characteristics of intervention subgroup 1 (the subgroup with the longest period of observation after the intervention) with the control group are displayed in Table 2 (results for the other subgroups are available in the supplementary material, in Table A5 and Table A6). When interpreting the results, it should be kept in mind that effective take-up depends both on filing an application and compliance with eligibility conditions. The differences between the groups under comparison are the combined result of both factors.
TABLE 2. Average characteristics of always Takers, Treated Compliers and Never Takers (take-up of IR), household head and household characteristics, data from intervention subgroup 1 and control group.

Note. TC-AT = Treated compliers vs. always takers; TC-NT = Treated compliers vs. never takers. Diff. = difference (point estimate). P-Val. = p-value. P-values obtained from a bootstrap using 250 replications. To bootstrap we employ the Stata programming approach suggested by Cameron and Trivedi (Reference Cameron and Trivedi2009: 426).
Compared to treated compliers, we find that always takers have considerably higher historic health care expenditures and spend substantively more days in unemployment, sickness and disability. In other words, insofar as we can infer from the data at our disposal, the always takers seem to comprise, on average, of the most vulnerable group of households. Households with higher historic expenditures might, given this incentive, take up IR more easily, but this fact might also indicate that always takers are informed by healthcare professionals when taking up care. This pattern is also consistent with adverse selection, saying that those who need it the most select first in subsidised insurance. Given the time spent out of work, their opportunity costs for applying for IR can be considered to be lower as well. Also in other respects the average profile of treated compliers is remarkably different from always takers. On average, treated compliers have somewhat smaller households and are about 9 years older than always takers (which may partially explain the lower number of days on unemployment or sickness benefits). Moreover, while having higher drug use, the treated compliers and their household members have fewer or shorter hospitalizations.
In contrast, never takers (those who do not take up IR even with the intervention) are on average younger, have larger families and have lower healthcare use, and a considerably lower incidence of the Maximum Billing than the treated compliers. The difference in unemployment and sickness is rather small and non-significant. A similar picture emerges for intervention subgroups 2 and 3 (see the supplementary material). Arguably, the intervention succeeds in incentivizing the individuals that are most likely to be in need to take up IR, apart from those that already take up IR even without additional incentives. Given the lower historic health expenditures, for many of the never takers the perceived financial gain from taking up IR might be too small to go through the hassle of filing an application. Low take-up rates may therefore also result from an informed comparison of benefits and costs, and not all households can be considered as uninformed.
4.3. Timing of events
Previous results pointed to interesting time patterns. Figure 2 graphically displays the timing of the response of households to the intervention in the first intervention subgroup as compared to the control group. The graphs on the left show that the majority of applications and approvals in the first group took place in the first thirty days after the intervention.
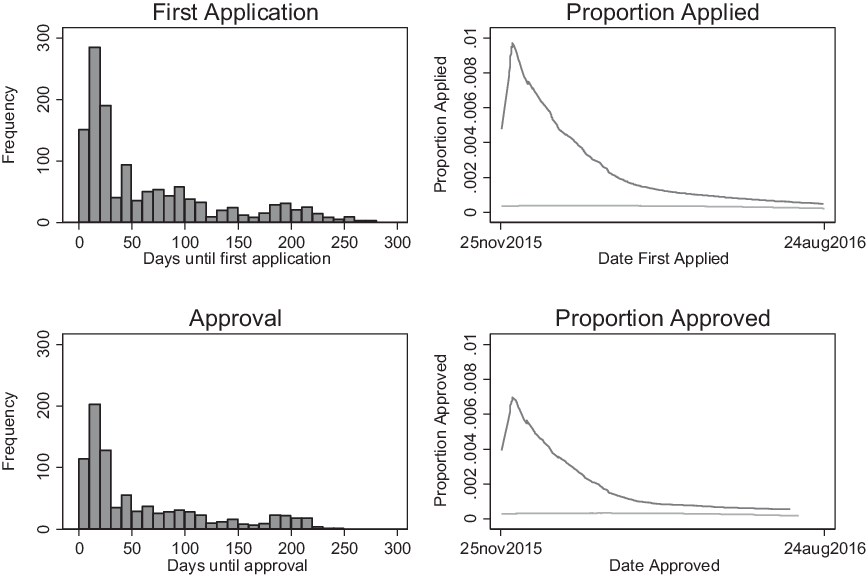
FIGURE 2. Timing of Events: frequency and proportion of households that have applied for or have been awarded IR across time (intervention subgroup 1 vs. control group)
Note. Left panel: intervention subgroup 1; right-hand side panel: intervention subgroup 1 (black lines) vs. the control group (grey lines) (lowess curves which non-parametrically fit the data). Graphs for intervention subgroups 2 and 3 are provided in the supplementary material.
After thirty days, the responsiveness steadily declines. Nevertheless, the tails of the distribution suggest that some households react even more than 100 days after having received the letter. Potentially, some households may be more likely to apply for IR only when they have healthcare expenditures after they received the intervention. Of all applications, the median amount of days between the intervention and the application is 36. However, the median amount of days until effective take-up is 29 days. This implies that those applying sooner are also more likely to obtain IR.
The graphs at the right in Figure 2 present smoothed fits comparing the proportion of people applying for or taking up IR in intervention subgroup 1 (the strongly skewed, dark grey lines) with the average take-up percentage in the control group (the flat, light grey lines). As expected, since people in the control group did not receive any intervention at the time we measured take-up, take-up in this group is constant at a relatively low level. This confirms that there are no spill-over effects from the intervention to the control group, and nothing happened that made a real difference on take-up in the control group (such as increased media attention for IR). Although the difference in applications and take-up rates converges between the intervention group and control group over time, over the entire time span take-up is higher in the intervention group. Remarkably, the intervention effect remains observable until nearly one year after intervention, even though the effect seems to fade away more quickly for intervention subgroups 2 and 3 (see supplementary material).
In section 4.2., the profiles of always takers, treated compliers and never takers have shown that those who are most in need – the elderly and those with high historic healthcare expenditures – are more likely to respond to the intervention. Table 3 shows for intervention subgroup 1 that, among the households that obtain IR, those with higher healthcare expenses are also quicker to respond to the mailing and start an application. In Table 3, early and late responders are identified by a median-split on the time that it takes until the first application (conditional on receiving IR). This finding also holds for intervention subgroups 2 and 3. There is no statistically significant difference on absence from work because of unemployment or sickness. The average age of early responders is well above the official retirement age, and 14 years higher than the average age of late responders. This suggests that opportunity costs can affect both uptake of IR and postponement of application for IR.
TABLE 3. Average characteristics of early and late responders (for those who obtain IR). Data from intervention subgroup 1.

Note. Early and late responders are identified by a median split on the time that it takes until the first application.
5. Discussion and Conclusion
While the digitalisation of the welfare state may be associated with digital exclusion (e.g. Schou and Pors, Reference Schou and Pors2019), automated processes that monitor and deprive, rather than help, the poor (e.g. Eubanks, Reference Eubanks2018) and an overzealous focus on identifying benefit fraud (e.g. van Bekkum and Zuiderveen Borgesius Reference van Bekkum and Zuiderveen Borgesius2021), it also opens up major new opportunities for improving access to social rights. This can be done through setting up new data flows between public administrations to identify potential beneficiaries who do not take up their social rights. In this context, the Belgian government set out to improve the uptake of the Increased Reimbursement of health care, an income-tested benefit, by generating a new data flow between health insurers and the tax administration. This allowed health insurers to proactively contact potential beneficiaries who did not take up the IR. The results presented in this paper suggest that the outreaching activities set up by the health insurers (primarily consisting of sending a letter and flyer) were very effective in increasing take-up of IR. Exploiting a large-scale randomized experiment in collaboration with the largest Belgian health insurer NACM, we find a three to fourfold increase in the total take-up of IR among those who are contacted. Remarkably, the number of applications is higher in the intervention group for more than six months after the mailing. At the same time, the intervention evoked a higher percentage of applications by non-eligible members, incurring costs both on households and NACM. Although the intervention triggered a significant response, the efficiency of the mailing could probably be improved by using more up-to-date tax or social security data to identify potential beneficiaries.
We identify the average characteristics of those who responded to the mailing by comparing always takers and treated compliers. We find that respondents to the mailing are on average older, have lower pre-intervention healthcare expenditures and have lower unemployment and sickness rates compared to always takers. Households that did not react to the mailing, the never takers, are on average younger and have lower healthcare use than households who take up IR. This could arguably indicate that the most vulnerable households who did not yet take up IR, were indeed, on average, reached by the intervention. These findings line up with results reported in Kowalski (Reference Kowalski2016) on the Oregon Health Insurance Experiment. In that experiment, a lottery defined eligibility for an expansion of Medicaid coverage. Results from the lottery indicate that never takers have less healthcare use than treated compliers and treated compliers in turn have less healthcare use than always takers. Older people seem to respond more in both the Oregon experiment and in Guthmuller et al. (Reference Guthmuller, Jusot and Wittwer2014). Furthermore, we find that these patterns also translate into the profile of early versus late responders. Households that respond earlier are also those who can considered to be in higher need or have lower opportunity costs.
Several limitations of our study should be kept in mind. First, the population under consideration is sizeable but also specific. The experiment focuses on a low-income population from which members were excluded that had already been contacted in the recent past or that had taken up the IR before the start of the experiment. As such, a similar intervention may have had a higher impact when no efforts had previously been made by NACM to improve the take-up of IR. Moreover, because of the distinct membership profile of NACM, the results should not be generalized to the Belgian population. Second, the intervention differed to some extent across regions and households. This requires that our results are interpreted as the overall impact of the intervention. Hence, we are unable to causally identify the effectiveness of different communication and information strategies used in the intervention. Third, we could not directly observe eligibility for those households that did not apply for IR (both among the treated and the non-treated). This implies that the profile of the never takers could look different if the sample would be limited only to eligible households. Further, this implies that we are unable to determine how many eligible households did not apply for IR, even after being contacted. Finally, one could wonder whether the effect of the intervention could be higher if NACM faces adverse incentives for increasing take-up of IR. Although health insurers and/or regional departments may be reluctant to proactively contact members to apply for IR, e.g. because the administrative burden may be higher in this population, (financial) incentives for limiting take-up are largely absent. This suggests that if adverse incentives would play a role, the effect would probably be limited.
Apart from these limitations, this study successfully randomized a real-world intervention involving more than 55,000 households in a developed country. We directly observed application and take-up rates of IR and show that rather non-intrusive interventions can effectively improve the take-up of social benefits in general, and of a subsidised health insurance plan in particular. For policy-makers, the experiment shows that proactively contacting low-income households effectively helps to increase the take-up of IR, but it comes at a cost both for households and health insurers. Furthermore, it is unlikely that all those who are eligible did apply for the benefit. The intervention merely reduced information costs, but did not tackle the process costs associated with the take up of IR. More reminders and other types of (more expensive) help may be required (e.g. in the case of language barriers, strong time constraints (e.g. for single parents), or limited mobility), as well as a simplification of the eligibility test. At the same time, it is clear that a universal screening of the population for potential beneficiaries is an important addition to the toolbox of policy-makers for improving the take-up of benefits. Yet, the increased number of applications by ineligible people should elicit policy-makers and health insurers not only to improve the timeliness of the data exchanges, but also to weigh the additional costs of proactive contacting against, for instance, a further increase in the level of the IR or improved generosity of the out-of-pocket maximum, especially given that those most in need are likely to be already included in the programme. From a broader perspective, the results suggest that welfare states have great potential for improving benefit access for low-income households through improved data flows and proactive interventions to reach potential beneficiaries.
Acknowledgements
We thank Hervé Avalosse, Werner Cremer, Tom De Spiegeleer and Bram Peters for extensive data expertise and background information. We are grateful to two anonymous reviewers, Koen Decancq, Bruno De Borger, Diana De Graeve, Guido Erreygers, Marieke Huysentruyt, Owen O’Donnell, Erik Schokkaert, Erik Schut, Carine Vande Voorde, Tom Van Ourti and Edwin Wouters for comments on previous versions of this paper. We also thank the participants of the TAKE project and follow-up committee. Further, we thank seminar attendants at the INET Researcher Seminar at the University of Oxford, the Lowlands Health Economics Study Group, the Erasmus University of Rotterdam and the Herman Deleeck Centre for Social Policy in Antwerp for useful comments and suggestions. This project benefited from financial support from Belgian Federal Science Policy (TAKE project – Contract BR/154/A4/TAKE) and the National Bank of Belgium (UA/ADOC/LVP/15-065). Tim Goedemé acknowledges financial support by Citi through the Oxford Martin Programme on Inequality and Prosperity. The views, opinions, findings, and conclusions or recommendations expressed in this paper are strictly those of the authors and do not necessarily reflect the views of the funding agencies. The authors have no conflict of interest to declare.
Supplementary material
This article has supplementary material. Please visit https://doi.org/10.1017/S004727942100088X
Competing interests
The authors declare none.


 Open access