


1. Introduction
Concentrated vortices are ubiquitous in natural and man-made fluid motions, and are observed on widely differing scales. Spanning these characteristic scales between  $10^{-2}~\text {m}$ and $10^{5}~\text {m}$, examples include the familiar vortex observed in an emptying bathtub (Shapiro Reference Shapiro1962; Trefethen et al. Reference Trefethen, Bilger, Fink, Luxton and Tanner1965), damaging weather events such as tornadoes (Hoecker Reference Hoecker1960) and solar whirlpools created by downdraughts of cooling plasma returning to the Sun's interior (Bonet et al. Reference Bonet, Márquez, Sánchez Almeida, Cabello and Domingo2008). Hence, concentrated vortices have been studied extensively, and a number of exact solutions of the Navier–Stokes equations reported, including the Burgers vortex, the Batchelor vortex (Batchelor Reference Batchelor1964) and Long's vortex (Long Reference Long1961). Concentrated vortices are often associated with rotating systems where the Coriolis force is dominant, sometimes leading to complicated vortex-core structures (Lundgren Reference Lundgren1985). To better understand these structures, attention has focused more recently on examining the vortex above a constant-discharge drain hole in a rotating tank (Lundgren Reference Lundgren1985; Andersen et al. Reference Andersen, Bohr, Stenum, Juul Rasmussen and Lautrup2006; Chen et al. Reference Chen, Huang, Li, Chang and Chu2013; Foster Reference Foster2014).
In the axisymmetric case, with the drain located on the rotation axis (through the tank's centre), it is well known that a concentrated vortex forms above the drain and throughout remains positioned on the drain, with the steady state established on the so-called ‘spin-up time’ – provided the Rossby number based on the volumetric flow rate is sufficiently small. The flow structure is as follows: Fluid enters the tank at its outer rim, and flows radially inwards in the lid and base Ekman layers, thereby inducing a potential vortex in the fluid's interior by vortex stretching. When that inward-moving fluid arrives at the tank's centre, it erupts out of the Ekman layers and into the outer 1/4-Stewartson layer surrounding the vertical vortex core, moves radially inwards into the interior 1/3-Stewartson layer, and then flows downwards into the drain. Observational and theoretical details may be found in Andersen et al. (Reference Andersen, Bohr, Stenum, Juul Rasmussen and Lautrup2006), Chen et al. (Reference Chen, Huang, Li, Chang and Chu2013) and Foster (Reference Foster2014).
Much of the laboratory work and theoretical models of concentrated vortices of which we are aware have assumed axial symmetry. In the real world, however, there is no such axisymmetry, so we determined to explore a drain-hole vortex in a situation without axisymmetry. We performed a series of experiments in a rotating cylindrical tank with the drain hole inducing the vortex located at an off-axis location in the cylinder's base. The temporal evolution of the flow is remarkable. A concentrated vortex initially forms above the drain hole, where the fluid leaves the tank, having entered at the tank's periphery. In a relatively short time, the vortex migrates off the drain, moving under self-induction. As it advects around the tank, the core broadens, and the vortex ultimately comes to rest, with a steady structure. In this paper, we report for the first time the details of this motion. We find that the vortex advection away from the drain, and its eventual slowing to rest, occurs in a way that is described by the influence of an inviscid ‘image vortex’ at early times, and that the final position of the vortex is relatively insensitive to the value of the Rossby number, so long as it is small. Further, the vortex core broadens during that advection in such a way that the final steady structure of the vortex is a hollow-core vortex, with the vorticity concentrated in a ring surrounding the vortex centre, and passing over the drain-hole location.
A complete theoretical description of all processes involved is beyond the scope of this short paper. Here, we have focused on reporting experimental observations and details of the inviscid ‘image vortex’ model. The experimental results presented here were obtained with the drain located at the mid-radius of the cylinder's base, although other drain locations were considered and are briefly discussed in § 5. However, the data presented here are wholly representative of the general flow patterns and structures observed.
We also acknowledge the previous studies that have reported source/sink-driven flows in a rotating container which give rise to non-axisymmetric effects (see, for example, Kuo & Veronis Reference Kuo and Veronis1971; van Heijst Reference van Heijst1984). However, these studies are generally of steady-state behaviour and describe flows that are very different from the sorts of vortical motion described here.
2. Experiments
2.1. Apparatus and set-up
The set-up (see figure 1) consisted of an outer tank ( $42~\text {cm}\times 42~\text {cm}\times 19.5~\text {cm}$) containing an inner cylindrical working section (radius $b=17~\text {cm}$, depth $h=17.5~\text {cm}$), with its open bottom suspended 0.5 cm above the tank's base. The tank was mounted centrally on a turntable, with the vertical axis of the cylinder aligned with the turntable's rotation axis. The tank was filled to a level just above the cylinder's top edge with a salt-water solution of density $\rho =1.03~\text {g}~\text {cm}^{-3}$, which was uniformly seeded with small tracer particles to facilitate measurement of the fluid's velocity; the velocity measurements are described in more detail below. The salt used was NaCl. With the set-up complete, the cylinder's open top was sealed with a transparent acrylic lid and the turntable set in rotation (anticlockwise) and slowly brought to a constant angular frequency of $\varOmega =0.6~\text {rad}~\text {s}^{-1}$ (5.7 rpm), and left for at least 1 h to allow the water to reach solid-body rotation.

Figure 1. Sketch of the experimental set-up (not to scale): (I) lid; (II) outer tank; (III) cylindrical working section (radius  $b=17~\text {cm}$, height $h=17.5~\text {cm}$); (IV) drain hole (diameter $2a=0.3~\text {cm}$) located at the mid-radius $r_0^*=b/2$; (V) pump; and (VI) return flow to the outer tank. All the apparatus is mounted on a turntable that is rotating with constant angular frequency $\varOmega$.
The vortex was generated by using a pump to withdraw the water at constant discharge  $Q$ through a drain hole (diameter $2a=0.3~\text {cm}$) located in the tank's base at radius $r_0^*=b/2$ from the central rotation axis. In all cases considered, the discharge $Q$ was sufficiently small for there to be no adverse effects induced by the pump's start-up, which was effectively instantaneous. The withdrawn water was returned to the outer tank via a 3/8-inch fitting installed at a height $12~\text {cm} \approx 0.7h$ in one of the tank sidewalls (see figure 1). The inner cylindrical section was resupplied with water from the outer tank through the narrow gap of height 0.5 cm between the cylinder's open bottom and the tank's base, which was entirely open to resupply apart from where six small feet were located (of diameter 0.5 cm and height 0.5 cm) on which the cylinder was mounted. That is, the outer tank acted as a reservoir to both receive the return flow and to resupply the cylindrical section. In all cases considered, the return flow entering the outer tank was weak and had no discernible affect on the flow inside the cylindrical section.
2.2. Measurements and notation
Measurements of the fluid's horizontal velocity components (in the rotating reference frame) were obtained using two-dimensional, two-component particle image velocimetry (PIV). The seeding particles suspended within the water column were illuminated by a thin horizontal light sheet directed through the tank's mid-height plane, with the in-plane particle motion recorded using a digital video camera positioned above the tank. Both the lighting unit and camera were mounted on the turntable to record images in the co-rotating reference frame. The velocities were calculated relative to the right-handed coordinates  $(x^*,y^*,z^*)$ (shown in figure 1), with the drain located at $(x^*,y^*,z^*)=(0,-r^*_0,0)$; we denote the corresponding velocity components by $(u^*,v^*,w^*)$. Applying the PIV algorithm to the captured images returned measurements of $u^*$ and $v^*$ and of the corresponding vertical-vorticity component, $\zeta ^*$, in the horizontal mid-height plane $z^*=0.5h$.
In some experiments, velocity and vorticity measurements were also obtained at the 1/4-height and 3/4-height planes of the tank. These data displayed no discernible evidence of any height dependence in the bulk flow (i.e. away from boundary-layer regions and the vortex core). Therefore, as expected for rapidly rotating flows of this nature, the bulk flow is primarily two-dimensional, as predicted by the Taylor–Proudman theorem.
The Ekman and Rossby numbers are defined as  $E=\nu /\varOmega h^2$ and $Ro=U/\varOmega b$, where $U=Q/2{\rm \pi} h^2E^{1/2}$ (Foster Reference Foster2014). Experiments were performed for $Ro=0.023$ ( $Q=3.3~\text {cm}^{3}~\text {s}^{-1}$), $Ro=0.034$ ( $Q=4.8~\text {cm}^{3}~\text {s}^{-1}$) and $Ro=0.064$ ( $Q=10~\text {cm}^{3}~\text {s}^{-1}$), with $E=5.4\times 10^{-5}$ in each case. Here we focus on presenting measurements and observations for the case $Ro=0.034$, which are representative. The data for $Ro=0.023$ and $Ro=0.064$ are used in § 5 to illustrate and discuss the effect of $Ro$ on the vortex track.
Henceforth we use dimensionless time, coordinates and velocity defined by
 \begin{equation} t = \varOmega t^*,\quad (x,y,z) = b^{{-}1}(x^*,y^*,z^*),\quad (u,v,w) = U^{{-}1}(u^*,v^*,w^*), \end{equation}
with the start of fluid withdrawal at  $t=0$. We also use $T=t/2{\rm \pi}$ to denote the number of rotation periods and $r_0=r_0^*/b=0.5$ the dimensionless drain position. The flow features are best described and analysed in terms of polar coordinates $(r,\theta,z)$, with the polar velocity components $(u_r,u_\theta )$ calculated from $(u,v)$ using standard transformations.
3. Observations and discussions
The flow evolution for the case when the drain hole is off-axis is very different from that described in § 1 for the axisymmetric case (i.e.  $r_0=0$), and is illustrated by the measured vorticity fields shown in figure 2. The constant discharge stretches the background vorticity and causes the vortex to initially form above the drain. However, after a short period, the vortex moves off the drain along a curved cyclonic trajectory, under the influence of an anticyclonic image vortex located outside the tank's perimeter at $r=1/r_0$ along the radius through the drain hole (Milne-Thomson Reference Milne-Thomson1955). Figure 2(a) shows the initial formation of the vortex at $T=1.3$, but there is no discernible movement off the drain at this early time. The Ekman layers are fully established at this time, and carry the radial inward flux towards the drain. However, the Stewartson-layer structure reported in Foster (Reference Foster2014) has not had time to establish at $T=1.3$. Instead, the inward flux through the base Ekman layer exits straight down the drain hole; the fluid carried by the lid Ekman layer exits vertically downwards via a narrow core, located above the drain hole, with width comparable to $2a$.
$2a$.
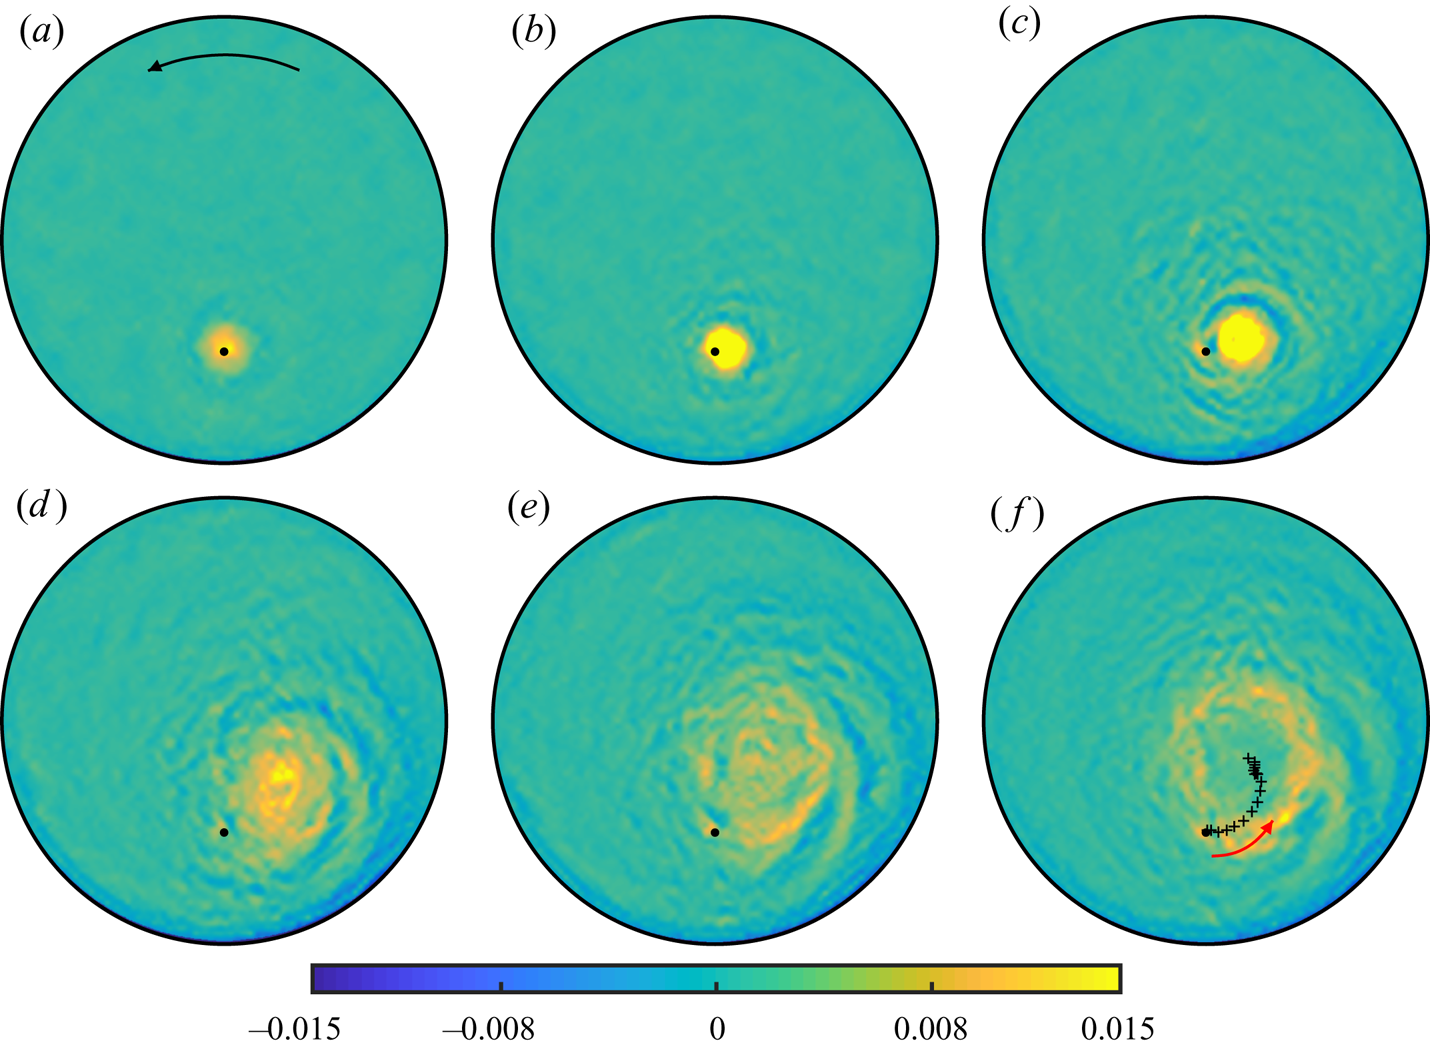
Figure 2. Measurements of vertical vorticity,  $\zeta$, at dimensionless times $T=t/2{\rm \pi}$: (a) 1.3, (b) 4.0, (c) 8.0, (d) 12, (e) 18 and (f) 27. The colour scale for $\zeta$ is shown. The black dot shows the location (but not the size) of the drain hole. The black arrow in (a) indicates the direction of the tank's rotation. The black crosses in (f) show the trajectory taken by the vortex (the red arrow indicates the direction of travel). See supplementary movies available at https://doi.org/10.1017/jfm.2021.1098 for a more detailed time-lapse video.
At time  $T=8$ (figure 2c), the vortex has clearly moved off the drain. During this period, the vorticity remains concentrated and initially continues to increase in magnitude, indicating that the downward vertical flux through the vortex core persists at these times. At times $T=12$ and 18 the movement of the vortex has slowed, as its structure changes markedly. The narrow core, where vorticity is initially concentrated, broadens and eventually becomes empty of vorticity. Eventually, the final state is reached where the structure is essentially stationary and the vorticity is concentrated in a thin shear layer that bounds the irrotational core (i.e. a hollow-core vortex). This final state is shown in figure 2(f); note how the shear-layer structure passes over the drain.
The crosses in figure 2(f) show the cyclonic track of the vortex, which is best presented in polar form, here denoted  $(r_c,\theta _c)$. That is, $(r_c,\theta _c)$ denotes the instantaneous location of the vertical axis through the vortex. The measurements of $r_c$ and $\theta _c/{\rm \pi}$ are plotted in figure 3(a) against time $T$. To show how the track is related to the initial growth of the vortex, measurements of the peak flow speed inside the vortex structure, denoted $u_{\theta,{max}}$, are plotted in figure 3(b) against time $T$. Also, figure 3(c) shows measurements of $u_\theta$, along the radial ray through the centre of the vortex structure (i.e. $\theta =\theta _c$), at various times (see legend). For $0\leqslant T < 6$, the vortex moves off the drain in the cyclonic direction (i.e. $\theta _c$ increases) and follows a circular track, indicated by $r_c=r_0=0.5$ during this period. The vortex retains its ‘traditional’ structure during this period (evident in figure 3c), and grows steadily in intensity, as indicated by the monotonic growth of $u_{\theta,{max}}$. The peak value of $u_{\theta,{max}}$ occurs at $T\approx 5.8$, which corresponds to when the vortex stops moving on a circular track. At subsequent times, the vortex begins to spiral radially inwards towards the rotation axis (i.e. $r_c$ decreases) and the structure of the vortex starts to gradually change. Figure 3(a) shows that the vortex track starts to slow at $T\approx 12$ (i.e. ${\textrm {d}}{\theta _c}/{\textrm {d}}{t}$ decreases), with the near-final state established at $T\approx 17$, with $r_c\approx 0.3$ and $\theta _c\approx 1.75{\rm \pi}$, which corresponds to approximately $50^{\circ }$ from the drain. A measurement of $u_\theta$ taken through the steady vortex structure at time $T=27$ is shown by the red profile in figure 3(c), and clearly shows the irrotational core ( $u_\theta \approx 0$) bounded by a shear layer.
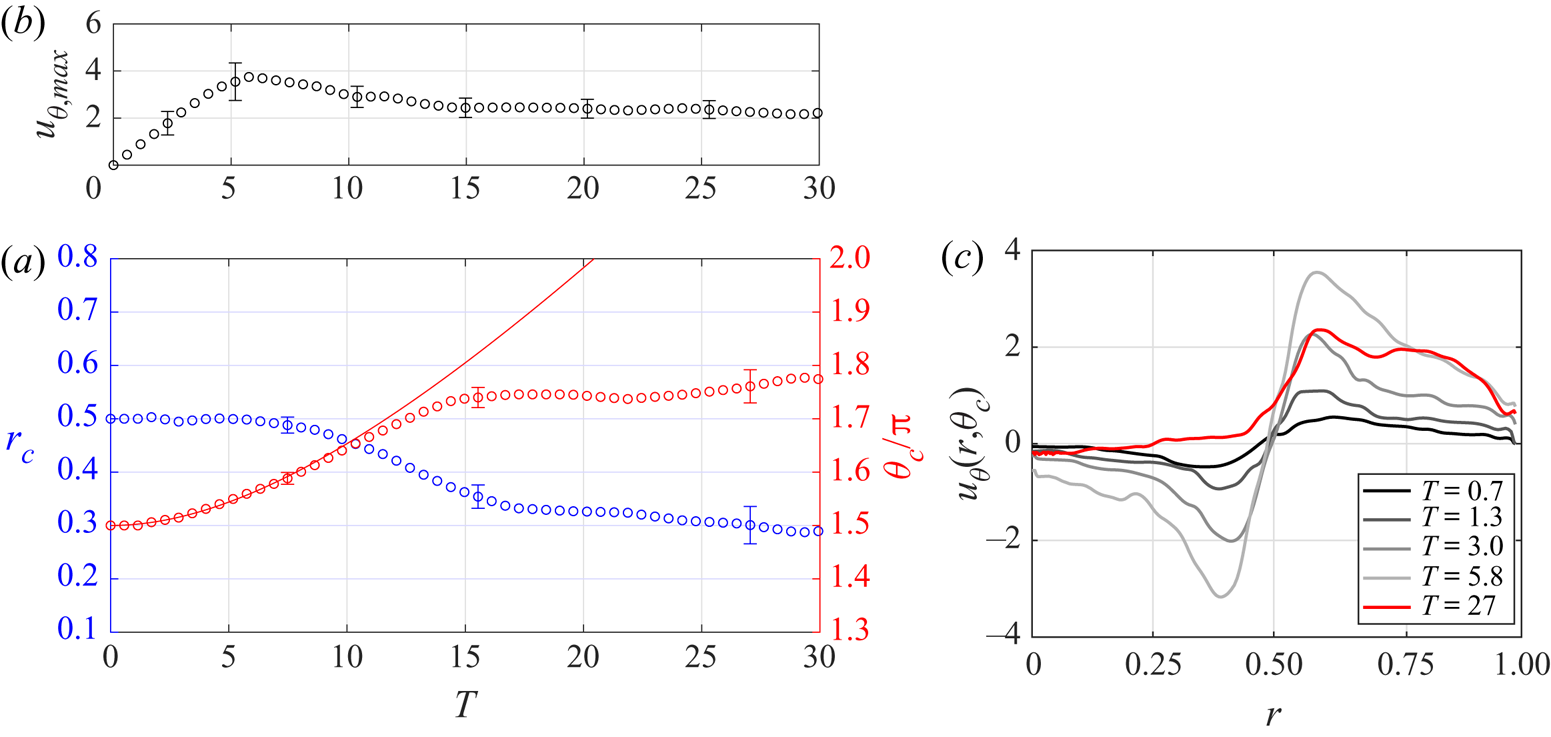
Figure 3. (a,b) Measurements of  $(r_c,\theta _c/{\rm \pi} )$ and $u_{\theta,{max}}$ plotted against dimensionless time $T=t/2{\rm \pi}$. The solid red line shows (4.13b), using $f=0.5$ and $r_0=0.5$. (c) Measurements of the azimuthal velocity, $u_\theta$, along the radial ray through $\theta =\theta _c$, plotted against $r$, at various times (see legend). The red profile corresponds to the steady state (at $T= 27$).
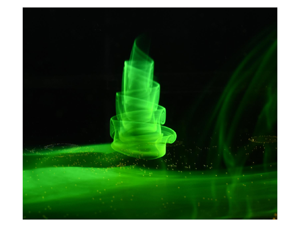
It is of interest to also consider how the flow evolves immediately above the drain. As the vortex moves off the drain, fluid no longer exits the vortex core vertically downwards through the drain. Instead, a no-penetration condition is imposed at the base of the vortex, by the tank floor. The result is dramatic, as illustrated by figure 4, which shows a dye-visualisation sequence. Here, fluorescein dye introduced at the bottom of the cylindrical section is advected by the base Ekman layer towards the drain hole and photographed.

Figure 4. Dye visualisation photographs taken at dimensionless times  $T=t/2{\rm \pi}$: (a) 1.3, (b) 2.0, (c) 2.5, (d) 3.2, (e) 4.2 and (f) 6.4. The yellow dot indicates the position (but not the size) of the drain hole. The scale shown in (a) applies to each image. See supplementary movies for a more detailed time-lapse video.
Figure 4(a) corresponds to early time, where the dye simply marks the radial Ekman flux, spiralling inwards, then exiting the drain. There are clearly no Stewartson layers present around the vertical vortex core. When the vortex moves off the drain, the downward vertical flux through the core is redirected horizontally by the tank's floor, in the process carrying entrained dye with it. Figure 4(b–d) shows the local flow produced swirls around the vortex core and vertically upwards, forming a series of concentric sheets. The sheet structure forms relatively quickly and is largely complete by  $T\approx 4$, with the structure having attained a height $\approx 0.3h$ above the tank floor. (In fact, this upward, inward and then downward motion of the fluid through the vortex is consistent with the time-developing Stewartson-layer structures, but details are not shown here.) As the vortex moves further from the drain, the dyed fluid marks the gradual broadening of the initially narrow vortex core (figure 4e–f).
The development and advection of the vortex is a complicated matter when one attempts to understand the mechanisms in play. First, the circulation about the vortex develops due to the stretching of the background vorticity, caused by Ekman inflow that results from the constant discharge through the drain. Details of that process may be quantified by means of a generalised Kelvin theorem, as shown in § 4. Secondly, the vortex moves off the drain, finding its way to a near-steady-state location on the time scale  $E^{-1/2}\varOmega ^{-1}$. As already noted, the initial motion of the vortex is due to the influence of an image, anticyclonic vortex, located at $r=1/r_0$ along the radius through the drain (Milne-Thomson Reference Milne-Thomson1955). Superposing the vortices at the two indicated locations gives a streamfunction which satisfies the impermeability condition on $r=1$. This inviscid model predicts that the vortex would continue to move around the container on a circular path with $r_c=r_0$, under the influence of that image vortex. Clearly, then, the fact that it comes to rest, with an altered structure, is evidence of effects of viscosity.
There seem to be two such influences. First, as the motion develops, nonlinear boundary layers form on the circular container wall, with consequent asymmetric distribution of anticyclonic vorticity, which appears to retard the cyclonic advection of the vortex, so that it comes finally to a steady location. Evidence of that asymmetry can be seen in the plot of displacement thickness shown in figure 5(a), determined by a standard boundary-layer computation (Munro, Hewitt & Foster Reference Munro, Hewitt and Foster2015), at  $T=10.4$. Qualitatively, one can think of the wall boundary layer as thickening ahead of the vortex location, causing the vortex to move inwards. The second matter has to do with a peculiarity of inviscid, small-Rossby-number flows, for which the inviscid Taylor–Proudman theorem indicates that it is impossible for the fluid to flow out of the tank in a hole in its floor. Hence, such an outflow can occur only in a zone in which viscous forces are important. At small Ekman numbers, such a zone is one with high vorticity. Initially, the outflow occurs under the narrow vortex core over the drain. However, as the motion evolves, and the vortex moves off the drain, the outflow constraint requires high vorticity over the drain. What appears to happen, then, is that the vortex core broadens, becoming ultimately a hollow-core vortex, with a segment of the narrow ring of vorticity always constrained to pass over the drain. As noted earlier, that pattern is very evident in figure 2 (see also the time-lapse video of vorticity maps in the supplementary movies).
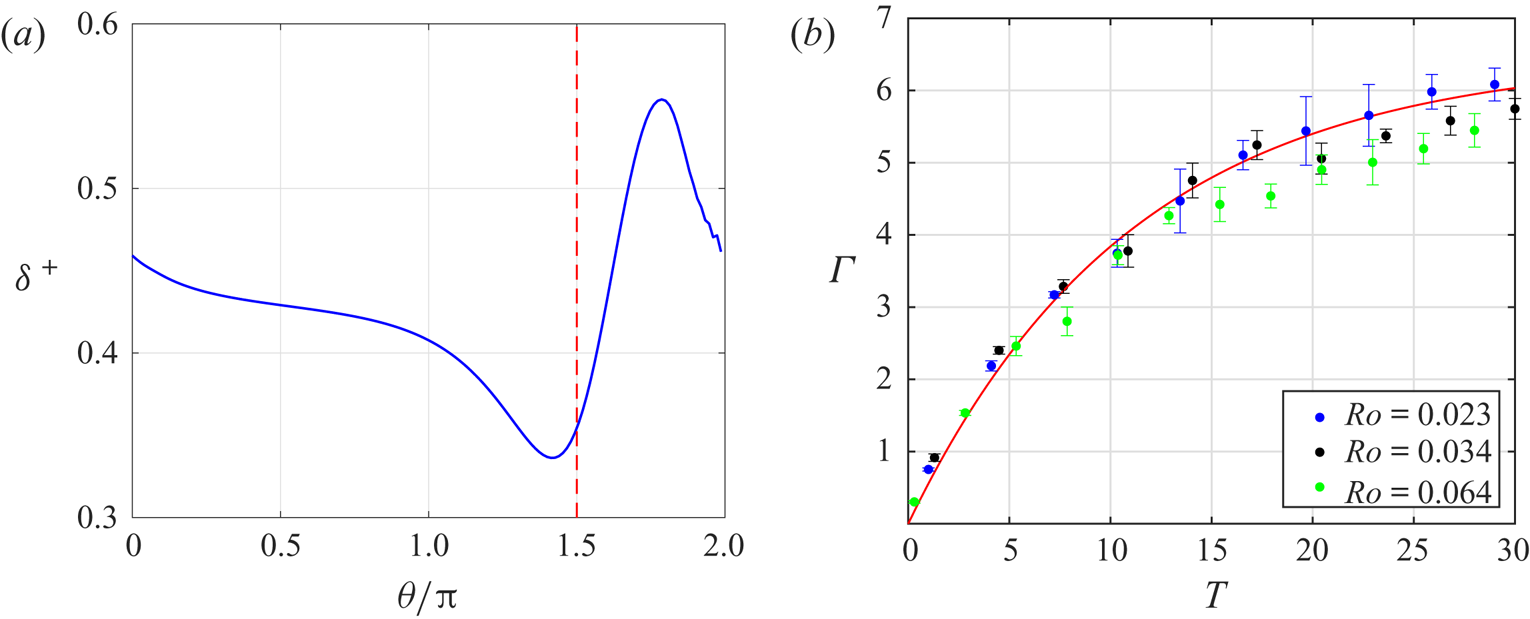
Figure 5. (a) Boundary-layer displacement thickness,  $\delta ^+$, as a function of azimuth, $\theta /{\rm \pi}$, for $T=10.4$. The actual dimensionless thickness is $E^{1/4}\delta ^+$. The broken line indicates the drain location. (b) Measurements of $\varGamma$ obtained from the experiments (see legend), plotted against dimensionless time $T=t/2{\rm \pi}$ and compared with (4.8) (red line).
One might expect that the structure of the vortex core would be essentially that worked out in Foster (Reference Foster2014), but advected along the vortex path, However, that is not the case, and the reasons for that may be understood in terms of time scales. Linear Stewartson layers provide good agreement with experiments in these problems (see Foster Reference Foster2014, for example), so their dynamics provides some insight into the mechanisms at play here. The inner ‘third layer’ develops on a relatively short scaled time  $T_{1/3}\sim E^{-1/3}/(2{\rm \pi} )$, whereas the inviscid flow away from the vortex and, significantly, the outer ‘quarter layer’, develop on the time scale $T_{1/4}\sim E^{-1/2}/(2{\rm \pi} )$. For our experiments, $T_{1/3}=4.2$ and $T_{1/4}=22$. So, that means that by the time the vortex is at the stage shown in figure 4(e) (or figure 2b), the third layer is quasi-steady, but the outer quarter layer is still in the early stages of formation.
However, as we shall see below, the distance of the advecting vortex away from the drain scales like  $Ro\,E^{1/2}t^2$ for short times, so when that distance is order one, $T\sim (Ro\,E^{1/2})^{-1/2}/(2{\rm \pi} )\sim 11$, as can be seen in figure 3(a). In fact, if that distance is of the order of the quarter-layer thickness, $T\sim (Ro\,E^{1/4})^{-1/2}/(2{\rm \pi} )\sim 2.9$, so even at very short times, when the quarter layer has only just begun to form, the vortex is no longer centred over the drain within that layer, so the quarter-layer structure is already strongly asymmetric as well as being unsteady. We conclude that it is therefore very unlikely that the sort of vortex-core structures found by Foster (Reference Foster2014) could ever arise in this case, even in some quasi-steady sense.
Actually, for our Ekman number, if the quarter layer were to be fully developed before the vortex advection begins, then we would require  $Ro\ll E^{3/4}=0.0006$, a value totally impossible to achieve in the laboratory. Actually, the movement of the core off the drain and its widening in time lead to significant complications in any asymptotic analysis since the core is no longer ‘thin’ in any sense beyond $T$ values of $12$. Such analysis is beyond the scope of this paper.
4. An inviscid model
The dimensionless inviscid equation of motion in the rotating frame is
 \begin{equation} {\boldsymbol u}_t + 2{\boldsymbol k}\times{\boldsymbol u} + Ro ({\boldsymbol u}\boldsymbol{\cdot}\boldsymbol{\nabla}){\boldsymbol u} +\boldsymbol{\nabla} p={\boldsymbol 0}. \end{equation}
Taking the curl of this equation, with  $\boldsymbol {\omega }=\boldsymbol {\nabla } \times {\boldsymbol u}$, gives
 \begin{equation} \boldsymbol{\omega}_t - 2w_z{\boldsymbol k} + Ro[({\boldsymbol u}\boldsymbol{\cdot} \boldsymbol{\nabla})\boldsymbol{\omega}-(\boldsymbol{\omega}\boldsymbol{\cdot} \boldsymbol{\nabla} ){\boldsymbol u}]={\boldsymbol 0}. \end{equation}
The horizontal components of this equation suggest that the horizontal components of vorticity are of order  $Ro$, which is small in our experiments, so the $(\boldsymbol {\omega }\boldsymbol {\cdot } \boldsymbol {\nabla } w)$ term in the vertical component of this equation is negligible, and all the more because $w$ itself is small as well, of order $E^{1/2}$, due to Ekman pumping. Then, the approximate vertical component of (4.2) is
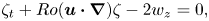 \begin{equation} \zeta_{t}+Ro ({\boldsymbol u}\boldsymbol{\cdot} \boldsymbol{\nabla})\zeta-2w_z = 0, \end{equation}
provided both  $Ro, E \ll 1$, with $\zeta \equiv \boldsymbol {\omega }\boldsymbol {\cdot }{\boldsymbol k}$. Note that the terms neglected in this equation are ${{O}}(Ro\, E^{1/2}, Ro^2)$. The term ‘ $-2w_z$’ can be understood to be the stretching of the vortex lines of the background rotation.
At small Rossby numbers, it follows from the Taylor–Proudman theorem that  $w_{zz}=0$ in the interior flow, and since there is outflow at the drain, we can write
 \begin{equation} w_z=\frac{E^{1/2}}{r_0} 2{\rm \pi} \delta(r-r_0)\delta(\theta+{\rm \pi}/2). \end{equation}
However, away from the drain itself, there is also inflow/outflow from the Ekman layers on both top and bottom walls, and so we can modify this equation to account for that effect, using the standard Ekman suction law, giving
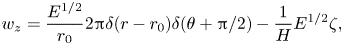 \begin{equation} w_z=\frac{E^{1/2}}{r_0} 2{\rm \pi} \delta(r-r_0)\delta(\theta+{\rm \pi}/2)-\frac{1}{H}E^{1/2}\zeta, \end{equation}
where  $H=h/b$. Substitution into (4.3) gives
 \begin{equation} \zeta_t+Ro ({\boldsymbol u}\boldsymbol{\cdot} \boldsymbol{\nabla})\zeta+\frac{2}{H}E^{1/2}\zeta = \frac{4{\rm \pi}}{r_0}E^{1/2}\delta(r-r_0)\delta(\theta+{\rm \pi}/2). \end{equation}
Note that we have entitled this section ‘An inviscid model’, which is a little misleading, but it is meant to note that no viscous terms are retained in (4.1), but effects of friction on top and bottom walls are indeed included in (4.6).
If we define  $\varGamma$ as the circulation around a material path, ${\mathcal {C}}$, that lies in the horizontal plane that is mid-way between the upper and lower boundaries, then, as the flow evolves, that path deforms and moves in a fashion so as to always contain all of the vorticity due to the outflow. Integration of (4.6) over the interior of ${\mathcal {C}}$, following the standard derivation of the Kelvin theorem (see Lamb Reference Lamb1932), leads to its generalisation in this sink-driven, rotating flow,
 \begin{equation} \varGamma_t+\frac{2}{H}E^{1/2}\varGamma=E^{1/2}4{\rm \pi},\quad \varGamma \equiv \oint_{{\mathcal{C}}} \boldsymbol{u} \boldsymbol{\cdot} {\textrm{d}}\boldsymbol{\ell}, \end{equation}
and its solution is
 \begin{equation} \varGamma = 2{\rm \pi} H [1-\exp(-2E^{1/2}t/H)]. \end{equation}
This result is shown in figure 5(b), plotted alongside measurements of  $\varGamma$ obtained from the experimental data by integrating the vorticity. The excellent agreement appears to confirm the validity of this analysis.
According to Milne-Thomson (Reference Milne-Thomson1955), if we model this motion by the placement of a vortex of strength  $\varGamma '$ at location $r=r_c(t)$, $\theta =\theta _c(t)$, then placement of an ‘image’ vortex of equal and opposite strength at $r=1/r_c$, along the same ray from the origin, assures that $r=1$ is a streamline for the inviscid motion. The third of the Helmholtz vortex laws (Lamb Reference Lamb1932) states that vortex lines move with the fluid, so that the vortex at $r=r_c$ moves under the influence of the image vortex. The scaled velocity component at the primary vortex due to the image is
 \begin{equation} u_{\theta,c}=\frac{\varGamma'}{2{\rm \pi} (1/r_c-r_c)}. \end{equation}
Since this induced velocity is normal to the ray through  $r_c$, there is no radial velocity component in this inviscid theory (i.e. $u_{r,c}=0$), so we conclude that the radial location is unchanged, and hence
 \begin{equation} r_c\equiv r_0. \end{equation}
Replacing  $r_c$ by $r_0$ everywhere, the azimuthal speed of the vortex is
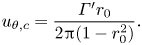 \begin{equation} u_{\theta,c}=\frac{\varGamma' r_0}{2{\rm \pi}(1-r_0^2)}. \end{equation}
With  $\varGamma '$ as a function of time, this equation may be integrated to give an expression for the motion of the vortex.
At first, one would think of putting  $\varGamma '=\varGamma$, but that is naive and incorrect, because in fact the Helmholtz vortex law is not obviously applicable. The reason for that is, as noted on page 3, that one edge of the advecting vortex must remain tethered to the drain, so the vortex itself is not ‘free’ to move under the influence of the image. We have found that writing $\varGamma '=f\varGamma$, with $f=0.5$, gives excellent agreement with vortex-track data. The justification for this choice is beyond the scope of this paper, and will be reported later. Suffice it to say that the choice $f=0.5$ gives remarkable agreement with vortex-track data over the range of parameters tested, as discussed in § 5 below.
Recalling that the starred quantities are dimensional,
 \begin{align} &r_0^*\frac{\mathrm{d} \theta_c}{\mathrm{d} t^*} = Uu_{\theta,c} \quad \Longrightarrow \nonumber\\ &\frac{\mathrm{d} \theta_c}{\mathrm{d} t} = \frac{Ro}{r_0}u_{\theta,c} = Ro\frac{\varGamma'}{2{\rm \pi}(1-r_0^2)} =\frac{f\,H Ro}{1-r_0^2} [1-\exp(-2E^{1/2} t/H)]. \end{align}
Integration gives
 \begin{equation} r_c(t) = r_0,\quad \theta_c(t) = \frac{3{\rm \pi}}{2} + \frac{f\,H Ro}{1-r_0^2} \left(t - \frac{H}{2E^{1/2}} [1 -\exp(-2E^{1/2}t/H)]\right). \end{equation}
Equation (4.13b), with  $f=0.5$, is shown by the solid red line in figure 3(a), where agreement with the data up to $T\approx 10$ is evident.
We have seen that the growth of the circulation predicted by (4.8), and the motion of the vortex given in (4.13), occur on the time scale  $t\sim {{O}}(E^{-1/2})$. One might wonder about the presence of inertial-gravity waves in this flow, which correspond to $t\sim {{O}}(1)$. Comments in Greenspan (Reference Greenspan1968) about spin-up problems suggest that such waves, though present, have very small amplitudes, and we certainly find no evidence of these waves in our experimental record. In the problem at hand, and in those discussed by Greenspan, such waves play no role in the flow evolution. If present at all, they are passive.
5. Final remarks
We have reported here the details of the vortex evolution for  $Ro=0.034$ and $r_0=0.5$. It is not possible in this brief paper format to present the same level of detail for the range of parameters tested; we leave that for a subsequent, longer paper, which will also include mathematical modelling of the phenomena observed. However, we have found that all of the underlying phenomena described in § 3 occur over a wider range of small Rossby numbers, $Ro$, and $r_0$ values, and so here we summarise the key observations that result when these two parameters are varied.
Figure 6(a) shows measurements of  $(r_c,\theta _c)$ obtained for $r_0=0.5$ and $Ro=0.023$, 0.034 and 0.064, plotted against a dimensionless time $T Ro$, and compared with (4.13b), again with $f=0.5$. These data show that initially (for $TRo\leqslant 0.2$ to 0.3) the circular track of the vortex predicted by (4.13) describes the motion well. However, at later times viscous effects are significant as we have already noted – evidently causing the vortex to move radially inwards, slow and finally come to rest, with $r_c\approx 0.3$ and $\theta _c/{\rm \pi} \approx 1.75$, approximately $50^\circ$ from the drain. Perhaps surprisingly, these data indicate that the vortex track at later times, and hence the final steady-state location, are independent of $Ro$, to within experimental uncertainty.
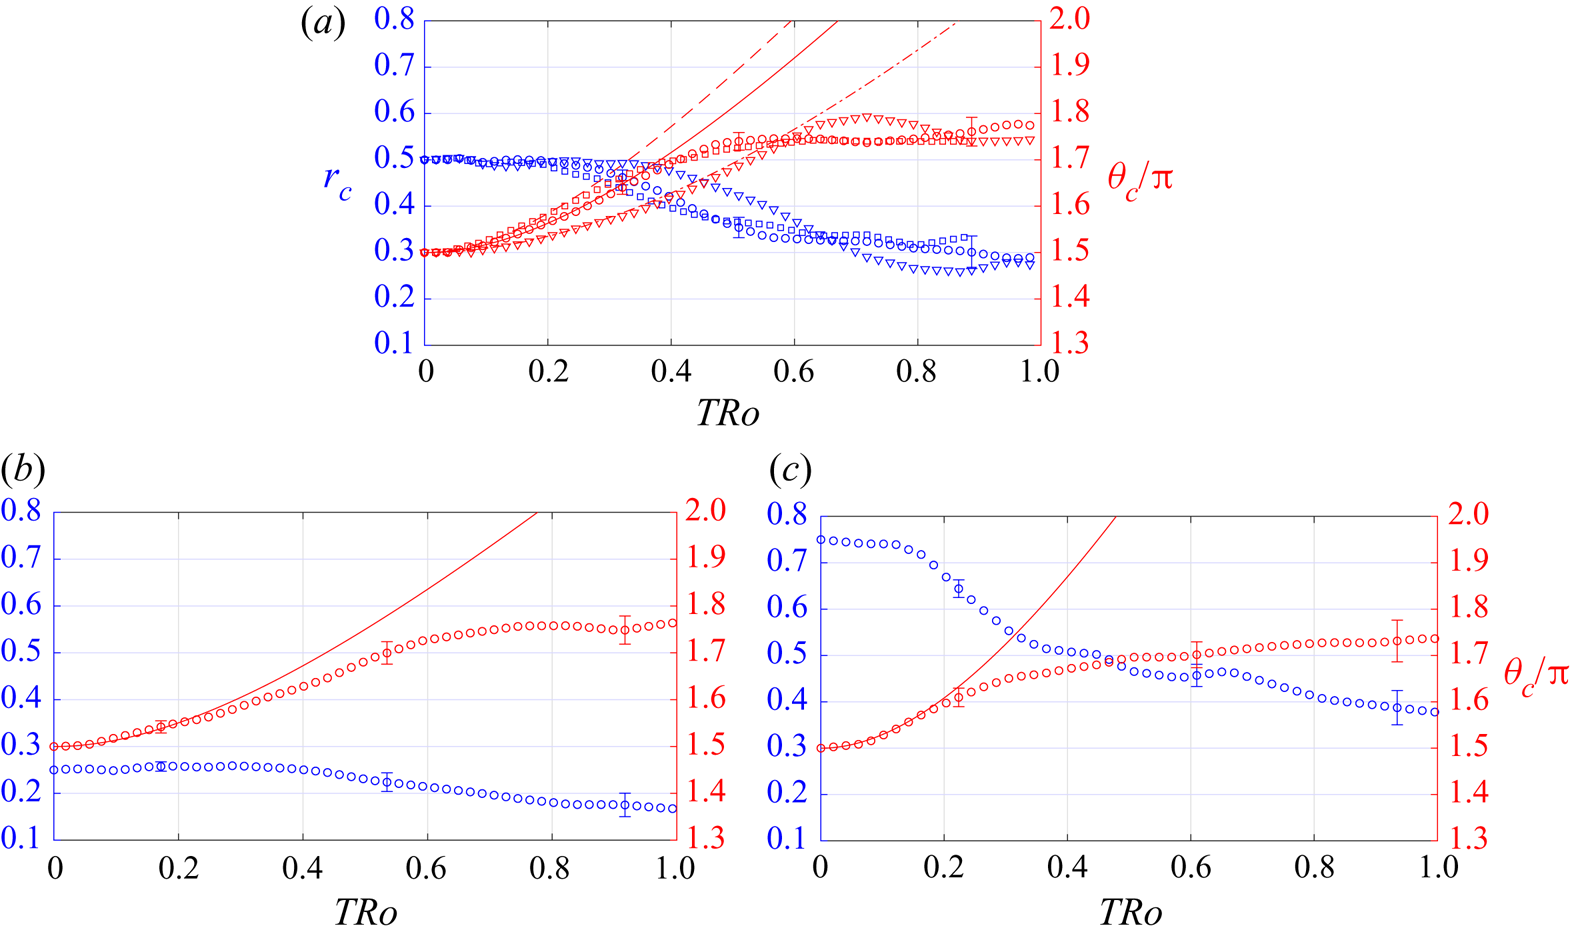
Figure 6. (a) Measurements of  $(r_c,\theta _c/{\rm \pi} )$ for $r_0=0.5$, obtained for different $Ro$, plotted against dimensionless time $TRo$. The red lines show (4.13b), using $f=0.5$. Data are shown for $Ro=0.023$ ( $\square$, broken line), 0.034 ( $\circ$, solid line) and 0.064 ( $\nabla$, dot-dashed line). The error bars shown for $Ro=0.034$ are representative. (b,c) Measurements of $(r_c,\theta _c/{\rm \pi} )$ for $r_0=0.25$ (left) and $r_0=0.75$ (right), plotted against time $TRo$. These data are for $Ro=0.034$. The red lines show (4.13b), using $f=0.5$.
Two key points emerge from other experiments performed with  $r_0=0.25$ and $r_0=0.75$. First, we observed that reducing $r_0$ reduces the actual distance the vortex moves from the drain, and its final core size is smaller. Both features may be understood in terms of inviscid vortex dynamics: Since $r_0$ is smaller, the image location $1/r_0$ is further away, and so the speed of the vortex is reduced, coming to rest closer to the drain. Since one edge of the vortex remains tethered to the drain, the core is much smaller; the ‘hollow core’ vortex that we see for $r_0=0.5$ and 0.75 does not occur for $r_0=0.25$.
Secondly, there are interesting results for the steady-state vortex location. The final steady value for  $r_c$ is dependent $r_0$, as illustrated by the data in figures 6(b) (for $r_0=0.25$) and 6(c) (for $r_0=0.75$). That is, we found that $r_c\rightarrow 0.15$, 0.3 and 0.4 for $r_0=0.25$, 0.5 and 0.75, respectively. However, in all cases we observed, we found that the steady-state value of $\theta _c$ is independent of $r_0$. In fact, $\theta _c/{\rm \pi} \rightarrow 1.75$ to within experimental uncertainty.
Supplementary movies
Supplementary movies are available at https://doi.org/10.1017/jfm.2021.1098.
Declaration of interests
The authors report no conflict of interest.


 Open access