


Introduction
India is witnessing a growing burden of non-communicable diseases (NCDs), and the high burden of overweight and obesity among adults poses a daunting challenge to mitigating them (Ahirwar & Mondal, Reference Ahirwar and Mondal2019). Overweight and obesity present potential risks to human health (WHO Expert Consultation, 2004), and in particular for chronic diseases such as cardiovascular disease, chronic kidney disease, diabetes mellitus, many types of cancers and an array of musculoskeletal disorders (Ezzati et al., Reference Ezzati, Pearson-Stuttard, Bennett and Mathers2018).
According to recent estimates by the Global Burden of Disease (GBD) Network (GBD 2015 Obesity Collaborators, 2017), India is the country with the highest number of overweight and obese children who, as future adults, are likely to contribute to a higher burden of cardio-metabolic morbidity and mortality (Reilly & Kelly, Reference Reilly and Kelly2011; LBD Double Burden of Malnutrition Collaborators, 2020), along with reduced cognitive ability (Li et al., Reference Li, Dai, Jackson and Zhang2008; Kamijo et al., Reference Kamijo, Pontifex, Khan, Raine, Scudder and Drollette2012). There is therefore an urgent need for a sustainable public health strategy to reduce the burden of overweight and obesity in India, as a parallel approach to the country’s intensive efforts to reduce the burden of undernutrition.
It is important to note that India’s 1993 National Nutrition Policy requires considerable modification in the face of the emerging problem of overweight and obesity and the associated rise in the NCD burden (Khandelwal & Reddy, Reference Khandelwal and Reddy2013), as the existing 2017 National Health Policy (Ministry of Health & Family Welfare, 2017) does not include an adequate prevention strategy for overweight and obesity.
This paper provides an overview of the burden of overweight and obesity among men and women aged 15–49 years in rural and urban India and their regional variations using the last two (third and the fourth) waves of the National Family Health Survey (NFHS). The aim of the present study was to summarize the important findings from a sex-stratified analysis of NFHS data to draw the attention of the policy-makers towards the rapid increase in the burden of overweight and obesity in India.
Methods
Data
This study used the data from the third and the fourth rounds of the NFHS, which was carried out in 2005–06 (IIPS & Macro International, 2007) and in 2015–16 (IIPS & ICF, 2017), respectively. The NFHS is a large-scale, multi-round survey conducted with a representative sample of households throughout India, and by virtue of its sampling design estimates from each wave of the survey are comparable (Corsi et al., Reference Corsi, Neuman, Finlay and Subramanian2012). The NFHS is an Indian adaptation of the Demographic and Health Surveys (DHSs), collecting and disseminating information on fertility, mortality, family planning and important aspects of reproductive health, nutrition and health care (IIPS & ICF, 2017). The NFHS collected information on anthropometric measures for both men and women only from the third round (2005–06) onwards.
The third round of the NFHS, termed the NFHS-3, collected information from a nationally representative sample of 109,041 households – 124,385 women aged 15–49 years and 74,369 men aged 15–54 years (IIPS & Macro International, 2007). Weight, height and biomarker measurements formed part of the household questionnaire. Every interviewing team included two health investigators who conducted the anthropometric measurements using a weighing scale (solar-powered electronic SECA scale) and a measuring board. The weighing scale was specially designed and manufactured by Shorr Productions under the guidance of the United Nations Children’s Fund (UNICEF) for use in survey settings. A total sample of 111,126 women and 64,967 men aged 15–49 years from the NFHS-3 were included in the analysis, excluding those with missing anthropometric information. The women’s sample also excluded pregnant women (5911) and women with a birth in the preceding 2 months of the survey (2057).
The NFHS-4 collected data from 601,509 households – 699,686 women aged 15–49 years and 112,122 men aged 15–54 years (IIPS & ICF, 2017). A SECA 874 digital scale and the SECA 213 stadiometer were used to measure the weights and heights of adults in the sampled households, respectively. A total sample of 649,523 women and 100,352 men aged 15–49 years from the NFHS-4 were included in the analysis, excluding those with missing anthropometric information. In addition, the women’s sample also excluded pregnant women (32,428) and women with a birth in the preceding 2 months of the survey (5754).
Measures
The NFHS used the collected information on weight and height of the sampled individuals to calculate Body Mass Index (BMI). BMI is calculated by dividing weight in kilograms by height in metres squared (kg/m2). For the Asian population, the World Health Organization (WHO) recommends individuals with a BMI of 23.00–27.49 kg/m2 are considered overweight and those with a BMI of ≥27.50 kg/m2 are obese (WHO, 1995, 2000). This study analysed overweight and obesity among survey participants, or alternatively ‘overweight–obesity’ (BMI ≥23.00 kg/m2), with a supplementary analysis of obesity BMI ≥27.50 kg/m2 in the Indian population.
Overweight–obesity and obesity were measured for both men and women. For comparable estimates, samples for men and women aged 15–49 years were considered. However, the estimates by single year age for men were used for all available years (15–54 years). The estimates were also calculated for comparable geographies (states) between 2005–06 and 2015–16. The wealth index, representing household economic status, age and rural–urban place of residence were also used in the analysis. The wealth index was presented in terms of quintiles of scores generated using principle component analysis based on the number and types of consumer goods the households owned, such as television, bicycle or car, and housing characteristics such as source of drinking water, toilet facilities and flooring materials (IIPS & ICF, 2017).
Analysis
The sex-stratified prevalences of overweight–obesity and obesity were estimated separately by states/union territories (UTs), districts, economic status, place of residence and age. For each state and UT, disparity or heterogeneity across districts was assessed using absolute and relative measures. Along with the district range (DR), presenting minimum and maximum district prevalence within state/UT, standard deviation (SD), presenting the the deviation from the mean level, and urban–rural prevalence ratio (URR) were calculated and reported. An Index of Disparity (ID) (Pearcy & Keppel, Reference Pearcy and Keppel2002) was computed to understand the inter-district disparity in the prevalence of overweight and obesity. The ID refers to the level of heterogeneity within India/state/UT – that is, a summary measure of variation in the prevalence of overweight and obesity across districts. The ID can be expressed mathematically as:
 $${\rm{ID}} = {(\sum \left| {{r_{1 \to n}} - R} \right|/n)\over R} \times 100$$
where r represents the prevalence of overweight–obesity in the district (micro-region); n represents the number of the district; and R represents the prevalence of overweight–obesity in the macro-region (India/state/UT). In addition, the linear regression line fit were estimated to show the extent of association between attributes presenting the coefficients of determination (R 2). The prevalence estimates were produced by applying appropriate sampling weight to respective datasets. Analyses were performed using the statistical software – Stata Version 14 (StataCorp, 2015). The figures and maps were developed using R software (R Core Team, 2019) and ArcGIS software (Environmental Systems Research Institute, 2011), respectively.
Results
Rising trend in overweight and obesity
Figure 1a shows the change in prevalence of overweight–obesity among men and women aged 15–49 years in India between 2005–06 and 2015–16. Overall, both the absolute (difference in prevalence: 2015–16 minus 2005–06) and relative (ratio of prevalence: 2015–16/2005–06) increase in overweight–obesity among men appeared to be higher than that among women. The prevalence of overweight–obesity was lower among men in 2005–06 (18.3%) than among women (21.3%), and this reversed in 2015–16 (men: 34.5%; women: 33.4%). Over half of the men in Sikkim (60.4%), Kerala (54.2%), Goa (52.8%) and Punjab (51.2%) in 2015–16 were overweight–obese, with the highest absolute increase being in Sikkim. Half of the women in Goa (50.7%), Kerala (51.6%) and Punjab (50.0%) were also found to be overweight–obese, with the highest absolute increase occurring in Andhra Pradesh (including Telangana). Overall changes in obesity across major states between 2005–06 and 2015–16 are presented in Figure 1b.

Figure 1. Trend in the prevalence of a) overweight and obesity (overweight–obesity) and b) obesity among men and women aged 15–49 years across the major states of India between 2005–06 and 2015–16. The major states with comparable prevalences across the two survey periods are shown. Abbreviations are as follows: Andhra Pradesh (AP); Arunachal Pradesh (AR); Assam (AS); Bihar (BR); Chhattisgarh (CG); Delhi (DL); Goa (GA); Gujarat (GJ); Haryana (HR); Himachal Pradesh (HP); Jammu and Kashmir (JK); Jharkhand (JH); Karnataka (KA); Kerala (KL); Madhya Pradesh (MP); Maharashtra (MH); Manipur (MN); Meghalaya (MG); Mizoram (MZ); Nagaland (NG); Odisha (OR); Punjab (PB); Rajasthan (RJ); Sikkim (SK); Tamil Nadu (TN); Tripura (TR); Uttar Pradesh (UP); Uttarakhand (UK); and West Bengal (WB). AP represents the combined estimate for Andhra Pradesh and Telangana.
However, the prevalence of obesity remained higher among women than among men during 2005–16 (Table 2). The absolute increases in obesity among men and women were estimated to be equal (4.5 percentage points increase between 2005–06 and 2015–16), whereas the relative increase in obesity was higher among men than among women. This indicates that the pace of the growing burden of obesity among men was higher than among women over this period. During 2015–16, Sikkim had the highest burden of obesity among men (17.6%), with the highest absolute increase, where 19.8% women living in Delhi were estimated to be obese. The relative increase in obesity was the highest among men in Arunachal Pradesh (5.9 times increase between 2005–06 and 2015–16) and among women in Nagaland (3.4 times increase).
Overweight–obesity increase is linked to weight rather than height
While BMI is an important indicator of human health (NCD Risk Factor Collaboration, 2019), understanding the role of height and weight separately is crucial for devising a population-based intervention to reduce overweight and obesity (NCD Risk Factor Collaboration, 2016). Figure 2a presents the relationship between the prevalence of overweight–obesity and its decomposed components: that is, average height and weight of men and women across states over time. These patterns are also shown for rural and urban areas separately.
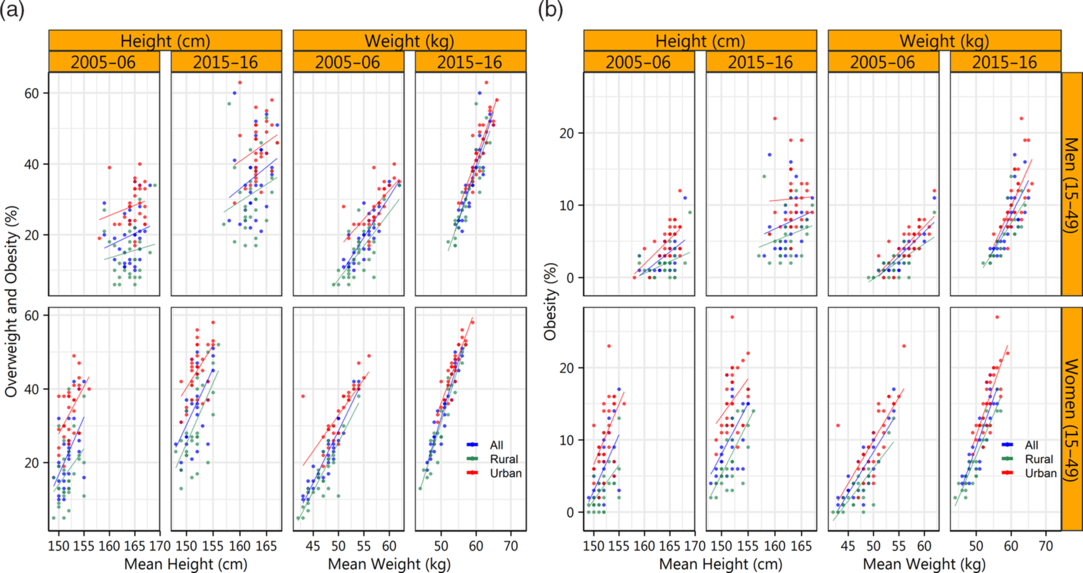
Figure 2. Relationship of individuals’ height and weight with a) overweight–obesity and b) obesity among men and women aged 15–49 years by place of residence over the survey periods 2005–06 and 2015–16.
Overall, the mean heights of men (163 cm) and women (152 cm) estimated during 2015–16 were almost the same as those recorded a decade before in 2005–06 (men: 165 cm; women: 152 cm). This is consistent with the decadal pace of increase in height reported in South Asia (NCD Risk Factor Collaboration, 2016). However, an increase of nearly 4 kg in mean weight was recorded for both men and women between 2005–06 and 2015–16. The mean weight recorded among men was higher (59 kg) than that among women (51 kg), and a higher average weight increase (of 5 kg more) was observed among people living in urban areas than those living in rural areas. Keeping with this trend, Figure 2a suggests that the increase in the burden of overweight–obesity was more of a function of increased weight than change in height. A similar relationship of mean height and weight with prevalence of obesity across states is presented in Figure 2b.
Heterogeneity in overweight–obesity within states
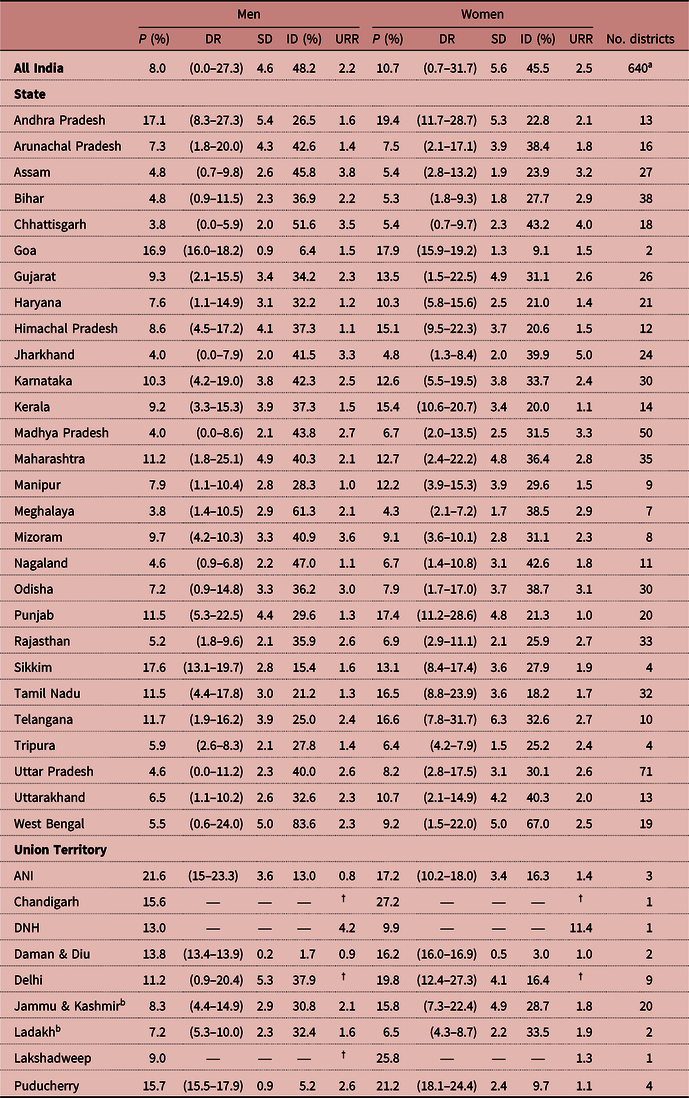
Table 1 presents the level of heterogeneity in the prevalence of overweight–obesity within the states and UTs of India, the minimum and maximum prevalences (DR) within states/UTs, the deviation from the mean level (SD) as well as the urban–rural ratio (URR) of the prevalence separately for men and women aged 15–49 years in 2015–16. Similar information relating to the prevalence of obesity is shown separately in Table 2.
Table 1. Prevalence of overweight–obesity (BMI ≥23.00 kg/m2) among men and women aged 15–49 years, and heterogeneity therein, by state and union territory, India, 2015–16

UT: Union Territory; ANI: Andaman & Nicobar Islands; DNH: Dadra & Nagar Haveli.
P is the prevalence of overweight–obesity; DR (District Range) represents the minimum and maximum prevalences among districts in India/State/UT; SD is the Standard Deviation (expressing how much the prevalence of an individual district differs (positively or negatively) from the average level of all districts in India/State/UT); ID is the Index of Disparity; URR is the urban–rural ratio.
† Inadequate samples for the estimation of rural prevalence.
a As of 2019, there were total 732 districts in India. However, the NFHS-4 was canvassed using the sampling frame based on Census 2011, and thus the separate estimates for 92 newly formed districts could not be available.
b The erstwhile state of Jammu and Kashmir was reorganized into the union territory of Jammu and Kashmir and the Union territory of Ladakh by the official enactment of Jammu and Kashmir Reorganisation Act 2019 since 31st October 2019 (Government of India, 2019).
Table 2. Prevalence of obesity (BMI ≥27.50 kg/m2) among women and men aged 15–49 years and heterogeneity therein by state and union territory, India, 2015–16
UT: Union Territory; ANI: Andaman & Nicobar Islands; DNH: Dadra & Nagar Haveli.
P is the prevalence of overweight–obesity; DR (District Range) represents the minimum and maximum prevalences among districts in India/State/UT; SD is the Standard Deviation (expressing how much the prevalence of an individual district differs (positively or negatively) from the average level of all districts in India/State/UT); ID is the Index of Disparity; URR is the urban–rural ratio.
† Inadequate samples for the estimation of rural prevalence.
a As of 2019, there were total 732 districts in India. However, the NFHS-4 was canvassed using the sampling frame based on Census 2011, and thus the separate estimates for 92 newly formed districts could not be available.
b The erstwhile state of Jammu and Kashmir was reorganized into the union territory of Jammu and Kashmir and the Union territory of Ladakh by the official enactment of Jammu and Kashmir Reorganisation Act 2019 since 31st October 2019 (Government of India, 2019).
The level of the Index of Disparity (ID) depends on the overall prevalence of overweight–obesity and the number of districts within a state. Comparing the states with ten or more districts, overall, the higher the prevalence of overweight–obesity, the lower the disparity. The state of West Bengal recorded the highest disparity with an ID of 39.3% for men and 43.1% for women. Similarly, the disparity in the prevalence of obesity was also estimated to be highest in West Bengal (see Table 2), both among men (ID: 83.6%) and women (ID: 67%). Among the major states, Madhya Pradesh, Chhattisgarh, Maharashtra, Uttar Pradesh and Odisha had disparities in the prevalence of overweight–obesity among men of more than 20%. In the case of overweight–obesity among women, Odisha, Gujarat, Nagaland, Maharashtra, Uttarakhand, Chhattisgarh and Jharkhand had IDs of more than 20%. This suggests that overweight–obese men and women were concentrated in a few districts in these states. An understanding of these estimates provides an opportunity to initiate a discussion on whether a single policy to reduce the burden of overweight–obesity will fit all districts in a given state. So, the identification of clusters and prioritization of public health measures to address the rising burden in those clusters are important measures that could be adopted at the health policy level; however, basic control measures need to be widely incorporated into health policies.
Clusters of overweight and obesity
Figure 3 presents the variation in the prevalence of overweight–obesity among men (Figure 3a) and women (Figure 3b) across the districts of India. A separate display of the prevalence of obesity among men and women across districts is presented in Figures 3c and 3d, respectively. Of the 640 districts covered in the 2015–16 (NFHS-4) there were 67 districts with 50% or more overweight–obese men. More than half of these districts were concentrated in Tamil Nadu, Kerala and Punjab. Similarly, 51 districts had 50% or more overweight–obese women. There were 98 and 181 districts where more than 12% men and women were found to be obese, respectively, suggesting a wider geographical spread of obese women than obese men. Furthermore, the figure clearly shows at least three bigger clusters of overweight–obesity for both men and women, such as south Indian districts covering the states of Kerala, Tamil Nadu and Andhra Pradesh; north Indian districts covering Punjab, Haryana, Chandigarh and Delhi; and north-eastern districts covering Sikkim and Arunachal Pradesh. Apart from these major clusters, urban agglomerations scattered across the country should be the centres of attention for addressing the issue of increasing overweight–obesity.

Figure 3. Distribution of overweight–obesity across districts of India, 2015–16, among a) men and b) women (age 15–49 years). Distribution of obesity among c) men and d) women aged 15–49 years. LK refers to the newly formed union territory of Ladakh. See footnote to Figure 1 for definitions of abbreviations.
Indian obesity is not an exclusively urban phenomenon
An excessive burden of overweight–obesity is often regarded as an urban phenomenon in developing countries, and so it is in India (Luhar et al., Reference Luhar, Timæus, Jones, Cunningham, Patel and Kinra2020). Figure 4 depicts the relationship between the district-level prevalence of overweight–obesity (estimated from the NFHS during 2015–16) among men (Figure 4a) and women (Figure 4b), and the proportion of the male and female population living in urban areas (collated from the 2011 Census of India) across 640 districts. The respective scatterplots also show linear regression line fit and the coefficients of determination (R 2) indicating the extent of association across the major regions. These macro-regions include Central (comprising the states of Chhattisgarh, Madhya Pradesh and Uttar Pradesh), east (comprising the states of Bihar, Jharkhand, Odisha and West Bengal) north (comprising the states/union territories of Chandigarh, Delhi, Haryana, Himachal Pradesh, Jammu and Kashmir, Punjab, Rajasthan and Uttarakhand), north-east (comprising the states of Arunachal Pradesh, Assam, Manipur, Meghalaya, Mizoram, Nagaland, Sikkim and Tripura), south (comprising the states/UTs of Andaman and Nicobar Islands, Andhra Pradesh, Karnataka, Kerala, Lakshadweep, Puducherry, Tamil Nadu and Telangana) and west (comprising the states/union territories of Dadra and Nagar Haveli, Daman and Diu, Goa, Gujarat, and Maharashtra). Region-wise fitted regression lines and the values of R 2 indicate that the prevalence of overweight–obesity was not strongly determined by the proportion of urban population across districts, except districts belonging to the west region. This finding suggests that unlike earlier evidence (Rai, Reference Rai2012), the occurrence of overweight–obesity is not an exclusively urban phenomenon (NCD Risk Factor Collaboration, 2019). Stratified by sex, a region-wise comparison of the relationship between the prevalence of obesity and respective urban population across districts is presented in Figure 4c for men and Figure 4d for women.

Figure 4. Relationship between district-level overweight–obesity with level of urbanization (as per the Census of India, 2011) across the geographical regions of India, 2015–16: a) overweight–obesity among men aged 15–49 years and urban men; b) overweight–obesity among women aged 15–49 years and urban women; c) obesity among men aged 15–49 years and urban men; d) obesity among women aged 15–49 years and urban women.
Figure 5 shows an increasing burden of overweight–obesity compared with underweight in both urban and rural India over the study period. The figure demonstrates the shift in the age by which the prevalence of overweight–obesity becomes higher than the prevalence of underweight both among men and women and in urban and rural areas between 2005–06 and 2015–16. In other words, the figure indicates that the status of overweight–obesity among rural men and women in 2015–16 arrived in early years of their lives, which appeared to be converging with their urban counterparts. Among urban women, the prevalence of overweight–obesity was higher than the prevalence of underweight by age of 22 years onwards compared with that by age of 27 years onwards in rural areas. Compared with the situation in 2005–06, when the prevalence of overweight–obesity surpassing the prevalence of underweight before reaching the age of 30 years was only observed in urban areas, this was also realized by men and women in rural areas in 2015–16. This analysis suggests that overweight–obesity is no longer exclusive to urban areas. Between 2005–06 and 2015–16, the status of overweight–obesity surpassed the underweight status, with a shift of 7 years (from 27 years onwards to 20 years onwards) and 4 years (from 26 years onwards to 22 years onwards) earlier in the life of the adult male and female population in urban areas, respectively. In urban areas of southern states (except for Kerala), western states and the majority of north-eastern states and Odisha in the east, the surpassing of the status of overweight–obesity to underweight status among the adult male population was observed by the age of 20 years onwards and earlier. However, the states where the prevalence of overweight–obesity exceeded that of underweight among the rural adult male population by the age of 23 years onwards or earlier included Haryana, Rajasthan, Punjab, Odisha, Himachal Pradesh as well as the southern and north-eastern states. A similar pattern was observed among the adult female population, where the prevalence of overweight–obesity exceeded the prevalence of underweight by the age of 22 years onwards and earlier in urban areas, and by 27 years onwards and earlier in rural areas. This was again observed in several of the southern, western and eastern states including West Bengal, Odisha, Punjab and Haryana along with rural Himachal Pradesh and Uttarakhand in the north. This rising burden of overweight–obesity among males and females is alarming, as it is appearing in the early and productive years of life, irrespective of rural–urban locations.

Figure 5. Prevalence of overweight–obesity compared with underweight by age among men and women across urban and rural India between 2005–06 and 2015–16.
The affluent are more prone to overweight and obesity
Figure 6 presents the heterogeneity in the prevalence of overweight–obesity across states by wealth quintiles (Rutstein & Johnson, Reference Rutstein and Johnson2004) between the period 2005–06 and 2015–16. On average, the ratio of the prevalence of overweight–obesity among men in the richest wealth quintile to that in the poorest wealth quintile declined from 10 in 2005–06 to 4 in 2015–16. Similarly, the ratio among women declined from 8 in 2005–06 to 4 in 2015–16. Previous studies in India have indicated similar relationships (Little et al., Reference Little, Humphries, Patel and Dewey2016; Siddiqui & Donato, Reference Siddiqui and Donato2016). People of higher socioeconomic status, or the more privileged, in developing countries generally follow lifestyles that are more sedentary or are engaged in less labour-intensive occupations, and consume more calories due to their greater purchasing ability (Bhurosy & Jeewon, Reference Bhurosy and Jeewon2014; Lear et al., Reference Lear, Teo, Gasevic, Zhang, Poirier and Rangarajan2014). However, the heterogeneity in the prevalence of overweight–obesity across states appeared to be higher in all the wealth quintiles except richest wealth quintile between 2005–06 and 2015–16.

Figure 6. Heterogeneity in the prevalence of overweight–obesity among men and women by household economic status (wealth quintile) in India in 2005–06 and 2015–16.
Discussion
The present analysis clearly shows a growing burden of overweight and obesity among Indian men and women in both urban and rural areas. During 2015–16, the prevalence of obesity (BMI ≥27.50 kg/m2) among women was higher by nearly 3 percentage points than among men, and this was even higher in urban areas. However, the prevalence of overweight–obesity (BMI ≥23.00 kg/m2) among men was slightly higher than among women, except in urban areas. A considerable regional (inter-district) disparity was observed in overweight and obesity, with little difference across urban and rural areas. Individual awareness about the importance of the regular monitoring of weight and of physical activity and exercise are proven measures that would help reduce the burden of overweight and obesity in India. A systematic review has suggested that physical exercise, coupled with dietary changes, could be an effective weight-loss intervention among adults (Shaw et al., Reference Shaw, Gennat and O’Rourke Pand Del Mar2006). It is suggested that the National Programme for Prevention and Control of Cancer, Diabetes, Cardiovascular Disease and Stroke (NPCDCS) (McMurry et al., Reference McMurry, Shivashankar, Mendenhall and Prabhakaran2017) and the National Health Policy 2017 (Ministry of Health & Family Welfare, 2017) should look at the feasibility of a culturally sensitive intervention to reduce the level of overweight and obesity among the Indian populace (Rai et al., Reference Rai, Jaacks, Bromage, Barik, Fawzi and Chowdhury2018). The prevention and management of overweight and obesity is a complex problem with no easy answers. However, it is necessary to address lifestyle issues by modifying health risk behaviours. In addition, research on barriers and stimulants to positive lifestyle change needs emphasis.
India is a signatory of the United Nation’s Decade of Action on Nutrition (2016–2025) (United Nations, 2016), where the member countries have united to combat malnutrition and reduce overweight and obesity as part of their multifaceted agenda. However, federal India’s policy towards addressing the prevalence of overweight–obesity and its associated risk factors needs important modification. Reducing the level of undernutrition in India has been a long-standing challenge to the country, but policymakers now need to proactively work on the rapidly emerging challenge of the rising burden of overweight and obesity. Effective gender-sensitive and culturally adaptable policy initiatives and interventions are urgently required to control the rising incidence of overweight and obesity among the Indian population.
Funding
This research received no specific grant from any funding agency, commercial entity or not-for-profit organization.
Conflict of Interest
The authors have no conflicts of interest to declare.
Ethical Approval
The authors declare that all procedures contributing to this work comply with the ethical standards of the relevant national and institutional committees on human experimentation and with the Helsinki Declaration of 1975, as revised in 2008.


 Open access