


1 Introduction
Supercontinuum (SC) fiber sources have been a fruitful research area in recent years, and have the beneficial properties of a broadband spectrum, good spatial coherence and a compact structure for a wide range of applications, such as hyperspectral lidar, optical coherence tomography, optical frequency metrology, and white-light trapping[Reference Hakala, Suomalainen, Kaasalainen and Chen1–Reference Wang, Lee, Ding, Lian, Feng, Ma, Bo, Wu, Semenova, Loh, Farrell and Brambilla6]. The development of highly nonlinear photonic crystal fibers (PCFs) has greatly improved the interplay of multiple nonlinear effects for broadband SC generation[Reference Genty, Ritari and Ludvigsen7, Reference Stphane, Chau, Leonhardt, Harvey, Knight, Wadsworth and Russell8]. By adjusting the geometrical parameters of a PCF, primarily including the core diameter, the air-hole diameter and the hole pitch, the dispersion properties, especially the zero-dispersion wavelength (ZDW), can be designed to meet the phase-matching requirements, facilitating the realization of a broad SC spectrum[Reference Qi, Chen, Jin, Liu and Hou9–Reference Dobrakowski, Rampur, Stępniewski, Anuszkiewicz, Lisowska, Pysz, Kasztelanic and Klimczak15]. The UV to near-IR region is important in biomedical imaging and fluorescence lifetime imaging fields[Reference Hakala, Suomalainen, Kaasalainen and Chen16, Reference Blandin, Druon, Hanna, Lvquefort, Lesvigne and Couderc17]. However, these applications always require a linearly polarized SC, whereas the generated SC is generally unpolarized.
At present, there are two methods for generating a linearly polarized SC. One is utilizing multiple nonlinear effects excited by a high peak power to extend the spectrum in a polarization-maintaining (PM) master oscillator power amplifier (MOPA) structure. Zhang et al. reported a 124 W linearly polarized SC in a PM MOPA system. The measured polarization extinction ratio (PER) of the whole SC source is about 7.5 dB[Reference Zhang, Jin, Ma, Chen and Hou18]. Owing to the low nonlinear coefficient and the difficulty in controlling the dispersion properties of conventional fibers, the spectrum is broadened only from 850 nm to 1900 nm. To further broaden the spectrum, highly nonlinear fibers such as PCFs have been widely used in broadband SC generation for their excellent characteristics, such as high nonlinearity and tailorable dispersion[Reference Coen, Chau, Leonhardt, Harvey, Knight, Wadsworth and Russell19, Reference Qi, Chen, Li, Liu, Ou, Wang and Hou20]. Therefore, another effective way for obtaining a linearly polarized SC is using highly birefringent PCFs[Reference Xiong and Wadsworth21–Reference Wang, Li, Han, Du, Xia and Hou26]. In 2003, Lehtonen et al. realized SC broadening from 400 to 1750 nm in a PCF[Reference Lehtonen, Genty, Ludvigsen and Kaivola27]. Tarnowski et al. demonstrated a polarized all-normal dispersion SC generated in a birefringent silica PCF spanning from 750 nm to over 2500 nm in 2017[Reference Tarnowski, Martynkien, Mergo, Poturaj, Anuszkiewicz, Bjot and Krzysztof28]. These PCFs always have a noncircularly symmetric structure to induce high birefringence. The combination of high birefringence, dispersion and high nonlinearity allows the polarization state to be maintained while generating the SC. Also, the preserved polarization enhances the nonlinear interactions so that less power is required to generate the SC. However, most previously reported linearly polarized SC generation from PCFs has been spatially coupled, mainly limited by the severe mode field mismatch and the difficulty of polarization-maintaining alignment when splicing different kinds of fibers, and is often pumped with femtosecond pulses for high peak power to reach the nonlinear threshold. Therefore, the power of the linear polarization SC generated in PM-PCF is limited to the milliwatt level and the spectrum does not cover the whole visible to near-infrared region.

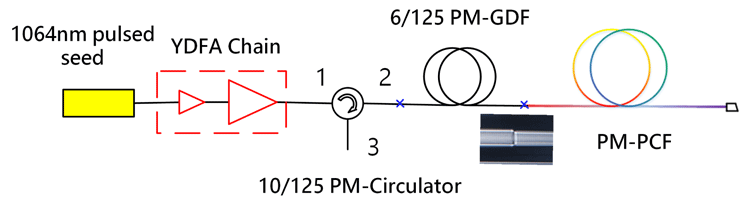
Figure 1. Experimental setup of the linearly polarized SC source.
In this paper, we adopt a polarization-maintaining PCF splicing method and first demonstrate an all-fiber high-power linearly polarized SC source from PM-PCF. The PER is measured to be greater than 20 dB at selected sample wavelength points (532 nm, 1064 nm and 1550 nm) at the highest pump power level and greater than 20 dB at all wavelengths from 800 nm to 1500 nm at a low pump power level. Three different lengths of PM-PCFs (1.6 m, 3 m, and 6 m) are used to study the effect of fiber length on SC generation. A different SC is generated when the pump pulses are polarized along different axes of the PM-PCF. The experimental results are highly consistent with the theoretical simulation in terms of the spectral broadening tendency.

Figure 2. Calculated dispersion curve of the PM-PCF. Inset: micrograph cross-section and simulation diagram of the PM-PCF.
2 Experimental setup
The experimental configuration of the linearly polarized SC source is shown in Figure 1, comprising a picosecond pulsed seed source, an ytterbium-doped fiber amplifier (YDFA) chain with a pigtail of 10/125 $\unicode[STIX]{x03BC}$
m fiber, a 10/125
$\unicode[STIX]{x03BC}$
m fiber, a 10/125 $\unicode[STIX]{x03BC}$
m polarization-maintaining circulator (PM-CIR), a piece of 0.2 m long 6/125
$\unicode[STIX]{x03BC}$
m polarization-maintaining circulator (PM-CIR), a piece of 0.2 m long 6/125 $\unicode[STIX]{x03BC}$
m germanium-doped fiber (PM-GDF), and a piece of PM-PCF. In our experiment, the seed and the YDFA chain act as the pump source to generate the SC, delivering 150 ps duration pulses with a central wavelength of 1064 nm at a repetition rate of 4 MHz. The PER of the pump source is 10 dB, monitored by an extinction ratio meter that operates in the wavelength range 800–1700 nm. A 10/125
$\unicode[STIX]{x03BC}$
m germanium-doped fiber (PM-GDF), and a piece of PM-PCF. In our experiment, the seed and the YDFA chain act as the pump source to generate the SC, delivering 150 ps duration pulses with a central wavelength of 1064 nm at a repetition rate of 4 MHz. The PER of the pump source is 10 dB, monitored by an extinction ratio meter that operates in the wavelength range 800–1700 nm. A 10/125 $\unicode[STIX]{x03BC}$
m PM-CIR (fast axis blocked) is used as a polarizer to improve the pump PER to 25 dB, as well as an isolator to protect the seed from backward propagating light. The PM-PCF (NKT Photonics LMA-PM-5) has a core diameter of 4.4
$\unicode[STIX]{x03BC}$
m PM-CIR (fast axis blocked) is used as a polarizer to improve the pump PER to 25 dB, as well as an isolator to protect the seed from backward propagating light. The PM-PCF (NKT Photonics LMA-PM-5) has a core diameter of 4.4 $\unicode[STIX]{x03BC}$
m, an air-hole pitch of 3.32
$\unicode[STIX]{x03BC}$
m, an air-hole pitch of 3.32 $\unicode[STIX]{x03BC}$
m and an air-hole diameter of 1.36
$\unicode[STIX]{x03BC}$
m and an air-hole diameter of 1.36 $\unicode[STIX]{x03BC}$
m, as shown in the inset of Figure 2, and is utilized as the main nonlinear material to generate a linearly polarized SC. The air-to-pitch ratio is 0.41, less than 0.45, indicating that the PM-PCF has the property of maintaining a single mode structure at the operating wavelengths[Reference Birks, Knight and Russell29]. Two stress-application areas create stress on the silica core and induce stress birefringence, resulting in maintaining the polarization state when light propagates along the principal axes in the PM-PCFs. The birefringence is
$\unicode[STIX]{x03BC}$
m, as shown in the inset of Figure 2, and is utilized as the main nonlinear material to generate a linearly polarized SC. The air-to-pitch ratio is 0.41, less than 0.45, indicating that the PM-PCF has the property of maintaining a single mode structure at the operating wavelengths[Reference Birks, Knight and Russell29]. Two stress-application areas create stress on the silica core and induce stress birefringence, resulting in maintaining the polarization state when light propagates along the principal axes in the PM-PCFs. The birefringence is $1.5\times 10^{-4}$
at 1064 nm for the fiber. The corresponding polarization beat length and attenuation parameters at 1064 nm are about 7 mm and less than 7 dB/km, respectively.
$1.5\times 10^{-4}$
at 1064 nm for the fiber. The corresponding polarization beat length and attenuation parameters at 1064 nm are about 7 mm and less than 7 dB/km, respectively.
To build an all-fiber structure for compactness and robust operation, the pump source and the PM-PCF are fusion spliced. However, owing to the severe mode field mismatch induced by inconsistency in the core size between the pigtail fiber of the PM-CIR and the PM-PCF, a 0.2 m long 6/125 $\unicode[STIX]{x03BC}$
m PM-GDF is utilized as a transition between them. Developing a splicing technique for PCFs can be challenging and require special attention to retain good optical properties at the splicing point. By optimizing the parameters of the fusion splicer, such as discharge intensity and discharge position, two polarization-maintaining splicing joints between the PM-CIR, the PM-GDF and PM-PCFs are achieved, with transmission rates of 87% and 90%, respectively. Also, we make an angle cleaved end cap to eliminate back reflection and protect the PM-PCF from dust, humidity and other contaminants. The output SC spectra are recorded by optical spectrum analyzers, in the range 350–2400 nm, with long-pass filters used to eliminate the effect of high-order diffraction during the measurement.
$\unicode[STIX]{x03BC}$
m PM-GDF is utilized as a transition between them. Developing a splicing technique for PCFs can be challenging and require special attention to retain good optical properties at the splicing point. By optimizing the parameters of the fusion splicer, such as discharge intensity and discharge position, two polarization-maintaining splicing joints between the PM-CIR, the PM-GDF and PM-PCFs are achieved, with transmission rates of 87% and 90%, respectively. Also, we make an angle cleaved end cap to eliminate back reflection and protect the PM-PCF from dust, humidity and other contaminants. The output SC spectra are recorded by optical spectrum analyzers, in the range 350–2400 nm, with long-pass filters used to eliminate the effect of high-order diffraction during the measurement.

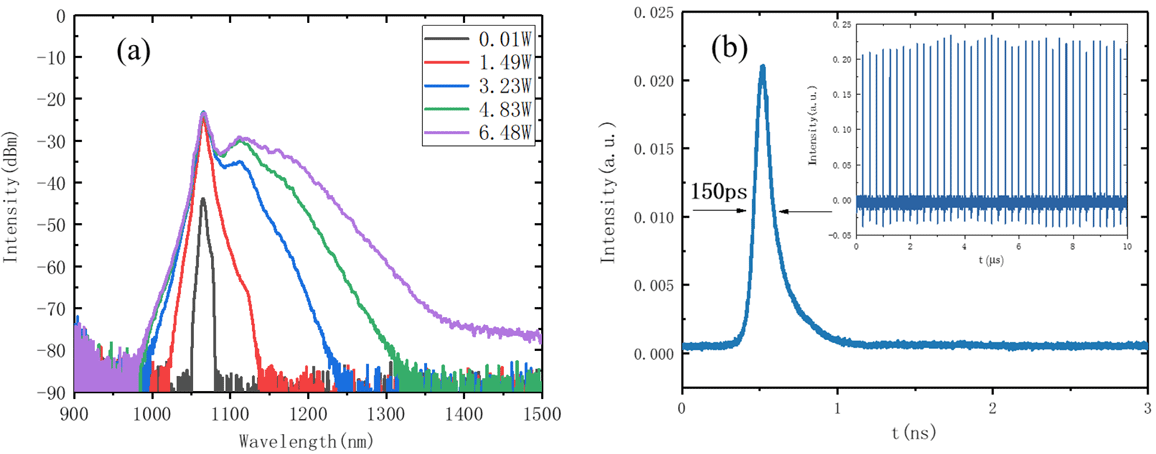
Figure 3. (a) Spectral evolution of the pump source. (b) Single pulse shape and (inset) pulse train shape of the pump source.

Figure 4. SC generated in different lengths of PM-PCF: (a) 1.6 m long PM-PCF, (b) 3 m long PM-PCF and (c) 6 m long PM-PCF. (d) SC output power versus the pump power.
3 Results and discussion
3.1 Effect of PCF length on SC generation
Numerical simulation indicates that the ZDW of the slow axis is 1070 nm, as shown in Figure 2. The center wavelength of the pump source is 1064 nm, which is located in the normal group velocity dispersion (GVD) regime of the PM-PCF and relatively near the ZDW. The spectrum of the pump source at different powers before entering the PM-PCF is shown in Figure 3(a). The maximal average pump power is 6.48 W, with a pulse duration of 150 ps at a repetition rate of 4 MHz (Figure 3(b)). The corresponding peak power and pulse energy are calculated to be 10.8 kW and 1.7 $\unicode[STIX]{x03BC}$
J, respectively.
$\unicode[STIX]{x03BC}$
J, respectively.
Three different lengths of PM-PCFs are utilized to study the influence of fiber length on SC generation, including 1.6 m, 3 m and 6 m. The splicing alignment angle is set at $0^{\circ }$
to keep the pump light propagating parallel along the slow axis. Figure 4 illustrates the SC evolution with pump power in different PM-PCF lengths. Since the pump wavelength is located in the normal GVD regime and relatively close to the ZDW of the PM-PCF at low pump power less than 1.5 W (red curve in Figure 3(a)), the phase-matching condition required by four wave mixing (FWM) can be readily satisfied[Reference Dudley, Genty and Coen30, Reference Zhang, Yang, L, Gong and Meng31]. From Figure 4(a), we can see that the spectrum is broadened almost symmetrically relative to the pump wavelength in the 1.6 m long PM-PCF when pumped at low power (the red curve). Symmetry appears in the spectrum because of the greater gain of the parametric process relative to Raman scattering. In addition, the Raman spectrum of the pump light, which covers the anomalous dispersion region of the fiber, is sufficient to stimulate the nonlinear effect related to solitons at a high power level (green and purple curves in Figure 3(a)). The following is composed mainly of Raman soliton self-frequency shift (SSFS) and modulation instability (MI). The SSFS broadens the spectrum to the longer wavelength range over 2400 nm, reaching the inherent loss region of the silica fiber. At the same time, dispersive wave generation broadens the spectrum to short wavelengths, forming the asymmetrical spectral shape, as the green and purple curves in Figure 4 show. In each length of PM-PCF, the SC extends over a bandwidth of 1900 nm (from 480 nm to over 2400 nm) at the highest pump power. In particular, the source exhibits a flat spectrum from 480 nm to 2100 nm at the
$0^{\circ }$
to keep the pump light propagating parallel along the slow axis. Figure 4 illustrates the SC evolution with pump power in different PM-PCF lengths. Since the pump wavelength is located in the normal GVD regime and relatively close to the ZDW of the PM-PCF at low pump power less than 1.5 W (red curve in Figure 3(a)), the phase-matching condition required by four wave mixing (FWM) can be readily satisfied[Reference Dudley, Genty and Coen30, Reference Zhang, Yang, L, Gong and Meng31]. From Figure 4(a), we can see that the spectrum is broadened almost symmetrically relative to the pump wavelength in the 1.6 m long PM-PCF when pumped at low power (the red curve). Symmetry appears in the spectrum because of the greater gain of the parametric process relative to Raman scattering. In addition, the Raman spectrum of the pump light, which covers the anomalous dispersion region of the fiber, is sufficient to stimulate the nonlinear effect related to solitons at a high power level (green and purple curves in Figure 3(a)). The following is composed mainly of Raman soliton self-frequency shift (SSFS) and modulation instability (MI). The SSFS broadens the spectrum to the longer wavelength range over 2400 nm, reaching the inherent loss region of the silica fiber. At the same time, dispersive wave generation broadens the spectrum to short wavelengths, forming the asymmetrical spectral shape, as the green and purple curves in Figure 4 show. In each length of PM-PCF, the SC extends over a bandwidth of 1900 nm (from 480 nm to over 2400 nm) at the highest pump power. In particular, the source exhibits a flat spectrum from 480 nm to 2100 nm at the $-$
10 dB level, except for the residual pump peak for the 3 m long PM-PCF, as shown in Figure 4(b).
$-$
10 dB level, except for the residual pump peak for the 3 m long PM-PCF, as shown in Figure 4(b).
Figure 4(d) shows the average SC output power versus the corresponding PM-PCF average input power, with slope efficiencies of 69%, 58% and 48%, respectively, for the 1.6 m, 3 m and 6 m long PM-PCFs. A maximal output power of 4.5 W is achieved from the 1.6 m long PM-PCF. Because the accumulation of nonlinear effects depends on the length of the nonlinear fiber, the transformation of pump light to the SC is insufficient in the 1.6 m long PM-PCF for this case, although it can achieve a higher power and conversion efficiency. In contrast, the 6 m long PM-PCF (Figure 4(c)) generates a broader SC than the 3 m and 1.6 m PM-PCFs when pumped under the same conditions, as shown in Figures 4(a)–4(c). Due to the inherent absorption loss of silica-based fibers, the intensity around the 2400 nm long-wavelength edge for the 6 m long PM-PCF decreases, while more dispersion waves are captured in the short-wavelength edge compared to the spectrum generated in the 3 m long PM-PCF, as can be seen from Figures 4(b) and 4(c). Taking the slope efficiency, the output power and the spectral broadening into account, the 3 m long PM-PCF is considered as the best of the three choices (1.6 m, 3 m and 6 m in the experiment) for linearly polarized SC generation in this case. Note that the optimal fiber length for SC generation is expected to be related to other conditions, such as the pump peak power and pump wavelengths. With increasing pump power, we observe no obvious temperature increase of the PM-PCF, indicating the good stability and reliability of the linearly polarized SC source and the possibility of further increasing the output power of the linearly polarized SC.
The PER of the SC ranging from 800 nm to 1500 nm, pumped at low average power, is over 20 dB, as measured by an extinction ratio meter. Also, by using filters and half-wave plates, the PERs of the SC at the high pump power level at single wavelengths, including 532 nm, 1064 nm and 1550 nm, are all measured to be greater than 20 dB. These results indicate that the generated SC preserves the polarization state of the incident pump light.
Regarding the coherence property of the SC, since the PM-PCF can maintain the single-mode property at the operating wavelengths, the spatial coherence is expected to be good. However, the temporal coherence is expected to be bad, due to the MI effect.
3.2 Effect of the polarization state of the pump on SC generation
3.2.1 Simulation of the SC generated in the slow and fast axes
Due to birefringence in the fiber core induced by the two symmetric stress rods, the group velocity dispersion properties of the two orthogonal axes are different, resulting in a different SC generation process. Through geometric modeling using the COMSOL Multiphysics software, we obtained the slow axis refractive index distribution. According to the nominal birefringence at 1064 nm, we add the birefringence to the index profile. The result can be considered approximately as the fast axis refractive index, because the magnitude of the birefringence is $10^{-4}$
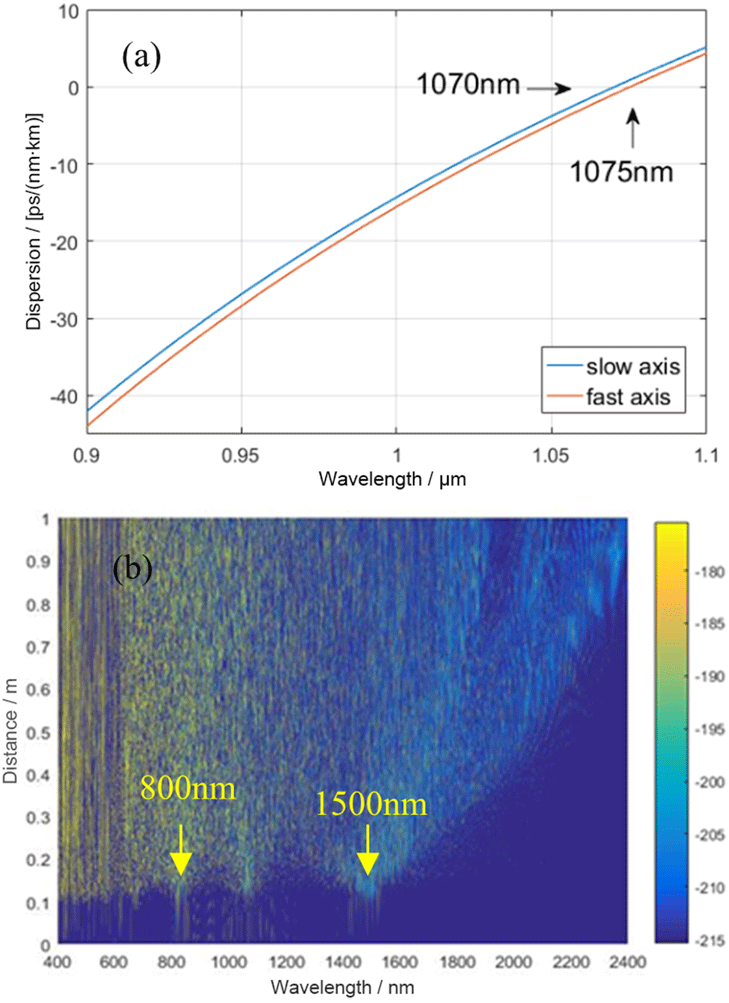
, which is relatively small compared to the inherent refractive index. Therefore, fiber parameters, including the effective refractive index and high-order dispersion terms of the two orthogonal polarization modes under different wavelengths, can be calculated. Figure 5(a) gives the simulated dispersion curves, which show that the ZDW is 1070 nm for the slow axis and 1075 nm for the fast axis, indicating a 5 nm interval between the two orthogonal axes.
$10^{-4}$
, which is relatively small compared to the inherent refractive index. Therefore, fiber parameters, including the effective refractive index and high-order dispersion terms of the two orthogonal polarization modes under different wavelengths, can be calculated. Figure 5(a) gives the simulated dispersion curves, which show that the ZDW is 1070 nm for the slow axis and 1075 nm for the fast axis, indicating a 5 nm interval between the two orthogonal axes.

Figure 5. (a) Simulated dispersion curves for the fast axis and slow axis. (b) Spectral evolution along the fiber length for the slow axis.
Then, we use the generalized Schrödinger equation (GNLSE) in the model, where propagation is assumed along only one axis of the fiber in the fundamental mode. The equation is solved by the split-step Fourier transform method. We analyze the SC spectrum pumped at 1064 nm in a piece of 1 m long PM-PCF. The peak power and pulse duration are 10.8 kW and 150 ps, consistent with the experiment. Figure 5(b) is the spectral evolution along the fiber length when pump light propagates along the slow axis. Two side bands are generated initially at 800 nm and 1500 nm, which is a typical phenomenon of FWM in the normal-dispersion region. Meanwhile, the SC generated in the slow axis, as shown in Figure 6(a), broadens to a short-wavelength edge of 580 nm, while a 600 nm short-wavelength edge is obtained in the fast axis, as shown in Figure 6(b), indicating a 20 nm blue-extended spectrum for the slow axis compared to the fast axis. The long-wavelength edge of the SC is up to 2400 nm in both principal axes. Owing to the different dispersion properties of the two axes, the long-wavelength edge near 2400 nm in the fast axis has a significantly sharper decrease compared to that of the slow axis. The simulation results indicate that a broader SC can be generated in this PM-PCF when pumped in the slow axis.
3.2.2 Experimental SC generation in the slow and fast axes and at $45^{\circ }$
to the slow axis
$45^{\circ }$
to the slow axis

According to the previous experimental results, 3 m long PM-PCF is utilized as the nonlinear medium for SC generation. An extra splicing point on the 6/125 $\unicode[STIX]{x03BC}$
m PM-GDF is made to adjust the polarization direction of the pump light into the PM-PCF. The extra splicing angle is set at
$\unicode[STIX]{x03BC}$
m PM-GDF is made to adjust the polarization direction of the pump light into the PM-PCF. The extra splicing angle is set at $0^{\circ }$
(slow axis),
$0^{\circ }$
(slow axis), $90^{\circ }$
(fast axis) and
$90^{\circ }$
(fast axis) and $45^{\circ }$
to the slow axis, respectively.
$45^{\circ }$
to the slow axis, respectively.

Figure 6. Simulated SC spectra for the (a) slow axis and (b) fast axis.

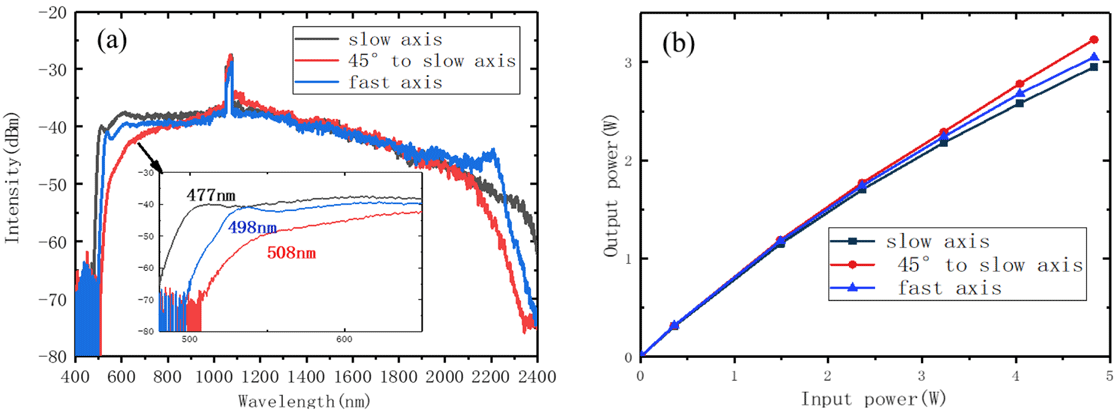
Figure 7. (a) Spectra and (b) output power versus pump power along slow axis, fast axis and $45^{\circ }$
to slow axis.
$45^{\circ }$
to slow axis.
As shown in Figure 7(a), when pumped by 10.8 kW peak power, we notice that both the short- and long-wavelength edges are obviously different, as expected in the simulation. The cutoff short-wavelength boundaries are 477 nm, 498 nm and 508 nm for the slow axis, the fast axis and at $45^{\circ }$
to the slow axis. This can be explained as follows: when pump light propagates parallel to the principal axis, only one of the orthogonal polarization modes is stimulated. Because the pump wavelength is closer to the ZDW of the slow axis, more dispersion waves are captured by redshift solitons. However, the pulse energy is split into the two principal axes when light propagates along a line at
$45^{\circ }$
to the slow axis. This can be explained as follows: when pump light propagates parallel to the principal axis, only one of the orthogonal polarization modes is stimulated. Because the pump wavelength is closer to the ZDW of the slow axis, more dispersion waves are captured by redshift solitons. However, the pulse energy is split into the two principal axes when light propagates along a line at $45^{\circ }$
to slow axis, resulting in only half of the peak power excited in each of the two polarization modes. So the spectrum is limited to 500–2300 nm. Corresponding efficiency curves are plotted in Figure 7(b). The red curve shows that light propagates at
$45^{\circ }$
to slow axis, resulting in only half of the peak power excited in each of the two polarization modes. So the spectrum is limited to 500–2300 nm. Corresponding efficiency curves are plotted in Figure 7(b). The red curve shows that light propagates at $45^{\circ }$
to the slow axis, which exhibits the maximum output power, but the corresponding spectral broadening is the narrowest. In contrast, when light is transmitted along the slow axis, although the output power is the lowest, the spectrum exhibits the maximum bandwidth.
$45^{\circ }$
to the slow axis, which exhibits the maximum output power, but the corresponding spectral broadening is the narrowest. In contrast, when light is transmitted along the slow axis, although the output power is the lowest, the spectrum exhibits the maximum bandwidth.
It should be noted that there is a clear difference in the spectral shape and exact wavelength edges between the simulation and the experiment, probably due to the simplification of the model used, such as the fiber parameters and the single pump wavelength, which is quite different from the real pump laser shown in Figure 3(a). However, the measured and simulated spectra of the SC generated in the two axes are in good agreement in terms of broadening tendency.
4 Conclusion
In conclusion, we report an all-fiber, high-power linearly polarized SC source based on PM-PCF. The PM-PCF is pumped by a picosecond pulsed laser, operating at 1064 nm with a pulse duration and repetition rate of 150 ps and 4 MHz, respectively. When the pump peak power reaches 10.8 kW, a flat SC with a broad bandwidth over 1900 nm, from 480 nm to more than 2400 nm, is achieved with an output power of 3.8 W. The PER is measured to be greater than 20 dB at selected sample wavelength points (532 nm, 1064 nm and 1550 nm) at the highest pump power level and greater than 20 dB at all wavelengths from 800 nm to 1500 nm at the low pump power level. Through comparison between 1.6 m, 3 m, and 6 m PM-PCFs, we find that 3 m long PM-PCF is an appropriate length for SC generation in our experiment. We also theoretically analyze the SC property when the pump pulses are polarized along different directions of the PM-PCF, and experimentally verify that the spectrum is broader along the slow axis in the PM-PCF.


 Open access