


Introduction
The dramatic increase in the number of craft breweries over the past decade has been coupled with the substantial economic benefits these breweries bring with them. This contribution fosters the development of beer-hospitality-tourism clusters (Smith et al. Reference Smith, Farrish, McCarroll and Huseman2017). The small, independent craft breweries are closely tied to local communities and have generated a great economic impact on the local economy (Malone and Hall Reference Malone and Hall2017; Miller et al. Reference Miller, Sirrine, McFarland, Howard and Malone2019; Sjölander-Lindqvist et al. Reference Sjölander-Lindqvist, Skoglund and Laven2019). In 2021, the number of breweries operating in the US reached a record high of 9,118, with its market share in dollar value corresponding to 26.8% of the US beer industry. Despite the ongoing pandemic challenges starting in 2020, small breweries generated $62.1 billion for the US economy and provided 400,000 jobs (Brewers Association 2022). In New York State (NYS) alone, there were 495 operating breweries in 2021 (New York Craft Beer 2021), which doubled from 207 breweries in 2013 (Insel Reference Insel2015). These 495 breweries generated 19,987 jobs and brought $3.2 billion in economic benefits to the State in 2020 (Brewers Association 2022). The economic impact was even greater before the pandemic, approaching more than $5.4 billion in 2018.
Although the brewery industry is increasingly important in revitalizing local economics (Dillivan Reference Dillivan2012; Barajas et al., Reference Barajas, G. and J.2017), they are facing many challenges (Dillivan Reference Dillivan2012). Notably, in NYS, the majority of breweries are small and rely mostly on tasting rooms to generate sales. These small, owner-operated breweries distribute locally if at all. Breweries of this scale sell products out of their tasting room in flights (3–5 oz), pints (16 oz), growlers (64 oz), and six packs to go (72 oz) to visitors. In 2018, total brewery visits were 48.6 million (New York Craft Beer 2018), 13 times more than the estimated visits in 2013 (3.66 million).
In a marketplace crowded with an array of choices for on- and off-premises alcohol consumption, customer satisfaction (CS) is essential to the success of craft breweries. Because these breweries sell most of their products in their tasting rooms, the tasting room experience greatly influences CS. Therefore, these breweries’ profits depend highly on the level of CS.
An industry-specific understanding of CS factors is needed to help craft breweries make the appropriate investments in their products, marketing, training, and facilities. Previous research has shown that increasing CS can increase customer loyalty, positive word-of-mouth communications, and sales performance in service settings such as winery tasting rooms, restaurants, and retail stores (Gómez et al. Reference Gómez, McLaughlin and Wittink2004; Gupta et al. Reference Gupta, McLaughlin and Gómez2007; Simon et al. Reference Simon, Gómez, McLaughlin and Wittink2009). In particular, a study focusing on NYS winery tasting rooms shows that higher CS leads to a higher likelihood of purchase, purchase volume, and dollar amount spending (Shapiro and Gómez Reference Shapiro and Gómez2014). However, there is no similar, contemporaneous study related to breweries in NYS, or nationally.
We note that wineries and breweries offering tastings share some similarities but exhibit important differences, which warrants research focusing on the links between CS and sales in brewery tasting rooms. For example, both wine and beer tasting rooms strive to offer visitors unique experiences and rely heavily on direct sales to generate sales. However, according to interviews with brewery managers and extension specialists, they are different in terms of visitor demographics and tasting room operations. For example, winery tasting rooms tend to offer more of a luxury, fancy tasting experience and attract more tourists than craft beer tasting rooms. On the other hand, brewery tasting rooms generally provide a more casual drinking experience and attract local visitors. Winery tasting room customers tend to be of both genders with various age ranges, whereas craft breweries tend to attract more middle-aged males than females. Further, winery tasting rooms operate in their vineyards and are therefore more dependent on their location. In contrast, breweries have no such restrictions. Considering these differences, previous findings on the relationship between CS and sales performance in winery tasting rooms may not be extended to brewery tasting rooms. Furthermore, with the rapid growth of craft breweries over the past decade, understanding the CS–sales performance links in this sector is critical. To fill this gap in the literature, this study examines various tasting room attributes to determine how these attributes affect overall CS and, ultimately, how CS affects customers purchasing decisions.
To examine these questions, a paper survey targeting brewery tasting room visitors was distributed to 21 breweries in NYS during February 2017. Participants were asked to rate their satisfaction concerning 22 separate attributes of their brewery experience and also rate their overall tasting room experience. Participants were asked to provide demographic information and indicate what they purchased and how much they spent. Using principal component analysis, five CS factors were identified: interior ambience, servers, beer tasting execution, retail experience, and location. All five CS factors were found to be associated with higher overall CS. However, among the five CS factors, interior ambience and servers were found to be the most critical factors for overall CS, followed by beer tasting execution. The results also indicate that higher overall CS resulted in a higher purchase intent and more beer purchases (by volume and by amount spent).
These findings indicate that higher CS is associated with higher sales performance in brewery tasting rooms. Furthermore, our results highlight factors that increase CS such as regular staff training, tasting room ambience, and beer tasting execution (i.e., choices of beers, volume poured, and tasting fees). Tasting room managers should therefore focus their efforts on these critical factors to increase CS. This study has implications for the rapidly growing craft brewery industry: although making good and consistent quality beer is crucial for the industry to build a collective reputation, creating a favorable tasting room experience is also critical for breweries to thrive. This study also provides insights into breweries as they are recovering from the COVID-19 pandemic disruption and embracing visitors back to the tasting rooms.
Craft breweries, customer satisfaction, and consumer preferences
Satisfied customers are the core of every business. Previous research has documented the importance of maintaining high CS in various aspects of the business (Brown and Gremler Reference Brown and Gremler1999; Hart Reference Hart2007; Thach and Olsen Reference Thach and Olsen2006). Higher CS is associated with higher revenues and stronger brand loyalty in several markets, including grocery stores, department stores, and cell phones (Westbrook Reference Westbrook1981; Gómez et al. Reference Gómez, McLaughlin and Wittink2004; Torres-Moraga et al., Reference Torres-Moraga, Vásquez-Parraga and Zamora-González2008). CS is also more closely tied to profitability rather than productivity, especially in businesses containing a service component (Anderson et al. Reference Anderson, Fornell and Rust1997). In upscale retail businesses, positive relationships with salespeople on the sales floor can spill over, creating a sense of loyalty (Reynolds and Arnold Reference Reynolds and Arnold2000). When beverage industry staff understand and exceed customer expectations, they positively influence the overall CS, potentially increasing the length of the business–customer relationship (Wu et al. Reference Wu, Huang and Chou2014).
Craft breweries operate in a highly competitive market, already saturated with national and international brands. Unhappy customers have little reason to stay loyal to a brand they are unsatisfied with. In such a crowded marketplace, it takes more effort from breweries to stand out and be remembered by consumers, but breweries that do can be rewarded. The tasting room is where a brewery has the most access to its customers, and the tasting room experience can influence their purchase decisions. It is reported that approximately 80% of brewery sales are generated from tasting rooms (Staples et al. Reference Staples, T. and R. Sirrine2021). Breweries with long-standing good reputations may relax their efforts in striving for success. Still, customers will constantly reevaluate and downgrade their brand assessment if they experience several negative interactions. Consequently, managing and increasing CS is essential for a brewery to improve sales.
One way to increase brewery sales is to focus on customers who can be persuaded to improve their opinions to the very satisfied end of the spectrum. The links between measurable attributes and the satisfaction-profit chain are asymmetrical and nonlinear (Anderson and Mittal Reference Anderson and Mittal2000). Nonlinearity means that a customer who moves from ‘somewhat unsatisfied’ to ‘neither satisfied nor dissatisfied’ may be less valuable and traverse less conceptual distance than one who goes from ‘somewhat satisfied’ to ‘very satisfied.’ Even if these phrases are separated by the same physical or numerical distances according to the scale used for measurement, they may not reflect equal amounts or changes in CS. For example, a customer who is “somewhat unsatisfied” because of unfriendly staff may leave the brewery without purchasing anything and never plan to return. At the same time, if their experience was improved slightly by improving service by staff to ‘somewhat satisfied,’ the customer may make a token purchase. If that same customer’s experience was enhanced to the point that they rated “very satisfied,” they may make a large purchase and be much more likely to return and bring guests. The rate of change in purchase decisions is heavily weighted to the more satisfied end of the spectrum. On the other hand, customers may treat the cleanliness of a brewery as binary, heavily penalizing breweries perceived as dirty but giving no benefit to clean breweries. These different hedonic values may, depending on the scale used, seem equally spaced, but indicate greater and lesser changes in purchase decisions.
Though CS impacts all direct-to-consumer purchases, research on the tasting experience of breweries’ customers is scarce, and research tying CS to purchase decisions in breweries is nonexistent. Previous research primarily focused on factors influencing consumer beer choices (Aquilani et al. Reference Aquilani, Laureti, Poponi and Secondi2015), purchase behaviors for craft beers (Carvalho et al. 2018), as well as factors influencing consumer motivation to visit the tasting rooms of craft breweries (Taylor and Dipietro Reference Taylor and DiPietro2019). Specifically, previous research found that extrinsic craft beer attributes such as brand (Orth and Lopetcharat Reference Orth and Lopetcharat2006; Massaglia et al. Reference Massaglia, Merlino, Blanc, Bargetto and Borra2021), packaging and brewery technology (Donadini and Porretta Reference Donadini and Porretta2017), color, certification and country of origin (Lerro et al. Reference Lerro, Marotta and Nazzaro2020; Massaglia et al. Reference Massaglia, Merlino, Blanc, Bargetto and Borra2021), and localness (Hart Reference Hart2018; Atallah et al. Reference Atallah, Bazzani, Ha and Nayga2021) are critical factors influencing consumer preferences and purchase decisions. In addition, earlier research showed that intrinsic characteristics such as craft beer sensory attributes and taste influence consumer preferences and purchase decisions (Gabrielyan et al. Reference Gabrielyan, McCluskey, Marsh and Ross2014; Aquilani et al. Reference Aquilani, Laureti, Poponi and Secondi2015; Da Costa Jardim Reference Da Costa Jardim, De Souza, Machado, Pinto, De Souza Ramos and Garavaglia2018; Malone and Lusk Reference Malone and Lusk2018; Lerro et al. Reference Lerro, Marotta and Nazzaro2020). However, because of the significant increase in small craft beer brands, researchers found that beer consumers may bear the burden of choice overload, which reduces consumers’ purchase likelihood (Malone and Lusk, Reference Malone and Lusk2017). Furthermore, previous research categorized craft beer consumers into different segments and studied their consumption patterns and purchase behaviors based on their beer involvement (Taylor and DiPietro Reference Taylor and DiPietro2019, Carbone and Quici Reference Carbone and Quici2020, Menezes Filho et al. Reference Menezes Filho, Silva, Castelo, Gonçalves Menezes Filho, Silva and Castelo2020) and their beer taste or sensory preferences (Donadini et al. Reference Donadini, Fumi and Newby-Clark2014, Malone and Lusk Reference Malone and Lusk2018).
Although previous research has extensively studied consumer preferences and purchase behaviors for craft beers from various aspects, few studies have focused on brewery taproom visitors to investigate how their tasting experience influences their purchase decisions. Further, little is known about the factors influencing visitors’ CS and the influence of visitors’ CS on sales performance in brewery tasting rooms. This research contributes to the literature by bridging this gap using data collected from 21 craft brewery tasting rooms in NYS.
Data collection and survey instrument
Previous research has well-documented a conceptual framework for linking CS to purchase decisions (see Gómez et al. Reference Gómez, McLaughlin and Wittink2004 for a review). This framework posits that CS is the combined impact of many measurable, discrete attributes of the customer’s experience, which can be grouped into a broader set of metafactors that encompass multiple related attributes of the customer experience. Some metagroupings of similar but distinct attributes were found to be a better predictor of overall CS. For example, satisfaction with a brewery tasting room’s music/ambient noise and bathroom cleanliness, while conceptually distinct, are generally ranked similarly by customers, making them related component parts of the broader ‘Brewery Interior Ambience’ category.
Data collection was carried out via paper questionnaires distributed at 21 participating breweries across NYS in February 2017. Breweries were recruited through the New York State Brewers Association. All interested, volunteer breweries were accepted into the study. The participating breweries exhibit various production capacities, ranging from 1,550 gallons to 1,378,925 gallons of beer per year. They are also geographically dispersed throughout NYS: eight breweries in Finger Lakes Region, three in the Capital Region, three in the Central NY region, three in New York City, three in the Niagara Frontier, two in the Adirondack Mountain Region, one in the Hudson Valley, and one in the Catskills Mountain Region.
In total, 758 completed questionnaires were returned, an average of 37 questionnaires per brewery, ranging from 13 to 53 questionnaires from each brewery. In the month previous to the survey period, paper questionnaires were delivered in person to all participating breweries, and researchers met with tasting room managers to review data collection procedures. During the active data collection period, brewery visitors were asked whether they would like to participate in a survey after they sampled (or purchased) a beer.Footnote 1 If they agreed, a paper survey was then given to them. They were led to a designated place to finish the survey whenever possible and then returned the survey before they left the brewery. No personally identifiable information on survey participants was recorded, and only beer tasters participated in the study.
The survey questionnaire consisted of five sections (see Appendix I for the survey questionnaire). Introduction section included overall CS ratings and CS ratings with particular, actionable aspects of the tasting room visit experience. Built on previous literature measuring CS and our feedback from brewery managers, we identified and organized 22 attributes of the tasting room experience into 5 broad categories to reduce potential information overload. These five categories are ‘Brewery Interior Ambience,’ ‘Quality of the Server,’ ‘Beer Tasting Execution,’ ‘Retail Sales,’ and ‘Brewery Location.’ Individual attributes included such items as the ambience of the interior space, the friendliness of the server, the cleanliness of the restrooms, and the variety of beers available to taste, to name a few (see questionnaire in Appendix I). A five-bin, hedonic scale was used to gather participants’ responses to each aspect and the overall CS, with one being ‘not satisfied at all’ and five being ‘highly satisfied.’ An additional, null bin labeled ‘Not Applicable’ was provided as an option for all questions.
Data collection and survey instrument section asked participants to indicate their reasons for visiting the brewery. Empirical models section collected participants’ demographic information: age, gender, zip code of residence, and highest education level achieved. Descriptive statistics and factor analysis results section included an open-ended question asking participants’ opinions about their visit to the brewery. Finally, Results and discussion section inquired about participants’ purchase behaviors that day, whether they made a purchase (or plan to make a purchase), what they purchased (or will purchase), how much they spent (or plan to spend), and if they intended to purchase that brand again. Their consumption frequency of craft beers was also asked in this section.
Empirical models
The empirical models consist of three parts: a principal component factor analysis to aggregate the 22 specific attributes into factors influencing overall CS; a logit regression analysis to examine the influence of these factors on overall CS; and a logit regression and two Tobit regression analyses to link overall CS with purchase decisions.
Following previous studies (O’Neill et al. Reference O’Neill, Palmer and Charters2002; Gómez et al. Reference Gómez, McLaughlin and Wittink2004; Simon et al. Reference Simon, Gómez, McLaughlin and Wittink2009; Frank and Enkawa Reference Frank and Enkawa2009; Huddleston et al. Reference Huddleston, Whipple, Mattick and Lee2009; Grewal et al. Reference Grewal, Chandrashekaran and Citrin2010; Martinez-Ruiz et al. Reference Martínez-Ruiz, Jiménez-Zarco and Izquierdo-Yusta2010; Shapiro and Gómez Reference Shapiro and Gómez2014; Hunneman et al. Reference Hunneman, Verhoef and Sloot2015), we employed principal component factor analysis to aggregate the 22 specific attributes into a small set of CS factors. Principal component factor analysis is often employed in the literature to reduce the dimension of a large data set while preserving the maximum variability of the data set and increasing the statistical power (Jolliffe and Cadima Reference Jolliffe Ian and Jorge2016). The factors with eigenvalues exceeding one were considered in ascending order until all surveyed attributes were accounted for. A set of CS factors (F 1 , F 2 …F M ) was therefore created after the factor analysis, where F i represented the score of factors 1 to M. Each of the CS factors is considered a linear combination of a subset of the specific attributes. This method consolidates the number of attributes affecting CS while retaining the most pertinent qualities and greatest variations in the data. Following Gómez et al. (Reference Gómez, McLaughlin and Wittink2004) and Gupta et al. (Reference Gupta, McLaughlin and Gómez2007), we also employ a Varimax rotation on the factors identified in the principal components procedure as it maximizes the sum of the variance of the factor loadings and the correlation among attributes within a factor (Abdi Reference Abdi2003).
After establishing the CS factors, a regression analysis was employed to identify the driving CS factors to the overall CS in the tasting room. In our sample, less than 1% of participants rated their experiences worse than ‘neither satisfied nor unsatisfied’ (overall CS rating ≤ 3), and the majority rated their experiences ‘satisfied’ (overall CS rating = 4) or ‘highly satisfied’ (overall CS rating = 5). Therefore, a binary variable labeled Dummy_Overall_CS was created to represent customers’ overall CS, which equals one if a participant’s rating is ‘highly satisfied,’ zero otherwise. Respondents’ demographics and their craft beer consumption frequency were also included in the regression analysis as control variables.
Next, several regression models were employed to examine the impact of the overall CS on consumer spending decisions while controlling for customer demographics, including age, gender, education level, residence status, and craft beer consumption frequency. The following sales performance measures were used: binary purchase decision (the variable Buy equals one if the customers bought beer for consumption on or off-premises; zero otherwise), the quantity of beer purchased in the visit (the variable Oz., number specified), and the amount of dollars spent in the visit (the variable Dollars, number specified). Brewery tasting rooms often offer various packaging options, including pints (16 oz), growlers (64 oz) and six packs to go (72 oz). Therefore, the quantity of beer purchased in our study was converted from various packaging sizes to Ounces (Oz.).
The equation examing the link between CS factors and overall CS was formulated
 $$\eqalign{ & Dummy\_Overall\_CS = {\theta _0} + {\theta _1}{F_1} + {\theta _2}{F_2} + {\theta _3}{F_3} + {\theta _4}{F_4} + \ldots + {\theta _M}{F_{M\;}} + {\rho _1}Gender \cr & \hskip +79pt + {\rho _2}Age + {\rho _3}Education + {\rho _4}NY + {\rho _5}Craft\_frequency + {\varepsilon _1} \cr}$$
The equations examining the link between overall CS and purchase decisions were
 $$\eqalign{ & Buy\ \left( {yes\,or\,not} \right) = {\beta _0} + {\beta _1}Dummy\_Overall\_CS + {\beta _2}Gender + {\beta _3}Age + {\beta _4}Education \cr & \hskip +65pt + {\beta _5}NY + {\beta _6}Craft\_frequency + {\varepsilon _2} \cr}$$
 $$\eqalign{ & Oz. = {\alpha _0} + {\alpha _1}Dummy\_Overall\_CS + {\alpha _2}Gender + {\alpha _3}Age + {\alpha _4}Education + {\alpha _5}NY \cr & \hskip +15pt+ {\alpha _6}Craft\_frequency + {\varepsilon _3} \cr}$$
 $$\eqalign{ & Dollars = {\gamma _0} + {\gamma _1}Dummy\_Overall\_CS + {\gamma _2}Gender + {\gamma _3}Age + {\gamma _4}Education + {\gamma _5}NY \cr & \hskip +35pt+ {\gamma _6}Craft\_frequency + {\varepsilon _4} \cr}$$
where Gender, Age, and Education are the gender, age, and education level of the respondent (Table 2). The variable Gender was encoded as zero for a female, one for a male. The variable Age was coded as the closest whole number to the written response. The variable Education has four levels: 1 (high school or less), 2 (some college), 3 (college degree), or 4 (graduate training/degree). The variable NY was coded as one if a respondent is a NYS resident, zero otherwise. This variable is considered as an indicator of customer localness value. Additionally, visitors’ craft beer consumption frequency, labeled as Craft_frequency, ranging from 1 (never) to 5 (more than once per week), were included as fixed effects to account for the potential impact of customer's consumption frequency on their overall CS rating and their purchase outcomes.
The logit regression was employed for equations 1 and 2. Tobit regression techniques were employed for equations 3 and 4, considering that both dependent variables (Oz. and Dollars) are censored at zero. The Tobit model estimates linear relationships between variables when the dependent variable is truncated (i.e., there is either left or right censoring in the dependent variable). Agricultural economists widely use Tobit model techniques in the literature for the censored data set, notably for dependent variables with many zeros (e.g., Bernard and Bernard Reference Bernard and Bernard2009; Kanter, Messer, and Kaiser Reference Kanter, Messer and Kaiser2009). We also employed multiple least square regression for equations 3 and 4 as a robustness check. In this paper, we reported the results from the Tobit models but presented both the least square and Tobit regression results in Appendix II. The clustered errors were employed in equations 3–4 to allow for error correlations within each brewery because there might be unobserved correlations among responses in the same brewery (Li et al. Reference Li, Gómez, Ross and Chaddard2019; Li, Predic, and Gómez Reference Li, Predic and Gómez2020).
Descriptive statistics and factor analysis results
The descriptive statistics of respondent demographics, overall sales performance, and the sales outcome employed for estimation in equations 2–4 are displayed in Table 1. The gender breakdown was 59% male and 41% female. The average age in our sample was 41.2, and approximately 90% of visitors were NYS residents. The average education level was 3.04, indicating an average college-level education. The average craft beer consumption frequency is 3.6, meaning these participants consume more than 3 to 4 times a month on average. Regarding sales performance measures, among the surveyed participants, 73% made purchases after the tasting; on average, they purchased 80.06 oz and spent $31.07 on beer on this brewery trip (excluding other spending on food).
Table 1. Summary statistics
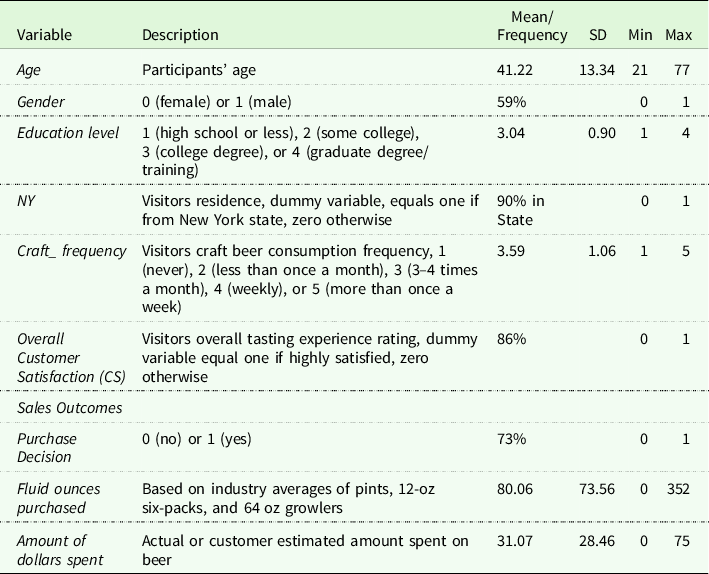
Table 2. Attributes Included in Customer Satisfaction (CS) Factors for Breweries
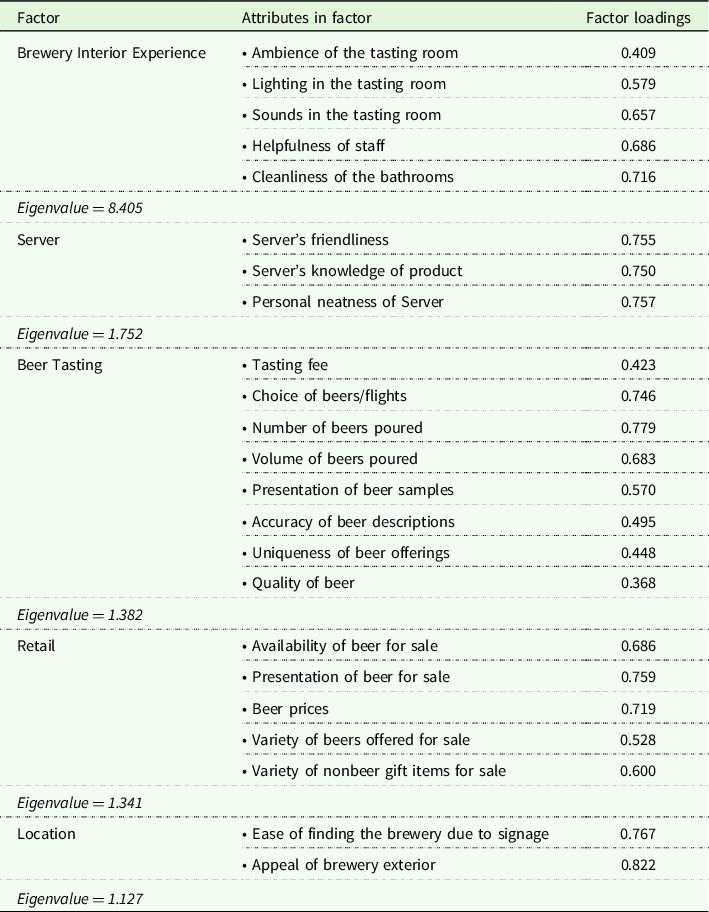
Table 2 presents the factor analysis results. Factor analysis of the survey questionnaire resulted in five aggregated CS factors; each had a greater than one Eigenvalue, from the 22 tasting room attributes. These five CS factors were consistent with broad categories designed in the survey questionnaire. The CS factors included Brewery Interior Ambience, Server, Beer Tasting Execution, Retail, and Location. Brewery Interior Ambience was associated with the tasting room’s lighting, soundscape, cleanliness of the bathroom, overall ambience, and the helpfulness of staff. Server was associated with staff member interactions while being served beer and included impressions of the server’s knowledgeability, friendliness, and personal neatness. Beer Tasting Execution included attributes related to the range of choices available and presentation method for flights, the wait time for a place at the tasting bar, the fee related to tasting, the number of samples offered, and the overall quality of the beer tasted. Retail included attributes associated with shopping and making purchases at the brewery including the availability, price, and presentation of beers for sale as well as the availability of nonbeer items (bottle openers, t-shirts, souvenirs, etc.); The last CS factor location had two attributes, the helpfulness of directional signs to the brewery and the appeal of the building exterior. The CS factor scores are the average scores of each attribute that have been aggregated to form that CS factor. For example, the CS factor location was generated by taking the average ratings of the two attributes: helpfulness of directional signs to the brewery and the appeal of the building exterior.
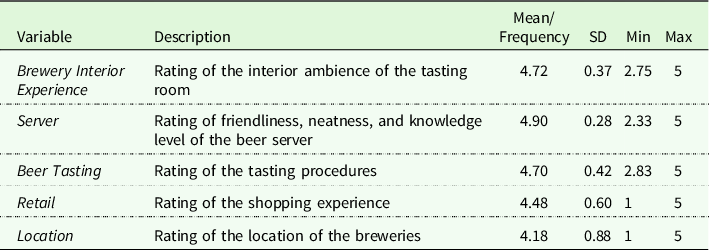
Table 3 presents descriptive statistics of the five CS factors identified in the principal component factor analysis. In our sample, the Server factor was the highest scoring factor at 4.90, meaning, on average, visitors were very satisfied with the server. Brewery interior experience, Beer Tasting Execution, and retail factors had average scores of 4.72, 4.70, and 4.48, respectively. The average score for the location factor was the lowest at 4.18, suggesting that visitors are not as satisfied with the breweries location as they were with other CS factors. However, these scores are at the high end of the range, indicating that customer experiences were generally satisfactory.
Table 3. Descriptive statistics for beer tasting room customer satisfaction factors
Results and discussion
Impacts of five CS factors on overall CS
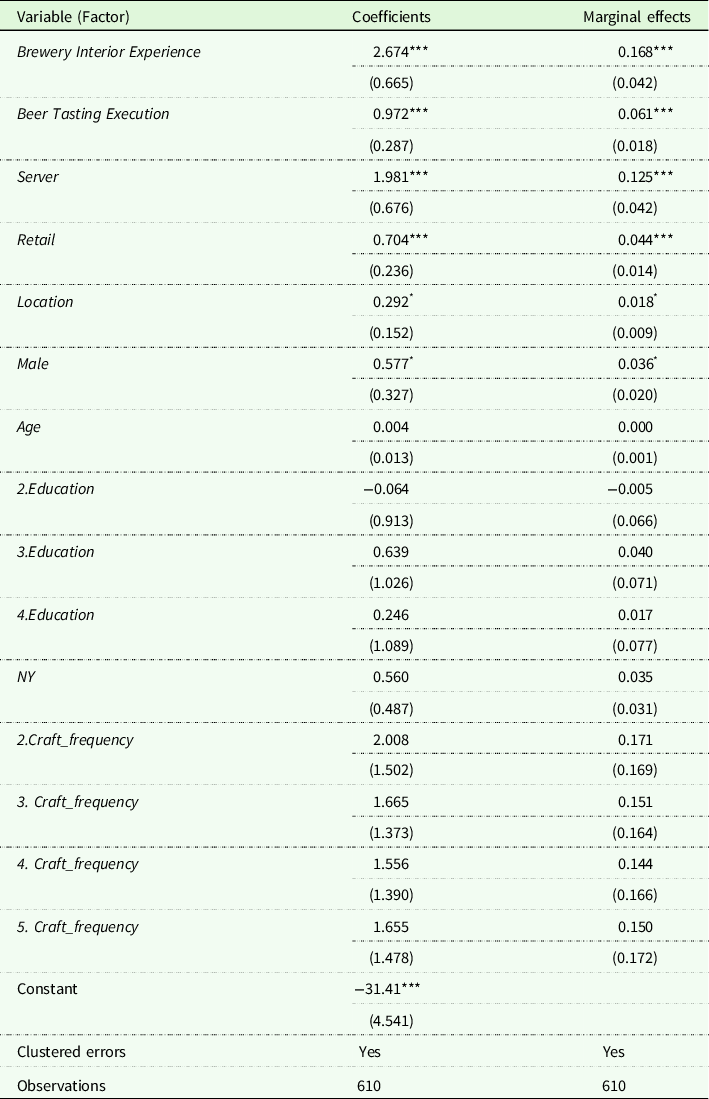
The results from equation 1 in Table 4 present how CS factors influence overall CS. The pseudo-R-squared for this regression is 0.412, indicating that about 41% of the variation in overall CS can be explained using the five CS factors developed in this study. This result is generally in line with other studies in food and beverage service (Shapiro and Gómez Reference Shapiro and Gómez2014; Gupta, McLaughlin, and Gómez Reference Gupta, McLaughlin and Gómez2007).
Table 4. Regression analysis of overall customer satisfaction on factors
*, **, ***denote statistical significance at the (p < 0.10), (p < 0.05), and (p < 0.0.1), respectively. Please note that although we collected 758 survey questionnaires, 610 observations were utilized in the regression analysis due to missing values in variables.
The coefficients of all the five CS factors are statistically significant and positive, indicating that all these factors are important factors influencing visitors’ overall CS. The average marginal effectsFootnote 2 (Column 3 of Table 4) show that each one-point increase in the Brewery Interior Ambiences, Server factor scores significantly increases the probability of a visitor’s overall CS rating from satisfied to highly satisfied by 17 and 13 percentage points, respectively, holding everything else constant. Similarly, each one-unit increase in the Beer Tasting Execution factor increases the probability of a visitor’s overall CS rating from satisfied to highly satisfied by 6 percentage points. The results suggest that the inverse is also true; if scores in Brewery Interior Experience, Server, or Beer Tasting Execution dropped by a point, the overall scores would also drop.
Interestingly, it appears tasting protocols influence visitors’ tasting experiences in brewery tasting rooms as the factor Beer Tasting Execution has a positive influence on overall CS. However, this impact is not as significant as the more experiential and relational attributes involved in Brewery Interior Experience and Service. The craft brewery industry in NYS is still young and not yet mature, and the tasting protocols have high variations across breweries.
Although the coefficients of other CS factors, Retail, and Location, are positive and significant, their marginal effects (4% and 2%, respectively) are small. Generally, these results are in agreement with previous research on winery tasting rooms, which showed that the atmosphere of the tasting room and the interactions of the tasting room staff were the most critical factors influencing customer’s overall reported CS (Shapiro and Gómez Reference Shapiro and Gómez2014; Kraftchick et al. Reference Kraftchick, Byrd, Canziani and Gladwell2014). Furthermore, the small marginal effect of the Retail and Location factors suggests that visitors are not particularly price-sensitive to high-end service and are not particularly meticulous about the locations, consistent with a previous study on winery tasting rooms (Carlsen and Boksberger Reference Carlsen and Boksberger2015). The results also indicate that males are more likely to be highly satisfied with the tasting experience relative to females.
Impacts of overall CS on sales outcomes
The regression results for equations 2–4 (Table 5) show that higher reported overall CS was associated with a greater likelihood to purchase, more fluid ounces purchased, and more dollars spent on that trip. These results indicate that, holding all else constant, visitors who were overall highly satisfied on average were 8.1 percentage points more likely to make a purchase after tasting, spent $5.31 more, and ended up buying 30.7 Oz. more beer on this trip.
Table 5. Impact of brewery customer satisfaction on alternative measures of sales performance measures in breweries
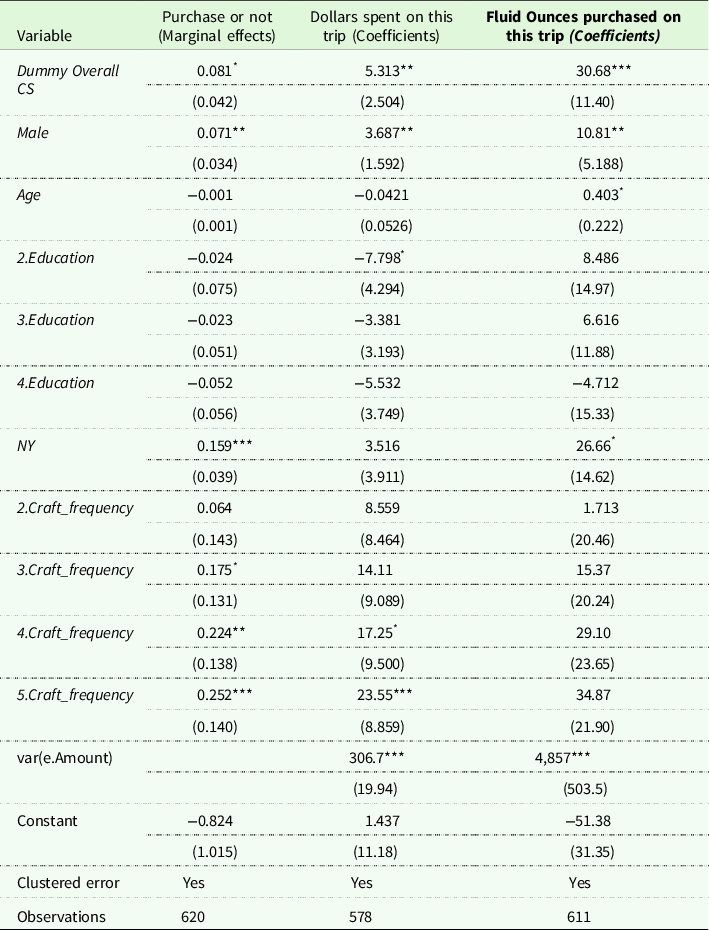
*, **, ***denote statistical significance at the (p < 0.10), (p < 0.05), and (p < 0.0.1), respectively. Please note that the differences in sample size result from the missing values in variables employed in the regression.
Regarding the demographic variables, the coefficient for gender is significant and positive for the purchase intent, the dollar amount, and the ounce purchased (all at a 5% significance level), indicating that males tend to spend more money and buy more beers relative to females, which makes sense because males tend to consume more craft beer than females (Gallup Website, 2013). The coefficients for age and NY variables are significant and positive for ounce purchased (both at 10% significance level), suggesting that older visitors from NYS are associated with more fluid ounces purchased on that trip. In the meantime, the coefficient of NY variable is significant and positive for purchase intent (at a 1% significance level), indicating that visitors from NYS are more likely to make a purchase relative to visitors from other states after tasting. However, both variables have no significant impact on dollar amount spent. The results also show that higher craft beer consumption frequency is associated with higher purchase intention and increased spending. This suggests that visitors who consume craft beer more frequently are more likely to make a purchase after tasting and to spend more money on a craft beer brewery visit, relative to visitors who consume craft beer less often. Results also suggest that education level has no significant impact on brewery visitors’ purchase decisions.
The mean impacts of CS on sales data to replicate the scenario of converting a visitor from ‘Not Highly Satisfied’ (Dummy_Overall _CS = 0) to ‘Highly Satisfied’ (Dummy_Overall _CS = 1) are discussed here. The results indicate a considerable impact. When the overall satisfaction rating moves from ‘Not Highly Satisfied’ to ‘Highly Satisfied,’ a customer’s probability of purchase increases from 73% to 81% (an increase of 8.1-percentage points), he/she is more likely to purchase 104.24 ounces of beer instead of 73.56 (an increase of 30.68 ounces) and spend $33.77 instead of $28.46 (an increase of $5.31). Breweries should note that this projection works in both directions, and customers whose satisfaction scores decrease are just less likely to make the purchase and make a smaller purchase in volumes and dollars.
Conclusion
While previous research has documented the specific attributes that drive overall CS in restaurants, winery tasting rooms, and retail stores, as well as has shown how CS impacts overall sales performance, no such research has been performed in the craft brewery industry. To fill this gap, this study collected survey data from brewery tasting rooms in NYS to examine the critical attributes for overall CS and the link between the overall CS and tasting room sales performance. This study shows that identifiable factors, like interior ambiance, staff friendliness and knowledgeability, and the Beer Tasting Execution are significant drivers of overall CS in NYS brewery tasting rooms. This study also indicates that the overall CS positively influences brewery visitors’ purchase decisions, including purchase likelihood, the amount of dollars spent, and total fluid ounces of beer purchased at a particular visit. The results also show that older male visitors residing in NYS tend to purchase more in a given visit in comparison to females and younger individuals. Furthermore, visitors who are regular craft beer consumers tend to purchase more in a given tasting room visit.
These findings are helpful to brewery tasting room managers, especially those that rely mostly on tasting room sales to make profits. Breweries should realize that improving overall CS could significantly increase tasting room sales. To improve overall CS and ultimately increase sales, managers should strategically allocate resources to the attributes/factors that matter the most to visitors. Making good quality beers are crucial; however, maintaining a clean bathroom, having nice lighting and pleasant ambience, and having a nice presentation of the beer flight paddle can contribute to improving CS and sales. Regularly scheduled training for tasting room staff is also important to improve visitors’ experience. Tasting room staff directly interact with visitors; their demeanor and knowledge level could have a substantial impact on customers who visit tasting rooms. A program that tightly controls CS could be a worthwhile investment for brewery tasting room managers. Such a program might include eliciting customer feedback, active complaint management, and the ability to meet and exceed new needs and desires as they arise. The study also casts light on craft brewery’s target consumer segment: older, local males with a habit of drinking craft beers. Our findings may be generalized to regions beyond NYS and provide valuable insights into the rapidly growing craft brewery industry nationwide, as many of these businesses depend on tasting rooms for their success. The breweries studied here represent a variety of sizes, ownership, and locations. This, together with the fact that breweries are less tied to terroirs or regions in comparison to wineries, suggests that the findings are valuable for craft brewers nationwide. Moreover, with more craft breweries embracing customers back to their tasting rooms and recovering from the COVID-19 pandemic disruption, the CS identified here is critical for craft breweries’ success.
Although our study provides important findings for the industry, it has several limitations suggesting the need for further research. One limitation is the possible selection bias in our survey. That is, visitors who participated in the survey may have unobserved characteristics that are different relative to the visitors who did not participate. Future studies could collect observational data to examine the link between CS and sales performance. In addition, although our study employed visitors’ residence as a proxy for localness value, future research could explicitly measure visitors’ localness value toward beer and the inputs used in brewing to study its impact on visitors’ purchase decisions. Another limitation is that we do not consider that breweries can differ substantially in terms of beer style specializations or market scope. Future research can focus on how craft breweries differentiate themselves from other craft breweries and from national and international breweries. This study can also be extended to address several unexplored areas concerning CS–performance links in breweries, such as the sensitivity of satisfaction factors to offers for specific entertainment or educational options (concerts, festivals, tours) and the impact of CS on purchases for consumption on-site and off-site. Finally, this study can be replicated at different times of the year and at different locations to capture a fuller picture of the CS–sale performance links.
Supplementary material
To view supplementary material for this article, please visit https://doi.org/10.1017/age.2022.28
Data availability statement
Data are available upon request.
Funding statement
This work was funded by Empire State Development Corporation with the Award number AB101.
Conflicts of interest
None.
Transparency and openness promotion statement
Data will be available upon request.


 Open access