


1. Introduction
In recent years, unmanned aerial vehicles (UAVs) have been used in various fields, such as research, industry and recreation (Vergouw et al. Reference Vergouw, Nagel, Bondt and Custers2016; Hassanalian & Abdelkefi Reference Hassanalian and Abdelkefi2017; Ahirwar et al. Reference Ahirwar, Swarnkar, Bhukya and Namwade2019; Darvishpoor et al. Reference Darvishpoor, Roshanian, Raissi and Hassanalian2020; Shahmoradi et al. Reference Shahmoradi, Talebi, Roghanchi and Hassanalian2020). UAV platforms are classified primarily into rotary-wing, fixed-wing and flapping-wing UAVs, depending on their propulsion systems (Ucgun, Yuzgec & Bayilmis Reference Ucgun, Yuzgec and Bayilmis2021). Rotary-wing UAVs, which are based primarily on a multi-rotor propulsion system, can hover, take off and land vertically in a narrow space compared to other UAV platforms. As such, multi-rotor UAVs have been used for rescue (Waharte & Trigoni Reference Waharte and Trigoni2010), surveillance (Jung, Jo & Kim Reference Jung, Jo and Kim2019; Mishra et al. Reference Mishra, Garg, Narang and Mishra2020) and chemical detection missions (Burgués & Marco Reference Burgués and Marco2020), which require great maneuverability. However, the endurance of multi-rotor UAVs is lower than that of fixed-wing UAVs because of their relatively low flight efficiency. To overcome this limitation, aerodynamic designs have been developed for enhancing the flight performance of multi-rotor propulsion systems (Ning & Hu Reference Ning and Hu2017; Dol Reference Dol2020; Ye et al. Reference Ye, Wang, Song, Zhu, Wu and Tang2021). However, aerodynamic designs have been limited primarily to isolated rotors; hence they cannot consider the effect of the interaction caused between rotors in multi-rotor UAVs. Multi-rotor UAVs, wherein the rotors are close to each other, induce strong interaction between the rotor wakes (referred to hereafter as rotor–rotor interaction); therefore, these systems have more complex wake structures than an isolated rotor system (Hwang, Jung & Kwon Reference Hwang, Jung and Kwon2015; Yoon, Lee & Pulliam Reference Yoon, Lee and Pulliam2016; Zhou et al. Reference Zhou, Ning, Li and Hu2017; Lee & Lee Reference Lee and Lee2020; Veismann & Gharib Reference Veismann and Gharib2020; Lee et al. Reference Lee, Chae, Woo, Jang and Kim2021). A comprehensive understanding of the rotor–rotor interaction for multi-rotor UAVs is essential to realize optimized designs that exceed the aerodynamic performance limits of isolated rotors.
The effects of rotor–rotor interaction on the wake structures and aerodynamic performances of multi-rotor configurations have been investigated in numerous studies using experimental and numerical methods. Yoon et al. (Reference Yoon, Lee and Pulliam2016) simulated numerically the flow fields around a multi-rotor system for various rotor separation distances. They reported that the rotor–rotor interaction injects vortices upstream of the rotor in a multi-rotor configuration with a narrow distance between rotors. Furthermore, Zhou et al. (Reference Zhou, Ning, Li and Hu2017) investigated experimentally variations in the wake structure below rotors depending on the distance between rotors for a twin-rotor configuration, and confirmed the occurrence of a flow separation region in the rotor wake between rotors owing to interactional effects. Lee & Lee (Reference Lee and Lee2020) verified that the rotor–rotor interaction increases the induced velocity of the rotor wake in an adjacent region of each rotor, thereby reducing the effective angle of attack of the rotor blade. Lee et al. (Reference Lee, Chae, Woo, Jang and Kim2021) suggested a modelling equation to predict the tip vortex trajectory considering the effect of rotor–rotor interaction during hovering for multi-rotor configurations. Wake characteristics that are complicated by the rotor–rotor interaction significantly affect the aerodynamic performances of multi-rotor systems, including the mean thrust generation (Intaratep et al. Reference Intaratep, Alexander, Devenport, Grace and Dropkin2016; Yoon et al. Reference Yoon, Lee and Pulliam2016; Zhou et al. Reference Zhou, Ning, Li and Hu2017; Lee & Lee Reference Lee and Lee2020; Veismann & Gharib Reference Veismann and Gharib2020; Lee et al. Reference Lee, Chae, Woo, Jang and Kim2021), force fluctuations (Zhou et al. Reference Zhou, Ning, Li and Hu2017; Lee & Lee Reference Lee and Lee2020) and noise (Intaratep et al. Reference Intaratep, Alexander, Devenport, Grace and Dropkin2016; Zhou et al. Reference Zhou, Ning, Li and Hu2017; Lee & Lee Reference Lee and Lee2020; Nargi et al. Reference Nargi, De Gregorio, Candeloro, Ceglia and Pagliaroli2021).
As described above, despite several efforts to understand the effects of rotor–rotor interaction, earlier studies have focused primarily on the hovering condition of UAVs. In addition to hovering flight, multi-rotor UAVs utilize other diverse types of flight during missions, such as forward, ascending and descending flight modes. In particular, UAVs are likely to encounter a dangerous condition during descending flight referred to as the vortex ring state (VRS). Under the VRS, tip vortices are accumulated near the rotor disk and interact with the rotor blades, and consequently result in elevated levels of fuselage vibration and significant power consumption (Washizu et al. Reference Washizu, Azuma, Koo and Oka1966; Leishman, Bhagwat & Ananthan Reference Leishman, Bhagwat and Ananthan2004; Stack Reference Stack2004; Green, Gillies & Brown Reference Green, Gillies and Brown2005; Brand et al. Reference Brand, Dreier, Kisor and Wood2011; Veismann, Yos & Gharib Reference Veismann, Yos and Gharib2022). This VRS effect has been studied in depth for helicopters; however, corresponding research for multi-rotor UAVs remains insufficient. Considering the differences in rotor size and the presence of rotor–rotor interaction, the aerodynamic effects of the VRS on multi-rotor UAVs may differ from those of helicopters. Throneberry et al. (Reference Throneberry, Hocut, Shu and Abdelkefi2019) investigated qualitatively the wake structure of multi-rotor UAVs under descending flight through a smoke visualization experiment. They verified that significant wake interactions occur during descending flight and lead to significant flow instability below the rotor. Abrego & Long (Reference Abrego and Long2002) measured the thrust force generated in the twin-rotor configuration under descent conditions at various descent angles, and compared with that of an isolated rotor. However, these studies were conducted using a constant distance between the rotor tips (3.8 $R$ for Throneberry et al. (Reference Throneberry, Hocut, Shu and Abdelkefi2019), and 0.55 $R$ for Abrego & Long (Reference Abrego and Long2002), where $R$ is the rotor radius); this implies that the strength of the rotor–rotor interaction was limited. Thus a comprehensive understanding of the effect of rotor–rotor interaction on the flow characteristics of UAVs over wide ranges of descending velocities and distances between rotors has not been realized thus far. Further insights into the effect of rotor–rotor interaction in the VRS can guide the aerodynamic design of multi-rotor UAVs to enhance their flight performances in descending flights. Furthermore, these findings can be utilized to predict flight trajectories of multi-rotor UAVs when they fly with a wide range of descent speeds. Current commercial multi-rotor UAVs have limited vertical descending speeds usually within $2\,{\rm m}\,{\rm s}^{-1}$ to avoid VRS conditions (Chenglong et al. Reference Chenglong, Zhou, Jiafang and Xiang2015). To overcome this limited descending speed, optimized trajectories of multi-rotor UAVs have been suggested (Chenglong et al. Reference Chenglong, Zhou, Jiafang and Xiang2015; Talaeizadeh et al. Reference Talaeizadeh, Antunes, Pishkenari and Alasty2020; Talaeizadeh, Pishkenari & Alasty Reference Talaeizadeh, Pishkenari and Alasty2021). However, in some studies, the flight trajectories were obtained by applying aerodynamic knowledge of VRS effects for isolated rotors (Talaeizadeh et al. Reference Talaeizadeh, Antunes, Pishkenari and Alasty2020, Reference Talaeizadeh, Pishkenari and Alasty2021). An understanding of rotor–rotor interaction in VRS can help to improve the potential of predicting novel flight trajectories that can overcome existing descent speed limits.
In this study, we investigated the effects of rotor–rotor interaction on the twin-rotor wake flow characteristics in axial descent flight conditions. The effects of rotor–rotor interaction on the rotor wake structure were analysed based on experimental methods under various descent speeds and with various distances between rotors. First, to understand the effect of rotor–rotor interaction on the wake structure depending on the descent speed and separation distance between rotors, the flow fields around the rotors for isolated and twin-rotor configurations were measured using digital particle image velocimetry (DPIV) in a wind tunnel. Earlier studies on descending flight in multi-rotor configurations were conducted with thrust measurements (Abrego & Long Reference Abrego and Long2002) or qualitative flow visualization through smoke visualization experiments (Throneberry et al. Reference Throneberry, Hocut, Shu and Abdelkefi2019). To the best of our knowledge, this study is novel in that it is the first work to measure the flow fields of twin rotors quantitatively through DPIV over a wide range of descent speeds and distances between rotors. Second, to investigate the effect of rotor–rotor interaction on the flow instability of the rotor wake, the probability of vortex ring formation was measured via correlation analysis by comparing the correlation coefficients with representative flow fields of tubular and VRS forms. Third, to understand the effect of the rotor–rotor interaction on the thrust generation, the thrust force of the rotor was measured directly by a loadcell in a wind tunnel.
The remainder of this paper is organized as follows. Section 2 describes the rotor model used in this study, the wind tunnel experimental set-up for the rotor model in axial descent, and experimental set-up for thrust and wake velocity measurements. Section 3 presents the results of the rotor wake velocity for isolated and twin-rotor configurations, and discusses the effects of rotor–rotor interaction on the wake characteristics and thrust generation of twin rotors at various descent speeds. Finally, § 4 provides the conclusions and a summary of this study.
2. Experimental set-up
2.1. The rotor model
The rotor model used in this study had two untwisted rectangular blades, as shown in figure 1(a). The radius ( $R$) and constant chord length ( $c$) of the rotor blade were 40 and 16 mm, respectively. The rotor blade had a cross-section of an NACA0020 aerofoil with constant collective pitch angle $20^\circ$ to ensure simplicity in shape. Moreover, rotor blades composed of an ABS-like resin were fabricated using a stereolithography apparatus three-dimensional printer.

Figure 1. (a) Details of the rotor model and shape parameters for the rotor model. (b) A schematic diagram of the experimental set-up for controlling the rotational speed of the rotor model.
Figure 1(b) shows a schematic of the experimental system used to control the rotational speed of the rotor. The rotor was driven by a brushless DC (BLDC) electric motor (EMAX RS1306), to which electric power was supplied from a power supply (TOYOTECH DP30-03TP). The rotational speed of the motor was measured using a tachometer (MONARCH PLT200). The measured rotational speed data were sent to a PC via an A/D converter at rate 1000 Hz. The rotational speed and tangential tip velocity ( $V_{t} = R\varOmega$, where $\varOmega$ is the rotational speed in rad s $^{-1}$) of the rotor remained constant at 10 600 rpm and $44.38\,{\rm m}\,{\rm s}^{-1}$, respectively. The corresponding Reynolds number ( ${\textit {Re}} = V_{t}c/\upsilon$, where $\upsilon$ is the kinematic viscosity of air) based on the chord length and tangential tip velocity was approximately 47 000, which is within the Reynolds number range in which small-scale UAVs typically operate (Deters, Ananda Krishnan & Selig Reference Deters, Ananda Krishnan and Selig2014; Kutty & Rajendran Reference Kutty and Rajendran2017). An electronic speed controller (ESC) and Arduino UNO were used to control the rotational speed via pulse width modulation (PWM). The PWM signal was adjusted through a closed-loop feedback system to maintain a constant rotational speed of the motor within ${\pm }0.3\,\%$ of the desired value. This closed-loop feedback system was used in our earlier study to maintain a constant rotational speed of the brushless DC motor (Lee et al. Reference Lee, Chae, Woo, Jang and Kim2021). Photographs of the tip of the rotor blade were captured during rotation using a high-speed camera; it was confirmed that the vibrations of the rotor blade resulting from the material characteristics were within one pixel of camera resolution (0.0032 $R$). Therefore, rotor vibrations were considered to have no effect on the wake generation of the rotor.
2.2. Wind tunnel experimental systems
Figure 2 shows schematics of the wind tunnel experimental systems for implementing axial descent conditions. The closed-circuit wind tunnel used in this study had a test section with width, height and length 0.5, 0.5 and 1.2 m, respectively. The maximum freestream velocity of the wind tunnel was approximately  $44\,{\rm m}\,{\rm s}^{-1}$, and the turbulent intensity was less than 0.8 %. Furthermore, the rotor configurations were classified into isolated and twin-rotor configurations depending on the number of rotors, as shown in figures 2(a) and 2(b), respectively. For both rotor configurations, rotor disk planes were arranged perpendicular to the freestream, and the rotors were set to induce a wake velocity in the direction opposite to the freestream. Consequently, the freestream velocity of the wind tunnel represents the axial descent speed ( $V_d$). To adjust the distance between rotor tips ( $s$), Rotor 2 was allowed to move in the $x$-axis direction using a linear stage. The distance between rotor tips varied in the range 0.25 $R$–2.5 $R$. It should be noted that in both rotor configurations, the rotational axes of the rotors were located at distance 4.0 $R$ or more from the test section wall in the $x$-axis direction. According to the results of preliminary experiments, the wall–flow interference induced from the test section wall, located at a distance greater than 3.0 $R$ away from the rotor, did not significantly affect the thrust generation of the rotor (differences of less than 0.5 % were observed, with the rotor located at the centre of the test section).

Figure 2. Top views of the wind tunnel experimental set-up for (a) isolated rotor and (b) twin-rotor configurations. (c) A side view of the experimental set-up of the wind tunnel system for thrust measurements of the isolated rotor.
As shown in figure 2(c), the motor was mounted at the end of a thin stainless shaft of length 200 mm (5 $R$) and diameter 12 mm (Supporter 1 in figure 2c). Supporter 1, which was fastened to Supporter 2, was located at the centre of the wind tunnel in the $z$-axis direction. The cross-section of Supporter 2 was elliptical, with ratio $3.36:1$ to alleviate flow interference effects induced by the supporter. A loadcell (UNIPULSE USM-5N) was equipped just below the motor to measure the thrust force directly, as shown in figure 2(c). The calibration curve of the loadcell was linear in the range 0–5 N, and data were collected at rate 1000 Hz. For each case, thrust measurement was performed for 120 s and repeated three times. The measured data were transmitted to a PC through an amplifier and A/D converter. The thrust force was measured for the isolated rotor to evaluate the induced velocity at the rotor disk plane in the hovering condition. In this study, the thrust coefficient for the isolated rotor in the hovering condition ( $C_{T,h} = T_h/\rho AV_{t}^2$, where $T_h$ is the thrust force of the isolated rotor during hovering, $\rho$ is the density of air, and $A$ is the rotor disk area) was 0.0215. Based on the standard momentum theory (Leishman Reference Leishman2000), the induced velocity in the hovering condition ( $V_h = (C_{T,h}/2)^{1/2}V_{t}$) was evaluated as $4.6\,{\rm m}\,{\rm s}^{-1}$.
2.3. Wake velocity measurements
Figure 3(a) shows a schematic of the experimental set-up for measuring the wake velocity around the rotor using DPIV. The wake velocity measurement system comprised a charge-coupled device (CCD) camera (Viewworks VH-4MC) with resolution  $2048 \times 2048$ pixels, and sensor size $4/3$ inches, a Nikon 60 mm lens of f/2.8, a timing hub, and an Nd:YAG laser with pulse energy 180 mJ. Liquid droplets $1\,\mathrm {\mu }$m in diameter produced by a fog generator (SAFEX Fog Generator 2010) were used as tracking particles. The laser optic system provided a laser sheet with thickness 3 mm, which was located at the $x$–
$x$– $y$ plane passing through the central axis of the rotor ( $z/R = 0$), as shown in figure 3(b). This experimental system for flow velocity measurements was designed based on the methods used in our earlier studies (Chae et al. Reference Chae, Lee, Kim and Lee2019; Lee et al. Reference Lee, Chae, Woo, Jang and Kim2021; Oh et al. Reference Oh, Lee, Son, Kim and Ki2022). A mirror was installed on the wind tunnel wall and reflected the laser sheet to eliminate shadowed regions around the rotor. The rotor surface was painted matte black to prevent the reflection of the laser sheet.

Figure 3. (a) A schematic diagram of the experimental set-up for wake velocity measurement of the rotor by using DPIV. (b,c) The coordinate system used in this study, and the field of view for the wake velocity measurement in (b) the  $x$–
$x$– $z$ plane, and (c) the $x$–
$x$– $y$ plane.
For the isolated rotor configuration, the rotor wake velocities were measured at descent speeds 4–7  ${\rm m}\,{\rm s}^{-1}$ in intervals of $1\,{\rm m}\,{\rm s}^{-1}$, including $0\,{\rm m}\,{\rm s}^{-1}$. For the twin-rotor configuration, the wake velocities were measured at descent speeds 4, 5 and $7\,{\rm m}\,{\rm s}^{-1}$ by considering the flow states around the rotor, which will be described later, in § 3.1. Figure 3(c) shows the field of view of the DPIV experiments in the $x$–
$x$– $y$ plane, wherein the $x$- and $y$-coordinates originate from the rotational axis and tip path plane of the rotor, respectively. The field of view covers flow fields with $-2.375 < x/R < 2.375$ and $-3.0 < y/R < 1.75$. The measured flow field was divided into inner (positive $x/R$) and outer (negative $x/R$) regions, respectively, as shown in figure 3(c). Areas in the field of view that could not be analysed due to shadows were masked in the pre-processing step. In this field of view, interrogation windows of $32 \times 32$ pixels were analysed based on cross-correlation analysis and overlapped up to 75 %. The spatial resolution of the flow field was approximately 0.019 $R$. For every case, 2000 image pairs were captured at 9 Hz. To obtain the fully converged flow statistics (e.g. time-averaged flow velocity and r.m.s. velocity fluctuations), the oscillation amplitudes of the statistics against the number of image pairs were plotted at an arbitrary point, including the point of maximum r.m.s. velocity fluctuations. For 2000 image pairs, it was confirmed that the oscillation amplitudes of the statistics were almost zero. The image acquisition rate differed from the harmonic probabilities of the rotating rotor to ensure that the time-averaged flow fields were not biased towards the specific phase of the rotor blade.
3. Results and discussions
3.1. Isolated rotor wake characteristics
For the isolated rotor configuration, the flow fields around the rotor were measured at descent rates ( $V_d/V_h$) ranging from 0 to 1.52. Figure 4(a) presents the contour of the normalized time-averaged axial velocity ( $\bar {v}/V_h$) superimposed with streamlines in hover ( $V_d/V_h = 0$). The rotor wake generates two jet-like flows in the immediate vicinity of the rotor (see figure 4b). It should be noted that the axial induced velocity averaged along $x/R$ in the vicinity of the rotor blade ( $y/R = -0.15$) is $4.5\,{\rm m}\,{\rm s}^{-1}$. This is in good agreement with the induced velocity calculated by the standard momentum theory with an error of less than 3 %. The rotor wake gradually contracts radially near the rotor as it proceeds downwards, which is confirmed by the contraction of the tip vortex trajectory defined by the location of maximum time-averaged vorticity (see the inset of figure 4a). As the wake proceeds further downstream, it slightly spreads outward from the rotational axis, which can be confirmed by the radial spreading of the downwash flow shown in figure 4(a).

Figure 4. (a) Contours of the normalized time-averaged axial velocity superimposed with streamlines for the isolated rotor at  $V_d/V_h = 0$ (hover). (b) The profile of the normalized axial velocity along $x/R$ measured at $y/R = -0.15$. The inset of (a) shows the contour of normalized time-averaged vorticity and streamlines in the red square. The purple open symbols in the inset denote the trajectory of wake boundary, defined by tracing the location of peak normalized vorticity.
Figures 5(a–d) show the contour variations of the normalized time-averaged axial velocity and streamlines with  $V_d/V_h$. Figure 5(e) shows the profiles of normalized mean radial velocity ( $\bar {u}/V_h$) measured at $x/R = 1.25$ (indicated by the green lines in figures 5(a–d). Despite the effect of the axial descent condition, the rotor wake at $V_d/V_h = 0.87$ proceeds downwards and is roughly contained in a tubular form similar to that observed in hover (see figures 4a and 5a). It needs to be noted that the rotor wake spreads outwards in the radial direction by the influence of the descent speed, forming left and right foci at $y/R = -2.3$ (approximately). Normalized radial velocity profiles at $x/R = 1.25$ show that the sidewashes propagating outwards from the rotor are rarely formed except for wake spreading, which leads to small intensities in areas located far from the rotor, where $y/R < -1.5$ (approximately), as shown in figure 5(e). As $V_d/V_h$ is increased further to 1.08, the wake bends outwards from the rotational axis and subsequently develops into upwash next to the rotor, thereby leading to an extensive recirculation zone near the rotor tip. This wake structure is approximately contained in a toroidal form, which is a primary flow characteristic observed in the VRS (Green et al. Reference Green, Gillies and Brown2005). This observation suggests that the flow at $V_d/V_h = 1.08$ is in the onset of VRS, wherein the rotor wake begins to transition from tubular to VRS form. As $V_d/V_h$ increases from 1.08 to 1.52, the centre of the recirculation zone is gradually shifted upstream (see figures 5b–d). Furthermore, the downwash region derived under the rotor gradually narrows as $V_d/V_h$ increases; this implies that the rotor wake is compressed further. Under the effect of wake compression, the axial coordinate of the maximum $\bar {u}/V_h$ measured at $x/R = 1.25$ gradually moves upstream, with $V_d/V_h$ increasing from 1.08 to 1.52, increasing the maximum magnitude of $\bar {u}/V_h$ by more than 40 % (see figure 5e).

Figure 5. Contours of the normalized time-averaged axial velocity superimposed with streamlines for the isolated rotor at  $V_d/V_h$ values (a) 0.87, (b) 1.08, (c) 1.30, and (d) 1.52. (e) Profiles of the normalized mean radial velocity for the isolated rotor at $x/R = 1.25$ (marked as green lines in a–d) at $V_d/V_h$ values from 0 to 1.52.
Figure 6 shows the representative contours of the instantaneous vorticity superimposed with velocity vectors at  $V_d/V_h$ ranging from 0 to 1.52. The tip vortex is formed at each rotor tip owing to the pressure difference between the suction and pressure sides of the rotor blade. During hovering, the tip vortices are observed at each rotor tip, rotating in opposite directions to each other, and proceed downwards (see figure 6a). At $V_d/V_h = 0.87$, it is roughly contained in a tubular form, similar to that observed during hovering, despite the wake spreading in a region far from the rotor due to the effect of descent speed; this can be confirmed by comparing figures 6(a) and 6(b). This observation reveals that the flow at $V_d/V_h = 0.87$ corresponds to a flow state referred to as pre-VRS, wherein the rotor wake remains locked in the tubular topology. At $V_d/V_h = 1.08$, the instantaneous flow states of the rotor wake are classified primarily into two distinct topologies, as shown in figures 6(c,d). In the first flow topology, the tip vortices are directed downwards within a streamtube, as shown in figure 6(c). This indicates that despite an increase in $V_d/V_h$, the rotor wake remains temporarily in the tubular topology observed in pre-VRS. By contrast, in the second flow topology, the tip vortices are accumulated within a recirculation flow zone near the rotor tip, as shown in figure 6(d). This indicates that the rotor wake at $V_d/V_h = 1.08$ lies in a flow state referred to as incipient VRS, wherein the flow switches intermittently between the VRS and tubular topologies. This result agrees with those presented in earlier studies (Newman et al. Reference Newman, Brown, Perry, Lewis, Orchard and Modha2003; Green et al. Reference Green, Gillies and Brown2005), which observed the intermittent transition of the rotor wake into a VRS form at the onset of VRS. Figures 6(e, f) show the representative instantaneous fields of the rotor wakes at $V_d/V_h = 1.30$ and 1.52, respectively. The toroidal wake structures are observed in all measured instantaneous flow fields at these descent rates. This result indicates that the rotor wake at $V_d/V_h$ values of 1.30 or higher belongs to a flow state referred to as fully developed VRS, wherein the flow remains locked within the VRS topology.

Figure 6. Contours of normalized instantaneous vorticity superimposed with instantaneous velocity vectors at  $V_d/V_h$ values (a) 0, (b) 0.87, (c) 1.08 (tubular form), (d) 1.08 (toroidal form), (e) 1.30, and ( f) 1.52.
Correlation analysis was conducted between the instantaneous flow field and the representative flow field to evaluate quantitatively the probability of vortex ring formation. This method was used in an earlier study to determine the probability of the flow entering the VRS topology for an isolated rotor in axial descent (Green et al. Reference Green, Gillies and Brown2005). The time-averaged flow fields of  $V_d/V_h = 0.87$ and 1.52, denoted by squares in figures 7(a) and 7(b), were used as representative flow fields for the tubular and VRS topologies, respectively. It should be noted that the flow fields at $V_d/V_h = 0.87$ and 1.52 are suitable for representing the tubular and VRS topologies, respectively, because these flows remained locked within their forms, as shown in figures 6(b, f). One hundred instantaneous flow fields were randomly selected for every $V_d/V_h$, and correlation coefficients were calculated between each instantaneous flow field and representative flow field. Figures 7(c–f) show the correlation coefficients of the instantaneous flow fields at $V_d/V_h = 0.87$, 1.08, 1.30 and 1.52 with representative flow fields. Here, the correlation coefficients with the representatives of tubular and VRS topologies are denoted by $C_{Tu}$ (open symbols) and $C_{VRS}$ (closed symbols), respectively. In plotting the figures, the evaluated instantaneous flow fields are arranged in the ascending order of $C_{Tu}-C_{VRS}$ values and assigned case numbers from 1 to 100. The correlation analysis in the inner region (red squares in figures 7a,b) and outer region (blue squares in figures 7a,b) were performed independently; therefore, the same case number between the outer and inner region does not necessarily refer to the same instantaneous flow field. The wake structures of instantaneous flow fields were classified as tubular and VRS forms by comparing their corresponding $C_{Tu}$ and $C_{VRS}$ values. For example, an instantaneous flow field with a $C_{Tu}$ value that is higher than its $C_{VRS}$ value is interpreted as being closer to the tubular form. Conversely, an instantaneous flow field with a $C_{VRS}$ value larger than the $C_{Tu}$ value is closer to the VRS form. At $V_d/V_h = 0.87$, for every measured instantaneous flow field, the $C_{Tu}$ values are significantly higher than the $C_{VRS}$ values in the inner and outer regions (see figure 7c). This shows that all evaluated instantaneous flow fields at $V_d/V_h = 0.87$ remain locked into the tubular form. At $V_d/V_h = 1.08$, as shown in figure 7(d), the correlation coefficients intersect each other at the balancing point. The instantaneous flow fields located on the left-hand side of the balancing point, whose $C_{VRS}$ values are higher than $C_{Tu}$ values, are closer to the VRS form observed at the high descent rate ( $V_d/V_h = 1.52$). By contrast, the instantaneous flow fields located on the right-hand side of the balancing point, whose $C_{Tu}$ values are higher than $C_{VRS}$ values, are closer to the tubular form observed at a low descent rate ( $V_d/V_h = 0.87$). The probabilities of flow entering VRS topology, hereafter referred to as the VRS ratio (= number of flows in the VRS topology/total number of flows evaluated), are 0.75 and 0.77 for the outer and inner regions, respectively. The VRS ratio at $V_d/V_h = 1.08$ is higher than 0.5, which indicates that the rotor wake is more often in the VRS topology than in the tubular topology. At $V_d/V_h = 1.30$ and 1.52, the $C_{VRS}$ values are higher than the $C_{Tu}$ values in the inner and outer regions for every instantaneous flow field (see figures 7e, f). This result indicates that VRS-like wake structures are generated stably near the inner and outer rotor blades at $V_d/V_h$ values of 1.30 or greater.

Figure 7. Time-averaged streamlines for the isolated rotor at  $V_d/V_h$ values (a) 0.87 and (b) 1.52. Flow fields in the red and blue squares were used as the representative flow fields of tubular and VRS forms in the inner and outer regions, respectively. (c–f) Correlation coefficients of instantaneous flow fields with the representative flow fields of tubular (open symbols) and VRS (closed symbols) forms at $V_d/V_h$ values (c) 0.87, (d) 1.08, (e) 1.30, and ( f) 1.52. The correlation coefficients in the inner and outer regions are denoted as red and blue symbols, respectively. The blue and red dashed lines in (d) denote the VRS ratios of the flow fields in the outer and inner regions, respectively.
3.2. Twin-rotor wake characteristics in pre-VRS
To understand comprehensively the effects of rotor–rotor interaction on the wake characteristics in pre-VRS, the flow fields of the twin rotors were measured at  $V_d/V_h = 0.87$ for several values of the normalized distance between the rotor tips ( $s/R$). Figure 8(a) shows the variations in the contour of the normalized time-averaged axial velocity and streamlines for the twin rotors with varied $s/R$ values in pre-VRS. For $s/R = 2.5$, the rotor wake proceeds downwards and spreads radially in an area far from the rotor. The rotor–rotor interaction slightly reduces the strength of the upwash flow between rotor tips, with delayed foci formations in the inner region downstream. This upwash flow is gradually attenuated as $s/R$ decreases; therefore, it does not reach the tip path plane for $s/R = 2.5$, and no longer forms between the rotor tips for $s/R \leq 1.0$. Given the narrow interval between the rotor tips, the two wakes produced from each rotor merge together below the rotors. In the outer region, the foci formations are delayed further downstream as $s/R$ decreases, reaching the lower boundary at $s/R = 0.25$.

Figure 8. (a) Variations of the contour of normalized time-averaged axial velocity and streamlines for twin rotors with  $s/R$ from 2.5 to 0.25 at $V_{d}/V_{h} = 0.87$. (b) Normalized time-averaged axial velocity profiles of the rotor wake measured at $y/R = -0.5$, $-1.5$ and $-2.5$ for the isolated rotor (black dashed lines) and the twin rotors with $s/R = 2.5$ (red lines), 1.0 (green lines) and 0.25 (purple lines).
To detail the rotor wake velocity, the profiles of the mean axial velocity along  $x/R$ were evaluated at $y/R = -0.5$, $-1.5$ and $-2.5$, and presented in figure 8(b). At $y/R = -0.5$, jet-like flows occur in each of the inner and outer regions, regardless of the value of $s/R$. As $s/R$ decreases from 2.5 to 0.25, the peak position of the jet-like flows is shifted slightly towards the adjacent rotor, which is more pronounced in the inner region than in the outer region. This implies that rotor wake is deflected towards the adjacent rotor, as the rotor–rotor interaction is reinforced. At $y/R = -1.5$ and $-2.5$, the inner and outer jet-like flows are merged into a single jet-like flow. The axial velocity magnitude increases gradually with decreasing $s/R$ at $y/R = -1.5$ and $-2.5$. This increase in the axial velocity is more pronounced in the inner region, and less in the outer region. This phenomenon is attributed to the loss of upwash between the rotors in the presence of strong rotor–rotor interaction, as described in figure 8(a).
Further insights into the effects of rotor–rotor interaction are obtained from the instantaneous flow fields around the rotor. Figures 9(a,c) show the representative contours of the instantaneous vorticity superimposed with velocity vectors for  $s/R = 2.5$ and 0.25, respectively. At $s/R = 2.5$, tip vortices are induced from rotor tips owing to the pressure differences between the suction and pressure sides of the rotor blade. They travel downwards within the streamtube and establish a tubular wake structure. The tip-induced vorticity is gradually attenuated further downstream, owing to turbulent diffusion (see the inset of figure 9a). At $s/R = 0.25$, tip vortex pairs rotating in opposite directions are derived at adjacent rotor tips. Because of the very narrow interval between the rotors, the strong rotor–rotor interaction results in the wakes being located close to each other, thereby combining the two wakes into the merged downwash flow. As the merged flow develops further, the inner tip vortices are rapidly dissipated, owing to interactions between the tip vortices rotating in opposite directions (see the inset of figure 9c).

Figure 9. (a,c) Contours of instantaneous vorticity superimposed with instantaneous velocity vectors in the inner region of the rotor wake at  $V_{d}/V_{h} = 0.87$ for $s/R$ values 2.5 and 0.25, respectively. (b,d) Contours of the normalized turbulent kinetic energy (TKE) superimposed with streamlines for $s/R = 2.5$ and 0.25, respectively.
Figures 9(b,d) show the contours of the normalized turbulent kinetic energy (TKE) values of the twin-rotor configuration for  $s/R = 2.5$ and 0.25, respectively. For $s/R = 2.5$, high values of TKE fluctuations are developed along the tip vortex trajectories extending from each rotor tip (see the contour for $s/R = 2.5$ in figure 9b). The trajectory gradually diffuses laterally along the downstream direction, thereby implying the presence of the wake bundling phenomenon discussed in an earlier study (Brand et al. Reference Brand, Dreier, Kisor and Wood2011). Therefore, high values of TKE fluctuations are developed in the broad region away from the rotor at approximately $y/R < -1.5$. As $s/R$ decreases to 0.25, the TKE fluctuations weaken significantly in the inner region (see the contour for $s/R = 0.25$ in figure 9d). This reduction of TKE fluctuations in the inner region is attributed to two factors: (1) the dissipation of the tip vortices, and (2) the delay of the wake bundling phenomenon. First, the tip vortices are located close to each other due to the strong rotor–rotor interaction, and consequently, they dissipate quickly, as described in the contour for $s/R = 0.25$ in figure 9(c). Thus the region of high TKE fluctuations tracing the inner tip-vortex trajectory gradually disappears as it progresses downstream. Second, the rotor–rotor interaction accelerates the axial velocity magnitude in the inner region as the two rotor wakes are synthesized into a single downwash flow (see figure 8b). Owing to the increase in the axial momentum of the rotor wake, the wake bundling appears delayed downstream over the lowest boundary of the contour, thereby alleviating the TKE fluctuation intensity in the inner region for $s/R = 0.25$. Unlike the significant changes in the normalized TKE with $s/R$ observed in the inner region, the normalized TKE in the outer region does not change considerably, despite the decrease in $s/R$.
These observations show that the rotor–rotor interaction directly affects the time-averaged wake structure and flow fluctuations of the rotor wake in pre-VRS. Strong rotor–rotor interaction accelerates mean axial velocities of the rotor wake, which is more pronounced in the inner region than in the outer region (see figure 8b). Furthermore, rotor–rotor interaction dissipates the strength of tip vortices induced from adjacent rotor tips, thereby alleviating flow fluctuations in the inner region (see figure 9). These findings suggest that the effect of the rotor–rotor interaction is stronger in the inner region than in the outer region, which intensifies the asymmetry of wake characteristics about its rotational axis.
3.3. Twin-rotor wake characteristics in incipient VRS
To understand the aerodynamic effects of rotor–rotor interaction in incipient VRS, the flow fields around the twin rotors were measured at  $V_d/V_h = 1.08$. Note that the flow at $V_d/V_h = 1.08$ for the isolated rotor is interpreted as being in incipient VRS, wherein the vortex ring is intermittently formed near the rotor blade. Figure 10(a) shows the contours of the normalized time-averaged axial velocity and streamlines for twin rotors with varying $s/R$. For $s/R = 2.5$, the streamlines reveal that the rotor wake bends outwards from the rotational axis and forms recirculation zones around each rotor tip. The centre of the vortex ring structure in the outer region is located in a position similar to that of the isolated rotor; in the inner region, it is located closer to the rotor than that of the isolated rotor because a vortex ring pair formed between rotor tips collide with each other in a limited space (see figure 10b). Despite the decrease of $s/R$ to 1.5, the vortex ring structure remains near each rotor tip; the centres of the vortex ring gradually move inwards and downward of the rotor in the inner and outer regions as $s/R$ decreases from 2.5 to 1.5 (see figure 10b). The change in the centre position of the vortex ring according to $s/R$ is more pronounced in the inner region than in the outer region. This indicates that the vortex ring pairs formed in each adjacent rotor collide with each other in the inner region, thereby pulling the centre of the inner vortex ring in the direction of each rotor. As $s/R$ decreases further, the rotor wake gradually expands downwards; for $s/R = 1.0$, the upwash flow between adjacent rotor tips no longer reaches the tip path plane. This observation shows that the strong interaction between wakes can collapse the vortex ring structure in the inner region, even at the descent rate at which the vortex ring is formed for the isolated rotor. For the lowest $s/R$ value 0.25, the rotor wake in the inner region no longer bends toward the adjacent rotor, and upwash flow disappears between the rotor tips. Instead, the rotor wake extends further downwards, reaching the lower boundary in the inner region. In the given range of low $s/R$ where the vortex ring collapses in the inner region, the recirculation flow still occurs in the outer region. The centre of the vortex ring in the outer region gradually moves inwards and downwards as $s/R$ decreases (see figure 10b). To further illustrate the effect of rotor–rotor interaction on the wake velocity, the time-averaged axial velocity profiles were measured along $x/R$ at $y/R = -0.5$, $-1.5$ and $-2.5$, and presented in figure 10(c). At $y/R = -0.5$, the peak position of each jet-like flow in the inner and outer regions gradually shifts to the rotational axis with a decrease in $s/R$. In the inner region, the magnitude of peak axial velocity increases by more than 20 % with the decrease in $s/R$; on the other hand, no significant change occurs in the outer region. At $y/R = -1.5$ and $-2.5$, the magnitude of the axial velocity increases gradually with decreasing $s/R$. The change in the axial velocity with $s/R$ is more pronounced in the inner region than in the outer region. This is because the rotor–rotor interaction weakens the upwash flow between the rotor tips, which can directly affect the wake velocity in the inner region.

Figure 10. (a) Variations of the contour of normalized time-averaged axial velocity and streamlines for twin rotors with  $s/R$ from 2.5 to 0.25 at $V_{d}/V_{h} = 1.08$. (b) Locations of inner (open circle symbols) and outer (open triangle symbols) vortex ring centres identified by the streamlines for the isolated rotor (black) and twin rotors with various $s/R$ values. (c) Normalized time-averaged axial velocity profiles of the rotor wake measured at $y/R = -0.5$, $-1.5$ and $-2.5$ for the isolated rotor (black dashed lines) and the twin rotors with $s/R = 2.5$ (red lines), 1.0 (green lines) and 0.25 (purple lines).
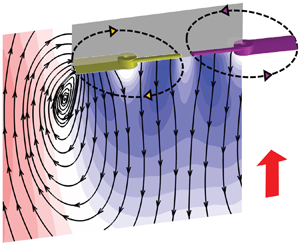
Figure 11(a) shows the contours of the time-averaged normalized radial velocity and streamlines for twin rotors with  $s/R = 2.5$, 1.5 and 0.25. Here, the presence of strong sidewash generated within the recirculation zone shows the presence of vortex rings. Depending on the $s/R$ value, as the size and position of the recirculation zone change, the flow velocity within the recirculation flow also changes. In the inner region, the high-speed sidewash is formed within the recirculation zone for $s/R = 2.5$ and 1.5, where the vortex ring is generated. On the other hand, radial velocity is rarely induced in the inner region of $s/R = 0.25$, where the vortex ring collapses due to strong interaction between rotors. In the outer region, on the other hand, the sidewash is generated further downstream, and flow velocity within the recirculation zone is gradually reduced with decreasing $s/R$. This observation is confirmed in detail by the radial velocity profiles along $y/R$ at $x/R = -1.0$ presented in figure 11(b). As $s/R$ decreases from 2.5 to 0.25, peak radial velocity is gradually decreased and formed further downstream (see figure 11b). This change in the flow velocity in the recirculation zone with $s/R$ is attributed to a change in the probability of vortex ring formation. Figure 11(c) shows the variation in the VRS ratio according to $s/R$ measured in the inner (triangle symbols) and outer (square symbols) regions, respectively. It should be noted that the VRS ratio could not be evaluated via correlation analysis for the flow in the inner region with $s/R$ less than 1.0. This is because strong rotor–rotor interaction leads to the collapse of vortex rings, and these new wake structures cannot be classified into two different modes: tubular and VRS forms. For $s/R = 2.5$, the VRS ratios in the inner and outer regions are 0.75 and 0.77 (see the upper inset of figure 11c), respectively, similar to those evaluated for isolated rotors at the same descent rate, with a difference of less than 3 %. This indicates that the rotor–rotor interaction for a high $s/R$ value of 2.5 does not significantly affect the probability of flows transitioning into the VRS topology. As $s/R$ decreases, the VRS ratio gradually decreases in the inner and outer regions. These findings imply that rotor–rotor interaction prevents the flow from entering the VRS topology and supports the tubular flow topology for a longer time. Specifically, at the lowest $s/R$ value 0.25, the VRS ratio reaches 0.17 (see the lower inset of figure 11c), which suggests that the flow remains in the tubular topology for a longer period than in the VRS topology. At $s/R = 2.5\unicode{x2013}1.5$, where vortex rings are formed in both regions, the VRS ratio in the inner region decreases more rapidly with decreasing $s/R$ than in the outer region. This indicates that the effect of the rotor–rotor interaction is more pronounced in the inner region than in the outer region.

Figure 11. (a) Variations of the contour of normalized time-averaged radial velocity and streamlines for twin rotors with  $s/R$ from 2.5 to 0.25 at $V_{d}/V_{h} = 1.08$. (b) Time-averaged radial velocity profiles at $x/R = -1.0$ for the isolated rotor (black dashed line) and twin rotors with $s/R$ values ranging from 0.25 to 2.5. (c) Variations of the VRS ratio with $s/R$ for the inner (triangle symbols) and outer (square symbols) regions. Insets of (c) show correlation coefficients between instantaneous flow fields in the outer region for $s/R = 2.5$ (upper plot) and 0.25 (lower plot), and representative flow fields (see blue squares in figures 7a,b).
The variation of the instability of the flow topology with  $s/R$ can significantly affect the flow fluctuations around the rotor. For $s/R = 2.5$, the vortex ring structure is formed more frequently than in the tubular structure; therefore, the production of the normalized TKE is concentrated along the trajectory of the vortex ring (see the contour at $s/R = 2.5$ in figure 12a). As described in figure 11(c), the rotor–rotor interaction reduces the probability of the flow entering the VRS topology; for $s/R = 0.25$, the rotor wake spends more time in the tubular topology. The increase in the probability of the flow entering the tubular topology causes the high TKE fluctuation region to move further downward of the rotor (see figures 12a–d). Consequently, the TKE fluctuations intensify in the entire region below the rotor as $s/R$ decreases to 0.25 (see figure 12d). In the inner region, the vortex ring structure is disrupted for $s/R \leq 1.0$; consequently, high TKE fluctuations are no longer developed over the tip path plane between rotor tips (see figures 12c,d). Instead, the TKE fluctuations are highly induced along a trajectory extending from the inner tip via the convection of tip-induced vorticity.

Figure 12. Variations of the contour of the normalized turbulent kinetic energy superimposed with streamlines of the rotor wake at  $V_{d}/V_{h} = 1.08$ for $s/R$ values (a) 2.5, (b) 1.5, (c) 1.0, and (d) 0.25.
3.4. Twin-rotor wake characteristics in fully developed VRS
Figure 13(a) shows the variations in the contour of the normalized time-averaged axial velocity and streamlines with  $s/R$ for the twin-rotor configuration at $V_d/V_h = 1.52$. It should be noted that the flow at $V_d/V_h = 1.52$ is interpreted as belonging to the fully developed VRS for the isolated rotor. For $s/R = 2.5$, the inner and outer rotor wakes bend rapidly outwards from the rotational axis due to the high descent rate, and form recirculation flows near each rotor tip. The centre of the vortex ring structure is located closer to the rotor in the inner region than in the outer region by the effect of the rotor–rotor interaction (see figure 13b). In the inner region, the rotor wake remains within the recirculation zone despite the decrease of $s/R$ from 2.5 to 1.0. The closer the two adjacent rotors are to one another, the more compressed the inner vortex ring pair. By the effect of wake compression, the centre of the vortex ring gradually moves inwards and downwards with decreasing $s/R$ in the inner region (see figure 13b). It should be noted that the change in the centre position of the vortex ring is more pronounced in the inner region than in the outer region, enhancing wake asymmetry about the rotational axis. As $s/R$ is reduced further to 0.25, however, the two wake proximities are considerably close to each other, and no further upwash is formed between the rotors. Under the condition, the inner wakes expand downwards considerably and disrupt the vortex ring in the inner region (see the flow field for $s/R = 0.25$ in figure 13a). The inner wakes bend towards the outer regions of each rotor, forming a recirculating flow pair rotating in opposite directions under the rotors, whereas in the outer region, the rotor wake maintains a vortex ring structure over the entire range of $s/R$ values (see the flow fields for $s/R = 2.5$ to 0.25 in figure 13a). In the outer region, the centre of the vortex ring moves negligibly when $s/R$ is greater than 1.0, but is gradually shifted towards the rotor with decreasing $s/R$ below 1.0 (see figure 13b).

Figure 13. (a) Variations of the contour of normalized time-averaged axial velocity and streamlines for twin rotors with  $s/R$ from 2.5 to 0.25 at $V_{d}/V_{h} = 1.52$. (b) Locations of inner (open circle symbols) and outer (open triangle symbols) vortex ring centres identified by the streamlines for the isolated rotor (black) and twin rotors with various $s/R$ values. (c) Normalized time-averaged axial velocity profiles of the rotor wake measured at $y/R = -0.5$ and $-1.5$ for the isolated rotor (black dashed lines) and the twin rotors with $s/R = 2.5$ (red lines), 1.0 (green lines) and 0.25 (purple lines).
The normalized mean axial velocity profiles of the rotor wake are presented in figure 13(c). At  $y/R = -0.5$, two jet-like flows are derived from the rotor, irrespective of $s/R$. As $s/R$ decreases from 2.5 to 1.0, the peak magnitude of the inner flow decreases by 57 % due to the wake compression. This trend differs from that observed in incipient VRS because in the case of incipient VRS, the inner flow velocity accelerates as $s/R$ decreases, as presented in figure 10(c). When $s/R$ decreases further to 0.25, as the inner rotor wake expands downwards as shown in figure 13(a), the peak magnitude of the axial velocity at $y/R = -0.5$ is significantly increased in the inner region (see figure 13b). On the other hand, the jet-like flow in the outer region for $s/R = 0.25$ becomes smaller than that for higher $s/R$ values. At $y/R = -1.5$, the axial velocity profiles for $s/R = 2.5$ and 1.0 have positive values irrespective of $x/R$ in both regions, which indicates that the downwash induced from the rotor does not reach $y/R = -1.5$. For $s/R = 0.25$, due to the inner wake expansion, the axial velocity profile becomes asymmetric about the rotational axis.
Figure 14(a) shows variations in the contour of the normalized time-averaged radial velocity and streamlines of twin rotors with  $s/R$. The high-speed sidewash flow is formed within the recirculation zone at $s/R = 2.5$ and 1.0. At $s/R = 0.25$, the sidewash flow is hardly formed in the inner region because the vortex ring structure collapses under the strong rotor–rotor interaction. Instead, the inner wake develops into a sidewash flow under the rotor and is directed towards the outer region. On the other hand, as the vortex ring structure is maintained in the outer region regardless of $s/R$, the high-speed sidewash flow formed within the outer recirculation zone does not change significantly, despite the change in $s/R$. The flow velocity within the recirculation zone may be affected directly by the probabilistic change in the vortex ring formation caused by the rotor–rotor interaction. Figure 14(b) shows the correlation coefficients of the instantaneous flow field in the inner region for $s/R = 2.5$ and 1.0, with the representatives of tubular and VRS topologies shown in the red squares of figures 7(a,b). As shown in figure 14(b), for $s/R = 2.5$ and 1.0, $C_{VRS}$ values for all measured instantaneous fields are significantly higher than $C_{Tu}$ values. This indicates that the inner wake remains locked in the fully developed VRS in which the vortex ring is stably generated. Figure 14(c) shows the correlation coefficients of the instantaneous flow field in the outer region for $s/R = 2.5$, 1.0 and 0.25, with the representatives of tubular and VRS topologies shown in the blue squares of figures 7(a,b). In the outer region, the values of $C_{VRS}$ are higher than the values of $C_{Tu}$ for all measured instantaneous flow fields, regardless of the $s/R$ values from 2.5 to 0.25 (see figure 14c). This indicates that the outer wake belongs to the fully developed VRS condition in which the rotor wake structure is locked in the form of a VRS, regardless of the $s/R$ value. This finding verifies that the rotor–rotor interaction at $V_d/V_h = 1.52$ does not affect the formation instability of vortex rings in the outer region. It differs from those observed at $V_d/V_h = 1.08$ in that the VRS ratio at $V_d/V_h = 1.08$ decreases with $s/R$. This verifies that the interaction between the rotors affects the probability of flow entering the VRS topology differently, depending on the descent rate.

Figure 14. (a) Variations of the contour of normalized time-averaged radial velocity and streamlines for twin rotors with  $s/R$ from 2.5 to 0.25 at $V_{d}/V_{h} = 1.52$. (b) Correlation coefficients between instantaneous flow fields in the inner region for $s/R = 2.5$ and 1.0. (c) Correlation coefficients between instantaneous flow fields in the outer region for $s/R = 2.5$, 1.0 and 0.25.
To obtain further insights into the rotor–rotor interaction, the flow fluctuations around the rotors were measured at various  $s/R$ values. Variations in the contour of the normalized TKE fluctuations with $s/R$ at $V_d/V_h = 1.52$ are presented in figure 15(a). At the highest $s/R$ value 2.5, high normalized TKE regions are concentrated along the vortex ring trajectory. Although $s/R$ decreases to 1.0, the probability of the vortex ring formation does not change with $s/R$ as described in figure 14(b); therefore, the production of TKE remains concentrated along the trajectory of the vortex ring. However, the TKE fluctuation region within the inner recirculation flow becomes narrower and higher as $s/R$ decreases to 1.0, due to the colliding of the vortex ring pair between rotor tips. For the lowest $s/R$ value 0.25, as the vortex ring between the rotors is disrupted in the inner region, the high normalized TKE region is generated below the rotor. In the outer region, the vortex ring structure is generated stably irrespective of $s/R$ value as described in figure 14(c); therefore, the highly normalized TKE is formed along the trajectory of the vortex ring irrespective of $s/R$ value, as shown in figure 15(a).

Figure 15. (a) Variations of the contour of the normalized turbulent kinetic energy superimposed with streamlines of the rotor wake for  $s/R = 2.5$, 1.0 and 0.25 at $V_{d}/V_{h} = 1.52$. (b) Contours of normalized instantaneous vorticity superimposed with instantaneous velocity vectors for $s/R = 0.25$.
In the presence of strong rotor–rotor interaction, new flow structures are evident near the rotor for  $s/R = 0.25$, which are divided into two distinct forms. Figure 15(b) presents the representative contours of the instantaneous vorticity superimposed with instantaneous velocity vectors for $s/R = 0.25$ at $V_d/V_h= 1.52$. Two inner wakes are merged directly below the rotor and develop into a single downwash flow. Subsequently, the merged flow bends laterally, and the curved rotor wake changes directions randomly towards each outer region of the twin rotors (see contours in figure 15b). Meanwhile, the vortex ring structure is maintained in the outer region irrespective of the direction of the inner wake. The structure of the recirculation flow observed in the outer region seems to be slightly affected by the direction of the inner sidewash. As the inner wake bends toward the outer region of Rotor 2, it does not significantly affect the flow in the outer region of Rotor 1, which can be confirmed by the leftmost contour of figure 15(b). Conversely, when the inner wake bends towards the outer region of Rotor 1, it intensifies the effective descent speed in the outer region; therefore, tip vortices induced at the tip of the outer region are accumulated close to the rotor (see the rightmost contour of figure 15b). The curved wake created in the inner region intermittently affects the recirculation flow of the outer region, thereby increasing the flow instability within the outer recirculation zone. Therefore, for $s/R = 0.25$, the intensities of TKE fluctuations within the recirculation zone become relatively higher in the outer region than those for higher $s/R$ values.
Under the VRS (i.e. incipient VRS and fully developed VRS), the effect of rotor–rotor interaction on the rotor wake varies depending on the wake region and the descent rate. First, the flow state in the outer region is consistent with the flow state of the isolated rotor regardless of the  $s/R$ variation from 0.25 to 2.5. On the other hand, in the inner region, the rotor–rotor interaction shifts the flow state to non-VRS for $s/R$ values within the critical value. It should be noted that the critical $s/R$ value is delayed as $V_d/V_h$ increases from 1.08 (incipient VRS) to 1.52 (fully developed VRS); compare figures 10(a) and 13(a). For $s/R$ values within the critical value, the inner wake no longer forms a vortex ring structure near the rotor tip. Thus the rotor wake exhibits different flow states between the inner and outer regions, resulting in enhanced asymmetry of the rotor wake about the rotational axis. For example, the rotor wake of $V_d/V_h = 1.52$ for $s/R = 0.25$ shows fully developed VRS and non-VRS in the outer and inner regions, respectively.
3.5. Thrust variations for the twin rotors
Thrust measurements were performed for the isolated and twin-rotor configurations, with varying  $V_d/V_h$ and $s/R$. Mechanisms of the thrust variations caused by the rotor–rotor interaction were then investigated in detail based on the above-mentioned wake features. Figure 16(a) shows the variation in the thrust coefficient for the isolated rotor with $V_d/V_h$ from 0 to 1.96. At $V_d/V_h = 0$ to 0.87, the thrust coefficient decreases slightly with $V_d/V_h$. The rotor wake is contained in the tubular form, which is similar to that in hovering flight; the thrust in pre-VRS is similar to that in hover. Thereafter, the thrust coefficient is reduced sharply, reaching a maximum thrust loss of approximately 20 % at $V_d/V_h = 1.20$. That is because the flow encounters the VRS, generating the recirculation flow near the rotor at $V_d/V_h$ greater than 1.08, as shown in figure 5(b). Finally, at $V_d/V_h$ of 1.20 or more, the thrust coefficient gradually increases as $V_d/V_h$ increases, and exceeds that during hovering at $V_d/V_h \geq 1.74$.

Figure 16. (a) Variations of the thrust coefficient of the isolated rotor with  $V_d/V_h$ from 0 to 1.97. (b) Variations of the change rate of thrust coefficient for the twin-rotor configuration, compared to the isolated rotor under the same $V_d/V_h$, with varying $s/R$ at $V_d/V_h = 0$, 0.87, 1.08 and 1.52. (c,d) Profiles of the normalized axial velocity along $x/R$ measured at $y/R = -0.15$ for the isolated rotor (dashed line) and twin rotor with various $s/R$ at $V_d/V_h$ values (c) 0.87 and (d) 1.08.
Figure 16(b) presents the change rates of the thrust coefficient, relative to that for the isolated rotor under the same descent rate, with varying  $s/R$ and $V_d/V_h$. At $V_d/V_h = 0$, the thrust coefficients are lower than that for the isolated rotor, irrespective of the $s/R$ value. The thrust loss caused by the rotor–rotor interaction reaches approximately 2 % at the lowest $s/R$ value 0.25. It should be noted that this amount of thrust loss is similar to the results of earlier studies (Zhao et al. Reference Zhao, Quan, Chen, Tang and Deng2019; Lee et al. Reference Lee, Chae, Woo, Jang and Kim2021). At $V_d/V_h = 0.87$, when the wake belongs to the pre-VRS, the strong rotor–rotor interaction reduces the thrust coefficient, compared with that of the isolated rotor. At the lowest $s/R$ value 0.25, the thrust coefficient decreases by approximately 2.5 % compared to that of the isolated rotor, similar to the results observed under hovering. At $V_d/V_h = 1.08$ and 1.52, where the flow belongs to the VRS, the interaction between the rotors results in higher thrust coefficients than that of the isolated rotor, under the same descent rate. The increase in thrust caused by the rotor–rotor interaction is more pronounced at $V_d/V_h = 1.08$, and less at $V_d/V_h = 1.52$. At $V_d/V_h = 1.08$, the thrust coefficient gradually increases as $s/R$ decreases from 2.5, reaching a maximum thrust increase of 8 % at $s/R = 1.25$. Thereafter, the thrust increase compared to the isolated rotor is gradually alleviated by a decrease in $s/R$; therefore, at the lowest $s/R$ 0.25, the thrust increase approaches 4 %. When $V_d/V_h$ increases to 1.52, the $s/R$ value of the maximum thrust coefficient is lowered to 0.5, and the corresponding thrust increase (compared to the isolated rotor) is reduced to less than 2 %.
To elucidate the mechanism of thrust variations under rotor–rotor interaction, the variation in the normalized axial velocity profiles measured at  $y/R$ closest to the rotor disk with $s/R$ are presented in figures 16(c,d). At $V_d/V_h = 0.87$, as the interaction between the rotors increases, the axial velocity profile is filled to a greater extent near the inner rotor tip. This is because the rotor wake is deflected away from the rotational axis, as indicated in figure 8(b). In terms of the blade element theory, the magnitude of the axial induced velocity directly affects the induced angle of attack and determines the effective angle of attack (Lee et al. Reference Lee, Chae, Woo, Jang and Kim2021). Therefore, the increase in the axial induced velocity reduces the effective angle of attack in the inner rotor tip and consequently results in thrust loss. This mechanism of change in the thrust coefficient with respect to $s/R$ is similar to the mechanism of thrust change during hovering, as reported in earlier studies (Lee & Lee Reference Lee and Lee2020; Lee et al. Reference Lee, Chae, Woo, Jang and Kim2021). This indicates that in the pre-VRS, the mechanism corresponding to the effect of rotor–rotor interaction on thrust changes is not changed from hovering owing to the low descent speed, although it is in the descending flight condition.
At  $V_d/V_h = 1.08$, when the flow belongs to the incipient VRS, the vortex ring generated near the rotor directly affects the thrust generation of the rotor. As described in § 3.3, the VRS ratio is 0.75 at $s/R = 2.5$, which implies that the VRS topology is formed more frequently than the tubular topology. When $s/R$ decreases to 1.5, the VRS ratio is reduced to 0.42; therefore, the rotor wake remains in the tubular topology for a longer duration, as described in figure 11(c). It is known that the re-ingestion flow caused by the vortex ring accelerates the induced velocity of the rotor, thereby reducing thrust (Brand et al. Reference Brand, Dreier, Kisor and Wood2011). Therefore, when $s/R$ decreases from 2.5 to 1.5, the decrease in the probability of vortex ring formation causes a decrease in the axial induced velocity around the rotor tip, as shown in figure 16(d); this, in turn, results in a thrust increase. It should be noted that the axial induced velocity increases slightly near the rotor root with decreasing $s/R$ from 2.5 to 1.5, which is expected to cause the thrust loss. However, considering that the cross-sectional thrust is proportional to the square of $x/R$, the increase of the sectional thrust near the rotor tip may exceed the decrease in the sectional thrust near the rotor root, resulting in an increase of the net thrust. As $s/R$ decreases to 0.25, the inner wakes derived from each rotor are close to each other, and upwash flow is no longer formed between rotor tips (see figure 10a); therefore, the normalized axial velocity increases in the inner region as shown in figure 16(d). This increase in the axial induced velocity with decreasing $s/R$ results in a reduction in thrust generation, as shown in figure 16(b). The thrust coefficient for $s/R = 0.25$ is higher than that for the isolated rotor, although the axial induced velocity of $s/R = 0.25$ is greater than that of the isolated rotor (see figures 16b,d). Thus it appears that the rotor blade in the outer region generates higher thrust with decreasing $s/R$ because the probability of vortex ring formation gradually decreases in the outer region, as shown in figure 11(c). These observations suggest that in the VRS, thrust generation in the rotor is affected directly by the variations in the wake characteristics caused by rotor–rotor interaction, such as changes in the probability of vortex ring formation.
4. Summary and concluding remarks
This study focused on the effects of rotor–rotor interaction on the wake characteristics of a twin-rotor configuration in axial descent. The flow fields for isolated and twin-rotor configurations were measured in a closed-circuit wind tunnel using a DPIV system. To evaluate quantitatively the flow instabilities around the rotor, the probabilities of the flows entering the tubular and VRS topologies were measured at various descent rates via correlation analysis. By comparing the correlation coefficients for the representative tubular and VRS forms, each instantaneous flow field is determined as to whether it resembles tubular or vortex ring topologies. For the isolated rotor, the rotor wake belonged to pre-VRS trapped in the tubular topology at low descent rates ( $V_d/V_h$). As $V_d/V_h$ increased, the flow became an incipient VRS that intermittently switched between the vortex ring and tubular form. As $V_d/V_h$ increased further, the flow eventually reached the fully developed VRS where the vortex ring structure was formed stably.
For the twin-rotor configuration, the rotor wake velocities were measured at various descent rates extending from the pre-VRS to fully developed VRS condition. The strength of the rotor–rotor interaction was controlled by adjusting the distance between the rotor tips ( $s/R$). In the pre-VRS condition at $V_d/V_h = 0.87$, the rotor wake travelled downwards within the streamtube zone regardless of the value of $s/R$. The upwash induced between the rotors in the inner region gradually decreased as $s/R$ decreased, thereby intensifying the mean axial velocity magnitude of the inner wake. For the lowest $s/R$ value 0.25, counter-rotating tip vortices were induced in the inner region and located close to each other. The tip vortices were dissipated in the inner region after the two inner wakes were merged into a single jet-like flow, thereby reducing the flow fluctuations within the tip vortex trajectory. In the incipient VRS at $V_d/V_h = 1.08$, the rotor wake for $s/R = 2.5$ bent outwards in the inner and outer regions, and formed vortex rings around the rotor. As $s/R$ decreased from 2.5 to 1.5, the probability of the flow entering the VRS topology gradually decreased. For $s/R$ values within 1.0, the vortex ring structure was disrupted by the strong wake interactions in the inner region. The collapse of the vortex ring alleviated the flow fluctuations in the inner region, as a sudden change of the flow topology between the tubular and VRS topologies no longer occurred. In the outer region, the probability of the flow entering the VRS topology gradually decreased as $s/R$ was decreased from 2.5 to 0.25. In the fully developed VRS condition at $V_d/V_h = 1.52$, the rotor wakes in both regions were locked in the VRS topology for $s/R$ = 2.5. Even if $s/R$ decreased to 1.0, the probability of the vortex ring formation was not affected by changing $s/R$. Therefore, the flow fluctuations in the inner region were high only along the trajectory of the vortex ring. As $s/R$ decreased to 0.25, the vortex ring structure was disrupted in the inner region due to the strong rotor–rotor interaction. The rotor wake for $s/R = 0.25$ expanded downwards and synthesized into a single jet-like flow, which bent towards the outer region of each rotor with intermittent switching of the direction of the curved flow. In the outer region, the rotor wake was stably locked in the VRS topology regardless of the value of $s/R$ in the range 2.5–0.25.
The thrust of the twin-rotor configuration was measured by using a loadcell in the wind tunnel and compared to that of the isolated rotor under the same descent rate. In pre-VRS, the rotor–rotor interaction caused a decrease in the thrust coefficient compared to that of the isolated rotor; it was more pronounced with decreasing  $s/R$. In incipient VRS, rotor–rotor interaction increased directly the rotor thrust by up to 8 % compared to that of the isolated rotor. Mechanisms of the thrust variations caused by the rotor–rotor interaction were investigated in pre-VRS and incipient VRS. It was confirmed that changes in the thrust generation are attributed to the variations in the wake characteristics with rotor–rotor interaction such as changes in the probability of vortex ring formation and disruption of vortex ring structure. Considering that the thrust loss under VRS is relieved with rotor–rotor interaction caused by properly tuned $s/R$, an understanding of rotor–rotor interaction can present a guideline for optimized designs of the multi-rotor UAV over the limitations of aerodynamic performances for an isolated rotor.
Funding
This work was supported by the Basic Science Research Program through the National Research Foundation of Korea (NRF) (grant no. NRF-2019R1F1A106406612).
Declaration of interests
The authors report no conflict of interest.
Author contributions
S.C. and S.L. conducted wind tunnel experiments for wake velocity measurements. S.C. and J.K. analysed the flow field data and wrote the paper.


 Open access