


Introduction
In 1986, a basin-scale array of Argos buoys operated on ice floes in the Weddell—Enderby Basin, permitting an analysis of ice motion and deformation over the area of the basin. Two of the buoys (Argos numbers 0534 and 1533) were deployed in the south-east and north-west Weddell Sea in December 1985 and March 1986, respectively, in a joint SPRI/BAS programme. By August 1986, these buoys had drifted into the west and north of the Weddell Sea, and the basin-scale array was completed by the deployment of ten buoys in the Maud Rise area by H. Hoeber of the Meteorologisches Institut der Universität Hamburg, from FS Polarstern during the Winter Weddell Sea Project 1986 (Reference Hoeber and Gube–LenhardHoeber and Gube-Lenhardt, in press). The northernmost (3292) and southernmost (6576) of these buoys have been combined with the two SPRI/BAS buoys to create a quadrilateral whose motion and deformation have been analysed. Analyses of the track of buoy 0534 on short (daily) and long (seasonal) time-scales are reported in accompanying papers in this volume by Rowe and others (1989) and Reference Limbert, Morrison, Sear, Wadhams and RoweLimbert and others (1989).
The SPRI/BAS buoys were supplied by Polar Research Laboratory, Santa Barabara, and were instrumented to measure position, atmospheric pressure, air temperature, buoy hull temperature, and wind speed (buoy 0534 only). The German buoys were supplied by Bergen Ocean Data and measured these parameters and wind direction and near-surface current (buoy 6576). Details of the buoy deployments are given in Table I.
Method Of Analysis
The techniques used to reduce and correct the raw stream of positional data are described in Rowe and others (1989). The initial product was a set of positions for each buoy at intervals exceeding 20 min. The orbital parameters of the NOAA/TIROS-N satellites, which maintain Service Argos, resulted in a daily gap of 2–6 h with no position fixes, occurring in the morning in the western Weddell Sea and near noon for buoys farther east. To minimize the
Table 1 Launch data for the buoy array


Fig. 1. The locations of buoys 0534, 1533, 3292, and 6576 in the Weddell Sea with insets showing daily positions.

Fig. 2. Shape of the array at 11 d intervals, with inset showing the daily positions of the centroid of the four-buoy array.
effect of this gap and to reduce the data set to uniform time steps in which significant motion occurred, we decided to deal with daily positions at midnight GMT. The midnight position was obtained by constructing cubic splines in latitude and longitude through the four fixes nearest to midnight (two before, two after) to interpolate to midnight.
Figure 1 shows the overall tracks of the four buoys obtained using 55 daily positions (44 for buoy 3292), while Figure 2 is a plot of the buoy-array shape at 11 d intervals which shows the gross features of the array deformation. Figure 2 also shows the daily positions of the centroid of the four-buoy array.
The nature of the array deformation was examined by calculating the differential kinematic parameters (DKPs) using the change-of-area method. This was discussed by Reference SaucierSaucier (1955) with respect to atmospheric divergence, vorticity, shear, and normal (stretch) deformations, and was applied to ocean-drifter data by Reference Molinari and KirwanMolinari and Kirwan (1975).
The divergence, D, of a velocity field (U,V) is
where U and V are eastward and northward components. An approximation to the divergence in the region enclosed by the buoys is the fractional time rate of change in the area A enclosed by the array, i.e.
Saucier showed that this could be closely approximated by:

where A0 and A1 are the areas enclosed by the array at times t0 and t1.
The vorticity, shear, and stretch deformations can be calculated in a similar manner, following Molinari and Kirwan, by selected rotations of the U and V components of the velocity vectors as follows:

so giving:


where A′, A″, and
Physically, divergence is the rate of change of array area without change of orientation or shape; vorticity is the rate of rotation of the array without area or shape change; shear is the rate of shape change produced by differential motions of the array sides parallel to those sides; and stretch is the rate of shape change produced by differential motion of the array sides normal to those sides.
The Large-Scale Pattern of Motion
The long-term pattern of motion revealed by the drift tracks of Figure 1 is typical of the ice and water circulation in the Weddell Sea. Monthly climatological means of sea-level pressure and geostrophic winds were calculated by Reference Jenne, Crutcher, van Loon and TaljaardJenne and others (1974) and presented graphically by Reference Zwally, Comiso, Parkinson, Campbell, Carsey and GloersenZwally and others (1983). They showed that the sea-level pressure field is dominated by a circle of lows over the Southern Ocean. One of these is centred at about 62 °S, 20°E during January-August and is lozenge-shaped with its major axis orientated east-west. This produces a pattern of geostrophic winds comprising a cyclonic circulation within the Weddell Sea itself, easterly winds near the coast of the eastern Weddell-Enderby Basin, and westerly winds north of 60°S. Neglecting ice-interaction terms, the long-term average ice drift approximates in direction to these geostrophic winds. In the northern part of the region the eastward flow is the Antarctic Circumpolar Current while the westward coastal flow is the East Wind Drift or Antarctic Coastal Current. In the Weddell Sea, the cyclonic circulation is normally known as the Weddell Gyre, but the circulation is not always closed at its eastern end.
From September to December the monthly averaged low-pressure belt extends further to the west and breaks up into two separate circulations, of which one remains centred in its original position while the other is centred in the Weddell Sea itself, at approximately 65°S, 30°W. This produces a geostrophic flow during the spring months which intensifies the gyral circulation in the Weddell Sea and produces a closure of the gyre at the eastern end of the Weddell-Enderby Basin.
Reference Limbert, Morrison, Sear, Wadhams and RoweLimbert and others (1989) have analysed the long-term motion of buoy 0534 over 400 d, together with the motions of other drifters. Generally, they conform to this pattern and yield long-term averages for the northward drift speeds up the western side of the Weddell Sea. The tracks in Figures I and 2 also comply with this pattern of circulation. Buoy 0534 moves northward up the western side of the Weddell Sea, buoy 1533 moves east-north-east, and buoy 3292 moves generally eastward but with an increasing trend towards a southward component of motion as if it were being influenced by an eastern recirculation of the gyre. Only buoy 6576 has an apparently anomalous motion.
In the Southern Hemisphere, if a buoy array is positioned asymmetrically within a cyclonic gyre, the centroid of the array should describe a clockwise arc with an overall eastward motion vector if it is north of the gyro centre and an overall westward motion vector if it is south of it. The centroid in Figure 2 settles down after Day 260 to a trajectory which indicates that the circulation is cyclonic with an effective centre south of the centroid position.
The shorter-term aspects of the buoy motions which do not conform to climatological means are:
-
a. The circles and loops in the drift tracks of the buoys.
-
b. The apparent reversal of the gyre which occurs on a number of occasions, but most dramatically during Days 250–255 (shown by the buoy tracks and that of the centroid which had an anti-cyclonic trajectory during these days).
We examine the causes of these anomalies by reference to the DKP results.
Interpretation Of The Array Deformation
Figure 3 shows the results of the analysis of the array quadrilateral for Days 243–286, while Figure 4 shows the analysis of a triangle for Days 232–286 (buoy 3292 was only operational for 44 d). Figures 3 and 4 also show the change in the total area of the array, representing a running time integral of the divergence.
The key statistics of the DKPs are given in Table II. Positive vorticity indicates clockwise rotation; positive shear indicates a shape change in which the northern pair of buoys moves west relative to the southern pair; positive
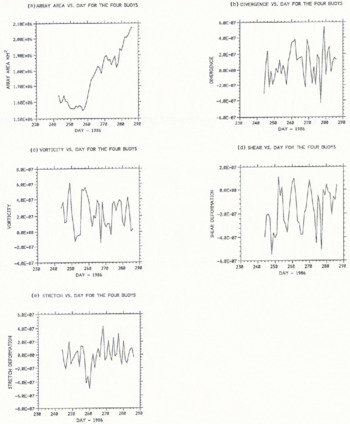
Fig. 3. Area and differential kinematic parameters of the four-buoy array for Days 243 and 286. (a) Area; (b) divergence; (c) vorticity; (d) shear deformation; and (e) normal deformation (stretch).
stretch indicates a shape change resulting in a greater degree of stretching along an east-west axis.
Using a limited number of drifters requires that care be taken in interpreting DKPs as they could be dominated by the anomalous motion of a single buoy. They also describe only the linear part of the motion. Examination of Figures 3 and 4 reveals a number of significant features. They are:
-
a. The fact that the divergence over the 55 d period (Fig. 4) shows an upward trend after Day 255. Since the increase begins from a negative value, the array area first diminishes and then increases rapidly.
-
b. The significant reversal of vorticity during Days 252–255, indicating an apparent reversal of the Weddell Gyre during that period.
-
c. The significant stretch and shear event during Days 258–260.
-
d. The peak in convergence during Day 277.
These features can be explained qualitatively by examination of the atmospheric forcing field in the Weddell-Enderby Basin during the study period. U.K. Meteorological Office computer surface analyses were used, as well as analyses carried out aboard Polarstern (Reference RabeRabe, 1987). The analyses must be treated with reserve because of the sparseness of weather stations.
Throughout much of the period, depressions tracked from the Bellingshausen Sea and South Pacific across the Antarctic Peninsula and into the Weddell Sea, continuing south-east to meet the Antarctic continent. Cyclonic activity occurred well south of the ice edge (64–70 °S) and was also

Fig. 4. Area and differential kinematic parameters of the three-buoy array for Days 232–286. (a) Area; (b) divergence; (c) vorticity; (d) shear deformation; and (e) normal deformation (stretch):
Table 2 mean and standard error over 44 d (four-buoy) and 55 d (three-buoy) periods
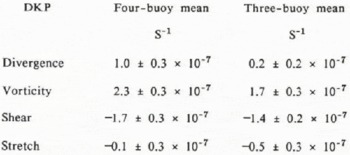

Fig. 5. Surface meteorological analyses for 00.00 GMT on Day 253, Day 260, and Day 277. The daily movement of key depressions is also shown.
strong further east, near 0°. This pattern prevailed during Days 232–247. Between Days 248 and 250, however, a depression moved eastward much farther north across Tierra del Fuego and, after fading for a day, deepened and moved rapjdly eastward from South Georgia, along the ice edge to 30 E by Day 254 (Fig. 5). At this time no major cyclones deeper than 980 mbar were present in the west-central Weddell Sea. Between Days 255 and 263, travelling anticyclones and ridges dominated the area just to the west of the Antarctic Peninsula, cutting off the supply of depressions to the Weddell Sea. At this time the near-surface atmospheric circulation in the Weddell Sea was weak and dominated by a depression to the north and east (Fig. 5b). During Days 263–276 the original pattern returned. Finally, in the last 10 d of the record, cyclonic activity was concentrated near the coast at 0° while, in Drake Passage and over the Antarctic Peninsula, anti-cyclones and ridges dominated.
Features (a)-(d) can now be considered. We expect long-term positive divergence of the buoy array since two of the buoys are south of the Antarctic Divergence and the others are well to the north. The Divergence runs from approximately 68 °S in the western Weddell Sea to 65°S in the east (Reference DeaconDeacon, 1984). Feature (a), the initial convergence and decrease in three-buoy array area, is a consequence of the initial mean north-west motion of buoy 6576 which is within the shear zone between the coastal current and the Antarctic Circumpolar Current. The subsequent divergence is as expected and is enhanced by the eastward motion of buoy 6576 after it moved to the north between about Days 252 and 270. The addition of a fourth buoy appears not to affect the overall divergence.
Event (b) occurred during Days 252–255 when vorticities were negative (implying anti-clockwise rotation) for 4 d with positive shear. The surface analysis for 00.00 GMT on Day 253 is shown in Figure 5, together with the track of the depression which crossed the study region to the north. The analysis implies weak anti-cyclonic flow in the southern Weddell Sea instead of the more common cyclonic rotation. At this time, buoy 0534 stopped moving north and described a small circle, clockwise between Days 249 and 253, whilst buoy 1533 had reversed course and was moving slowly west. Buoy 6576 moved steadily west between Days 243 and 260, except between Days 250 and 255 when it travelled north-east in response to forcing from a depression situated close to 68°S, 30°E. Finally, buoy 3292 described a large circle anti-clockwise between Days 250 and 260, initially in response to forcing from the depression to the north, near the ice edge.
Event (c) occurred between Days 258 and 260 when the normal deformations (stretch) were strongly negative, whilst the array vorticities and shear deformations were positive. At this time, a deep depression became established in the eastern basin after having moved across the Weddell Sea in about 7 d (Fig. 5). This introduced strong variations in wind forcing on the two eastern buoys. Buoy 3292 continued in its well-defined anti-cyclonic loop between Days 256 and 261 as the depression crossed to the south of it. After Day 261, when the depression slowly filled and moved into Antarctica, the buoy moved rapidly east-north-east. Buoy 6576 looped cyclonically as the same depression moved west-east, to the north of the buoy. After Day 262, winds blowing around the filling depression to its south-east caused the buoy to move steadily north-east. Buoy 1533 also moved steadily north-east while buoy 0534 moved north, then east after Day 260. In summary, the wind forcing resulting from the movement of the depression in the eastern Weddell Sea caused buoys 6576 and 3292 to move in loops with opposite senses of rotation but the strong cyclonic rotation of buoys 6576 and 0534 dominated to give the arrays overall cyclonic vorticity. Similarly, the buoys’ motions explain the positive (south-east—north-west axis) shear and negative stretch.
Event (d) was the large convergence on Day 277. This appears anomalous, as divergence was increasing gradually between Days 272 and 286. Figure 5 shows the meteorological chart for 00.00 GMT on Day 277. A large depression was situated near 0°, but comparison of meteorological charts reveals no outstanding differences between successive days with regard to wind forcing. Buoy 6576 was moving slowly east at this time while buoy 3292 was tracking quickly south-east, being to the north-east of the depression (Fig. 5). In the western Weddell Sea, under the influence of the system far to the east, buoy 0534 was moving slowly north-north-east, whilst buoy 1533 was tracking quickly east. Thus, no clear explanation can be found for the observed spike in convergence on Day 277.
The track of buoy 6576 is most interesting, as its circuitous route is largely determined by the positions and tracks of cyclonic disturbances in the region rather than displaying an underlying trend. Initially, the buoy moved north until Day 238. Between then and Day 250 it described two incomplete cyclonic loops and one complete anti-cyclonic loop in response to three separate cyclones crossing from the central Weddell Sea to near 10°E. Following this, it moved sluggishly towards the north-west as the system mentioned earlier crossed to the far north (Fig. 5). Between Days 255 and 260, the buoy moved rapidly south-west then west in response to the movement to and stagnation near 10 E of a major depression. Then the buoy returned to the north and north-west until Day 271. During these 10 d, the major systems in the eastern basin were moving south into the continent just to the east of the buoy. After Day 271, buoy 6576 turned east and continued moving east until Day 286. Throughout these last 15 d several depressions stagnated close to the coast of Antarctica, between 10°W and 20°E (i.e. to the south and south-east of the buoy). It is clear that the eastward translation of buoy 6576 was a direct response to the predominantly westerly wind in the area at the time.
Additional Aspects of The Motion
Periodograms were generated of the four- and three-buoy DKPs (not shown). The time series are too short for statistically valid conclusions, but there are indications of quasi-periodicities of 9 and 5 d in vorticity and 5 and 3.3 d in divergence, suggesting that these were the preferred time-scales of sea-ice motion and thus of atmospheric forcing in the Weddell-Enderby Basin. These periodicities suggest that during this time the typical interval between major shifts in the position of the centre of action in the region was 9 d. The time taken for systems to move across the Antarctic Peninsula and either south-east into West Antarctica or east through the basin to 10°E, was either 3.3 or 5 d.
A further aspect of the data which deserves note is the way in which the details of buoy motions are uncorrelated one with another. The typical distance between buoys in this array is 1500 km. Reference ThorndikeThorndike (1986), in an analysis of buoy data from the Arctic, showed that coherent motion of the ice cover (i.e. strongly correlated trajectory excursions between pairs of buoys) occurs only within length scales of about 400 km. This is the distance over which internal ice stress is effective in rectifying the motion of the pack as a whole and may also be related to the correlation length of the geostrophic wind. An examination of the entire German mesoscale buoy array should demonstrate whether this figure is appropriate for the thinner ice of the Antarctic.
Conclusions
Over time-scales of a few days the anomalous motions of a buoy array in the Weddell-Enderby Basin are consistent with a qualitative analysis of the motion of major weather systems and thus with the atmospheric forcing on the buoys. Only one inexplicable event occurred during the record, that of convergence on Day 277. DKP analysis also suggests some preferred time-scales for sea-ice motion in the region at the time of maximum sea-ice extent. Further analysis will include time-series analyses of measures of the atmospheric circulation in the region and of the computer-generated surface analyses available.
In accompanying papers, Rowe and others (1989) have shown how the variability at shorter time-scales can be explained by tidal motion, while Reference Limbert, Morrison, Sear, Wadhams and RoweLimbert and others (1989) have shown how the long-term motion fits into the overall pattern of the Weddell Gyre. It is evident that arrays of buoys on ice floes can yield significant insight into the nature of ice circulation in the Antarctic on time-scales from hours to months.
Acknowledgements
We are grateful to V.A. Squire, Department of Mathematics and Statistics, University of Otago, for his contributions to this project while at SPRI. We also thank R. Muench, Science Applications International Corporation, Bellevue, Washington, for deploying buoy 1533 in the Weddell Sea; H. Hoeber, Meteorologisches Institut der Universität Hamburg, for permission to use data from buoys 3292 and 6576; M. Gube-Lenhardt, Alfred-Wegener-Institut für Polar- und Meeresforschung, Bremerhaven, for data processing and distribution for these buoys; and D. Warren (BAS) for useful discussion. Finally, we acknowledge the permission of the U.K. Meteorological Office to reproduce their surface analyses. P.W., D.R.C., and M.A.R. gratefully acknowledge support from the U.K. Natural Environment Research Council under grant GR3/5713A.


