


INTRODUCTION
The World Health Organization (WHO) has described avian influenza as an infectious disease of animals (usually birds and less commonly pigs) caused by type A strains of the influenza virus. The main reservoir of the virus is wild birds and in the last two decades it has been seen in commercial and domestics poultry in Asia and Africa. Few cases of transmissions to humans and other mammals have also been documented by the United States Centers for Disease Control and Prevention, and the WHO. This virus was first reported in one state in Nigeria in 2006. The disease spread to 25 states and the Federal Capital Territory (FCT) within weeks [Reference Ojo1]. The epidemic of H5N1 has huge socioeconomic consequences with respect to animal welfare, international trade and cost. The federal government set aside the sum of 1·5 billion Naira (11·5 million US$) for compensation alone for suspected birds that were culled throughout the nation to contain the spread of the disease. An economic impact assessment made by the Poultry Association of Nigeria (PAN) put the loss to farmers in the first 4 weeks of the outbreak to 14·4 billion Naira, which does not include those very small-scale farmers whose stock constitutes over 60% of the total national poultry population [Reference Duru2]. The consequence of the outbreak was devastating to the poultry owners as well as the consumer.
The initial boycott of chicken and eggs created high demand and pressure on the supply of fish and other meat products. Outbreaks of highly pathogenic avian influenza (HPAI) had been confirmed in some parts of Africa: Benin, 2007, 2008; Burkina Faso, 2006; Cameroon, 2006; Cote d'Ivoire, 2006; Djibouti, 2006, 2007; Egypt, 2006, 2007, 2008; Ghana, 2007; Nigeria, 2006, 2008, 2009; Niger, 2006; South Africa, 2006, 2011, 2012; Sudan, 2006, 2007; Togo, 2007, 2008, 2009 [3]. Despite the spread and incidence of H5N1, some farmers did not believe in its existence. This is very disturbing and may influence human infection [Reference Fasina4].
Many studies have attributed the spread of H5N1 virus in Nigeria and Africa to: international and inter-state poultry trade [Reference Fasina4, Reference Bello, Lukshi and Sanusi5]; as a result of regional influx of wild birds [Reference Fasina4]; presence of visitors on farm premises, purchase of live poultry and poultry products by farmers, and farm workers living outside the farm premises [Reference Fasina6]. Many households practised poultry farming at home (backyard) thereby increasing the risk of transmission of the avian virus to humans [Reference Musa7]. The management of backyard poultry farming has been identified as a challenge to the H5N1epidemic in Nigeria and improved biosecurity measures were advocated to prevent and control the spread of the disease [Reference Musa7]. In that study about one-third of the participants were aware of bird-to-man transmission of the avian virus and about two thirds were unaware of the existence of H5N1 infection. The knowledge and awareness of avian flu and the risk of infection is low and hygiene is an important element to control the disease [Reference Musa7]. Three distinct waves of the H5N1 epidemic in Nigeria were identified with peaks in January–March in the North West, North Central and North East and July–September in the South West and South South as well as disease clusters in the North West, North East and South West, respectively [Reference Ekong8]. A previous analysis using the methods for spatial point processes with altitude as the only covariate in making inferences about H5N1 outbreaks revealed a significant effect of altitude in estimating the pattern of H5N1 virus [Reference Adegboye9].
It is difficult to describe the mechanism underlying the H5N1 epidemic, and its origin, geographical, climatic and other factors that establish and influence the spread of the disease. Such difficulties can be a result of mismatch between data measured at different resolutions resulting in spatial misalignment [Reference Banerjee, Carlin and Gelfand10]. Spatial misalignment of the exposure and response variables can bias the estimation of health risk [Reference Peng and Bell11]. The first major aim of this study was to realign the weather stations with the locations of the infected farms. The locations of the outbreaks of H5N1 were not linked with the climate data measured at different weather stations. We considered the use of interpolation to estimate the weather data to provide a mean estimate for each infected farm. Moreover, possible association between H5N1 outbreaks and environmental factors such as altitude, temperature, wind and dew were investigated. The geographical constraints that may favour the outbreak of the disease were explored to understand the effect of distances between farms.
METHODS
Data source
The data for this study consists of the HPAI H5N1 outbreaks in 2006 that were reported to the World Organization for Animal Health (OIE) [3]. The information collected included the date of confirmation of infection (diagnosed), species, number of susceptible birds, number of infected birds and the locations of the infected farms (x,y coordinate system). The datasets can be found on the website of OIE [3]. Poultry farms (subsequently referred to as farms) in Nigeria are categorized as backyard flocks, which are normally comprised of a couple of dozen birds, and commercial poultry with up to hundreds of thousands of chickens. Figure 1 shows the locations of the infected farms which include cases from both commercial and backyard farms. The disease was either diagnosed using clinical signs or sent for a test at the national laboratory (National Veterinary Research Institute, Vom, Nigeria or the OIE's reference laboratory in Padova, Italy) [3]. A total of 145 diagnosed outbreaks were recorded; the first outbreak occurred on 10 January 2006 in Kaduna State, in the North-Western part of Nigeria. The virus spread to the central part of the country within weeks, and about 70% of the total reported outbreaks occurred between January and March, 2006 (Fig. 2).

Fig. 1 [colour online]. The locations of HPAI H5NI virus-infected farms (black stars) and weather stations (red triangles).

Fig. 2. Weekly number of cases of HPAI H5N1 since the beginning of the outbreak in Nigeria, January 2006.
The climatic data for the available weather stations (see Fig. 1 for location of the weather stations) in Nigeria in 2006 were extracted from the National Climatic Data Centre of the National Oceanic and Atmospheric Administration, US Department of Commerce. Daily weather data were collected from 48 weather stations across Nigeria; these data included the temperature (°C), dew point (°C), wind speed (knots), pressure (millibars) and elevation (metres).
Bayesian kriging
Misalignment is often encountered in spatial analysis, this occurs when sampling at different spatial scales are not linked. In our case, the outbreaks of H5N1 virus were not linked with the weather variables measured at different weather stations. One possible way to tackle this problem is through interpolation, a method of constructing new data points within the range of a discrete set of known data points.
Let s
i
; i = 1, 2, …, N, be the location of the infected farms and Z(s
l
); l = 1, 2, …, L, the weather variables measured at the weather stations. Usually, we would want to measure these weather variables Z(s
l
) at the location of the infected farms, which involves the use of interpolation [Reference Lawson12]. The spatial Gaussian process was assumed for the measured predictor and we constructed a conditional prediction of the predictors at the set location. The Gaussian process model was defined for the sets of weather stations, θ = (ψ, τ)′ as the parameter vector. Let Z
s
′=Z(s
1), …, Z(s
l
): Z(s
l
)|α, θ∼N(μ, Γ), where μ
sl
= (s
l
, α) is a predictor at the lth farm and Γ is the spatial covariance matrix. Often, μ
s
will consist of trend surface components and $\Gamma _{ll^'} = \tau \rho (s_l - s_{l'} ;\psi )$
(where τ is the variance and ρ(.) is a correlation function for the Z's at the separation distance
$\Gamma _{ll^'} = \tau \rho (s_l - s_{l'} ;\psi )$
(where τ is the variance and ρ(.) is a correlation function for the Z's at the separation distance $s_l - s_{l'} $
). Using the conventional geostatistics approach for interpolation, i.e. ‘kriging’, the covariance structure is estimated first, then the estimated covariance is used for interpolation. The exponential form was used for
$s_l - s_{l'} $
). Using the conventional geostatistics approach for interpolation, i.e. ‘kriging’, the covariance structure is estimated first, then the estimated covariance is used for interpolation. The exponential form was used for $\rho (s_l - s_{l'} ;\psi )$
given by:
$\rho (s_l - s_{l'} ;\psi )$
given by:
 $$\rho (s_l - s_{l'} ;\psi ) = \exp \{ - \psi ||s_l - s_{l'} ||\}, $$
where $||s_l - s_{l'} ||$
is the Euclidean distance between farm l and l′. The Matérn function was used to estimate
$||s_l - s_{l'} ||$
is the Euclidean distance between farm l and l′. The Matérn function was used to estimate $\gamma (h,\theta ),h = s_l - s_{l'} $
; given by
$\gamma (h,\theta ),h = s_l - s_{l'} $
; given by
 $$\gamma (h,\theta ) = \left\{ \begin{array}{ll}c_0 + c_h \left[ 1 - \displaystyle{1 \over {2^{\alpha - 1} \Gamma (\alpha )}}\left( \displaystyle{h \over {a_k}} \right)^{\alpha} K_{\alpha} \displaystyle{h \over {a_k}} \right], & {\rm if} \ h > 0, \\ 0, & {\rm if} \ h = 0. \end{array} \right.$$
where θ = (c 0, c k , ak, α); c 0⩾0, c k ⩾0, a k⩾0, α⩾0 and K α (.) is the modified Bessel function of the second order of α. Here, c 0 measures the nugget effect and c k is the partial sill (so c 0+c k is the sill). As in the stable family, the behaviour near the origin is determined by α, and the parameter a k controls the range. The behaviour of the semivariogram near the origin can be estimated from the data rather than assumed to be a certain form [Reference Waller and Gotway13].
Bayesian kriging analysis was adopted for predicting a new set of locations Z(s i ); i = 1, 2, …, N. The posterior predictive distribution of Z(s i ) given the observations Z(s l ) is
 $$f\,(Z(s_i )|Z(s_l )) =\! \int {f(Z(s_i )|Z(s_l ),\alpha, \theta ){\rm} \ f(\alpha, \theta |Z(s_l ){\rm} \partial \alpha \partial \theta}, $$
where f (α, θ | Z(s l )) is the posterior of the model parameters.
The Matérn function [equation (2)] was implemented in geoR and the Bayesian analysis was implemented using the function krige.bayes [Reference Ribeiro and Diggle14].
Modelling H5N1 intensity
The variations of the disease intensity were measured by the inhomogeneous K function. In general, the intensity of a point process varies from place to place and the intensity function assumes that the expected number of points falls in a small area du around a location u
i
that satisfies E[N(X∩B)] = ∫
B
λ(u)du. The inhomogeneous K function stipulates that if λ(u) is the true intensity function of the point process X, then each point x
i
will be weighted by $w_i = \displaystyle{1 / {\lambda (u)}}$
:
$w_i = \displaystyle{1 / {\lambda (u)}}$
:
 $$K_{in{\rm hom}} (r)\! = \! E\left[ {\displaystyle{1 \over {\lambda (u)}}\sum\limits_{x_i \in X} {\displaystyle{1 \over {\lambda (x_i )}}} 1\{ 0 \! < \! ||u - x_j || \! \leqslant \! r\} {\rm} u \! \in \! X} \right],$$
The space–time cluster interaction was measured at both the spatial and temporal scale using
 $$K = \displaystyle{{LR} \over {n_i n_j}} \sum {\sum {\displaystyle{{I_{h,t} (d_{ij} )} \over {w_{ij}}}}}, $$
where n i and n j are the numbers of observations within distance h and time interval t for the pair of events, respectively.
The spatial point process model was fitted to the data in which the point pattern is dependent on spatial covariates such as geographical location, week of infection, elevation, temperature, dew point and wind. The conditional intensity, presences per unit area [Reference Cressie15], expressed as a log-linear function of the covariates is
 $$\lambda (u) = \exp \{ B \kern .5pt\prime Z(u)\}, $$
where β is a vector parameter and Z covariates at location u.
Akaike's Information Criterion (AIC) [Reference Burnham and Anderson16] was used to evaluate the ‘goodness of fit’ of each model. All data analyses were performed and implemented in R [17].
Habitat suitability analysis (HSA)
A HSA provides a way of modelling the relationship between species and habitat characteristics. The Habitat suitability index (HSI) describes the suitability of a given habitat by combining the interactions of all key environmental variables on a species’ population characteristics and ultimately, survival [18]. Although the HSA is popular with species modelling, it is a growing area in spatial analysis of disease epidemiology that characterizes the distribution of the disease in a space defined by environmental parameters. The model can be constructed in several ways such as ecological niche analysis (ENA) which involves the use of geography and ecology of disease transmission [Reference Peterson19] with the aim of determining the distribution of the species using the location where the species has been found [Reference Fischer, Thomas and Beierkuhnlein20]. The idea is to use the observed presence (and absence) data together with ecological variables at those sites to provide a reasonable likelihood of the species being present [Reference Fischer, Thomas and Beierkuhnlein20]. Hirzel et al. [Reference Hirzel21] proposed ecological niche factor analysis (ENFA), a multivariate approach to study the geography of species distribution which does not require absence data. ENFA computes the suitability function by computing the species’ distribution in the eco-geography variable space with that of the whole set of cells [Reference Arnese22]. In this study, ENFA was used to compute the suitability function and produce the habitat suitability map for H5N1, where the HSI values range from 0% to 100%. HSI values close to 100% indicate an area where a species will flourish and values close to 0 imply an area where the species will not do very well. ENFA was performed using the ‘enfa’ function implemented in R [Reference Basille23].
RESULTS
A high percentage of the outbreaks occurred in the Plateau State (29·7%) followed by Kaduna State (12·4%), Kano (11·7%) and Bauchi (11·7%) (Table 1, Fig. 3). Preliminary exploratory analysis showed an increase in the incidence of H5N1 virus at farms located at high altitude.

Fig. 3. Cases of HPAI H5N1 virus outbreak in Nigeria in 2006.
Table 1. Percentage of HPAI H5N1 outbreaks in the five most affected states in Nigeria in 2006 and the duration of the outbreak

* Percentage of all cases; 28·3% of cases in Nigeria occurred in other regions.
† Number of days from the first reported case to the last reported case.
Estimating weather variables
A total of 48 weather stations across Nigeria were used for the interpolation of the weather data in this study. The location of the weather stations (black stars) and the infected farms (red triangles) are depicted in Figure 1. The occurrence of H5N1 has been described to take place [Reference Ekong8], with the suspicion of seasonal effects on the outbreaks (Fig. 2). This influence may be explained by some climatic variables and the disease epidemiology can be explored using ecological data. The weather stations were misaligned with the location of infected farms. The first task was to realign the weather stations. Interpolation was used to estimate the mean weather variables (temperature, wind, dew) for the infected farms (Fig. 4). Daily data were not available for some weather stations and thus weekly average weather predictions were used.

Fig. 4. Box plots of the predicted weather variables.
Different parametric models were fitted to the empirical semivariogram estimated to the data and the best fit model (Matérn) was chosen by varying the parameters. The estimated Bayesian variograms were checked against the empirical variogram by plotting the posterior distribution means, medians and modes. Histograms of the posterior distribution for the model parameters indicated a good fit of the Bayesian kriging prediction of the weather variables for the locations of infected farms (data not shown).
H5N1 risk factors
The spatial Kolmogorov–Smirnov test for complete spatial randomness rejects the null hypothesis of constant intensity with P < 0·0001. This implies that the locations of outbreaks are dependent on each other and that propensity varies from location to location (inhomogeneous). The inhomogeneous K-function plot shows that estimates of K(r) using different techniques are roughly the same (Fig. 5). This suggests that H5N1 outbreaks appear to be clustered after accounting for temperature, elevation, dew, wind and distance from the first outbreak. These covariates were used to fit a full inhomogeneous Poisson process intensity model. Using the method of backward elimination, the model with temperature, wind and distance was found to best fit the data and to be suitable for predicting the intensity of a H5N1 outbreak with an AIC of −103·87.

Fig. 5 [colour online]. K-inhomogeneous functions using different edge corrections: theoretical Poisson, border-corrected estimate, translation-corrected estimate, and Ripley's isotropic correction estimate.
Results from the Poisson point process model with a 1 km × 1 km regular grid of quadrature points showed a negative effect of temperature and distance. This suggests that for a unit increase in temperature and distance from the first outbreak, the intensity of the transmission (number of outbreaks per unit area) of a H5N1 outbreak decreases by 0·9601 and 0·9175, respectively. The result shows that an increase in wind speed will increase the conditional intensity of the disease outbreak. Moreover, the negative effect of distance on the intensity of the transmission implied that an increase in the distance results in a decrease in the intensity of the transmission of the virus. Figure 6 presents the intensity of the transmission of H5N1 virus using the Poission process model; the fitted model exhibits similar patterns in the transmission of the virus as the observed H5N1 outbreak. The intensity of the transmission (indicated by different colours in Fig. 6) suggest that most of the infected farms are located in the North Central region of Nigeria and occurred within a short time frame. The habitat suitability map for the disease is presented in Figure 7; higher HSI values were observed around the northern part of the country (60–100%); this implies that the H5N1 virus is favoured by the climatic condition in the North Central region of Nigeria and areas in close proximity to the first outbreak.

Fig. 6 [colour online]. HPAI H5N1 risk map from Poisson point process model with log-linear intensity. The intensity of the transmission of the virus (i.e. the number of outbreaks per unit area) is indicated by different colours with values ranging from 0 to 8.
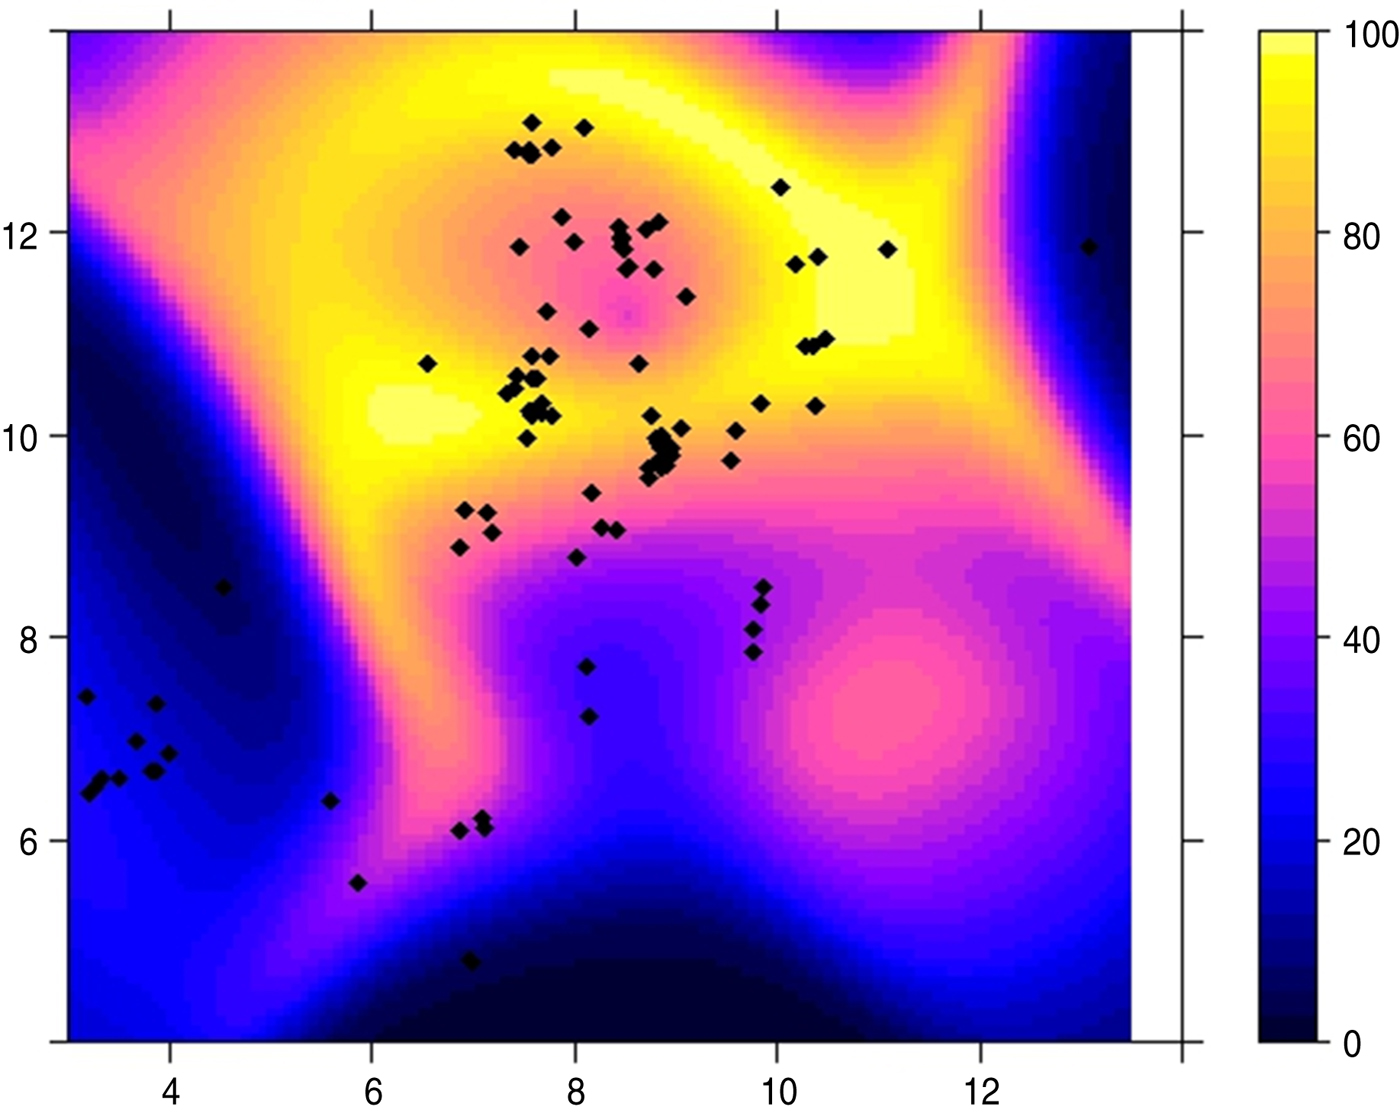
Fig. 7 [colour online]. Habitat suitability index (0–100%) for HPAI H5N1 virus outbreak in Nigeria using the predicted weather data as environmental covariates.
DISCUSSION AND CONCLUSION
It is difficult to describe the mechanism underlying the H5N1 epidemic, its origin, and the geographical, climatic and other factors that establish and influence the spread of disease. Information on the spread of infectious diseases is crucial for control and surveillance initiative programmes. The role played by weather variables in the transmission and spread of HPAI should not be overlooked. The H5N1 virus was found to be a result of regional influx of wild birds [Reference Fasina4], migratory waterfowl [Reference Hanson24, Reference Krauss25], trade routes [Reference Gilbert26] and also the effect of transportation of farm staff and poultry products [Reference Fasina6, Reference Oyana, Dai and Scott27]. Our results showed that the spread and transmission of HPAI H5N1 is favoured by some weather variables and areas in close proximity to the first outbreak.
The movement of people, equipment and animals within infected farms may contribute to the spread of the pathogen. Airborne transmission of the pathogen may also occur through dust and feathers. This method of transmission has been previously studied [Reference Spekreijse28–Reference Mikkelsen31]; these studies attest to our findings suggesting that there is a relationship between the intensity of the disease in a given region and, wind speed and temperature. The contribution of wind in the transmission of the pathogens has been described as occurring only in short distances and the extent may be relatively small [Reference Ssematimba, Hagenaars and de Jong30, Reference Mikkelsen31]. Although the effect of biosecurity has been discussed in another paper [Reference Musa7], temperature and wind may induce dryness of the environment which may in turn make it easier for the virus to be transmitted between birds. Moreover, the effect of alternating temperature highs and lows may imply seasonality that could alter the transmission and survivability of the virus, which is consistent with the temporal patterns observed by Ekong et al. [Reference Ekong8]. These authors suggest that the outbreak occurred in different waves. Brown & Rohani [Reference Brown and Rohani32] have studied the effect of alteration between migratory shorebird and horseshoe crabs as a result of climate change. Vandegrift et al. also reviewed how anthropogenic change may alter the evolution and transmission of influenza viruses [Reference Vandegrift33]. The initial outbreak of the disease in Nigeria was attributed to the movement of migratory birds [Reference Fasina34]; this supports our findings of wind as a risk factor because the wind speed and direction may also affect the path of migratory birds thereby altering the spread of the virus.
This study provides empirical analysis of how spatial models can be used to capture the intensity and mechanism of the spread of H5N1 virus with misaligned weather data. The application of the Bayesian kriging method to predict weather variables in a misaligned dataset was demonstrated. These techniques were applied to the HPAI H5N1 virus outbreak in Nigeria in 2006. The spatial Poisson process intensity fitted as a log-linear function has shown that intensity combined with temperature, wind and distance from the first outbreak provides a better estimate. A HSA was conducted using ecological niche modelling on the point process and the predicted weather data, to explore the habitat suitability of H5N1 and to predict the geographical distribution of the disease outbreak.
The major limitation of this study lies in the data gathering and risk factors. The data on HPAI H5N1 virus were only extracted from the OIE database and cases of underreporting cannot be ruled out. Moreover, Nigeria is a very large country with very poor data acquisition and the lack of e-data sources may affect timely reporting of disease occurrence. It would be interesting to be able to have additional variables linked to the location of events (e.g. those that address biosecurity, farm characteristics, and measure virus dispersion). This study only considered the ecological aspect of disease transmission due to availability of data. Furthermore, we could not assess the extent (distance) of the contribution of the wind in the transmission of HPAI based on limited data. In spite of these limitations, OIE provides very reliable and considerable data that yielded extensive information crucial for HPAI analysis in Nigeria. The analysis based on these data offers the opportunity to detect whether environmental and ecological variables are potential risk factors for the mapping of suitable habitats.
Our analysis using point process modelling also showed that geographical heterogeneity and seasonal effects are very important components of the spread and transmission of HPAI H5N1. The study calls for adequate surveillance and quick quarantine of infected farms in close proximity to the first outbreak. Further studies could incorporate and utilize the wind direction and dust dispersion (as proxy for airborne dispersion of the virus), farm population density and biosecurity in determining the pattern and mechanism of the spread of disease.
ACKNOWLEDGEMENTS
We are grateful to Olalekan Adetunji for technical help on Bayesian kriging. The authors express their profound gratitude to the reviewer for helpful comments and constructive criticism.
DECLARATION OF INTEREST
None.


