


The US Constitution provides a great deal of power to the states. Consequently, much of the way we live our day-to-day lives is dictated by state and local policy. States develop and enforce criminal codes, regulate the family via marriage and divorce laws, outline the requirements for professional licenses, regulate private property, create and enforce gun laws, have the ability to expand or contract voting rights, develop policies around education, dictate health policy, and determine how some federally funded social safety resources are allocated. As Sandefur and Smyth (Reference Sandefur and Smyth.2011) explain, “Geography is destiny: the services available to people from eligible populations … are determined not by what their problems are or the kinds of services they may need, but rather by where they happen to live.”
Many factors are likely to shape policy innovation and outcomes at the state level, such as the partisan and ideological leanings of policy makers in state legislatures, but considering that the United States is a democracy, one typically has the expectation that the public’s opinion will, to some extent, inform policy (Erikson, Wright, and McIver Reference Erikson, Wright and McIver1993; Key Jr. Reference Key1964; Lax and Phillips Reference Lax and Phillips2009). One of the most important factors shaping American public opinion, especially on racialized issues, is its population’s racial sentiments. Scholars have emphasized that policy experiments on the state level can either exacerbate or reduce racial inequality (Michener Reference Michener2018; Soss, Fording, and Schram Reference Soss, Fording and Schram2008); in turn, the public’s attitudes may influence the shape of inequity.
Given the prevalence of research showing that racial attitudes are a core component of the way Americans’ policy attitudes are shaped and also that state-level policies dictate levels of inequality in American society, we find it perplexing that scholars have not leveraged the vast quantity of data on Americans’ racial sentiments to develop subnational measures of contemporary racial attitudes.Footnote 1 Indeed, scholars who study politics and policy at the state level recognize that state political culture ought to be accounted for in their analyses; often they rely on distant proxies for White Americans’ racial attitudes—such as the proportion of people of color in a state or locality to ascertain “racial threat”—or rely on indicator variables for “region,” with the implied assumption that the South is unique in its translation of racial animus into racially discriminatory policy preferences/outputs. Here, we introduce data that fill this lacuna and address questions related to change in subnational levels of racial resentment.
The vast majority of policy makers in a federalist, democratic governance system are ostensibly influenced by aggregate state and local public stances and views about groups on various issues (Kreitzer and Smith Reference Kreitzer and Smith.2018; Schneider and Ingram Reference Schneider and Ingram1993). The data we provide here allow us to answer some basic but fundamentally critical questions. Do states exhibit similar levels of anti-Black racial animus? Do subnational levels of racial resentment fluctuate over time? Can we find evidence of America’s national redemption narrative, one of linear, monotonic progress (Theoharis Reference Theoharis2018) in any of the 50 US states? To begin to answer these questions, we use multilevel regression and poststratification (MRP) to create time-varying, state-level estimates of racial attitudes. Specifically, we develop dynamic measures of subnational racial attitudes and provide state-level measurements and comparisons on one of the most predictive sentiments in American politics: racial resentment.
This article makes several important contributions to the study of race and American politics. First, it provides a tool for scholars who focus on state-level politics and policy; the measures we develop can be used to assess the link between racial attitudes of state constituents, policy responsiveness, outcomes, and feedback. Second and relatedly, it assesses our assumptions about state and regional differences in levels of racial animus. By linking nationally representative survey data with US Census data, we are able to analyze trends in racial attitudes at the state level, and we do so across the entire country. As such, we build on the scholarship that has focused on regional specificities of racial animosity (Acharya, Blackwell, and Sen Reference Acharya, Blackwell and Sen2016; Key Jr. Reference Key1949). Third, this article is one of only a few that analyzes racial resentment over time; despite the fact that the racial resentment scale has been part and parcel of political scientists’ analytical toolkit for decades, we have had difficulty finding studies that take a retrospective view of changes and trends in modern forms of symbolic racial attitudes. Finally, this article adds to the growing literature that takes seriously the idea that people of color may also harbor what are commonly considered “racist attitudes”; consequently, it claims that people of color ought to be considered in the broader literature on the shape and effect of racial attitudes in the United States. We thoughtfully incorporate nonwhites into an analysis of the dynamics of racial sentiment at the state level over a 30-year period.
Racial Attitudes in the United States over Time
Given the centrality of race in American society, scholars have worked diligently to answer this singular question for well over 75 years: How much does race matter in American politics? There is overwhelming support for the notion that “race” systematically shapes Americans’ access to benefits and vulnerability to disadvantage and, further, that racism has historically been an important structural component of American economic, political, and social apparatuses (Bonilla-Silva Reference Bonilla-Silva2017; Omi and Winant Reference Omi and Winant1994). Perhaps the more contentious question is this: To what extent have Americans’ racial attitudes changed over time in nature, level, and effect?
In an influential text, Schuman and his colleagues (1997) reveal that overt, Jim Crow racism has decreased significantly since the 1940s. At the time of their study, very few Americans reported that they believe that Blacks are inherently inferior to Whites, that they would not want a Black neighbor, or believe that racial egalitarianism is not something worth working toward. Although levels of “old-fashioned” racism have declined precipitously over the past several decades, other scholars have provided a great deal of evidence that the structure (or logic) of contemporary racial attitudes has evolved since the end of the civil rights era, thus reproducing racial inequality over time (Bonilla-Silva Reference Bonilla-Silva2017; DeSante and Smith forthcoming; Mayorga-Gallo Reference Mayorga-Gallo2019).
Many scholars have proposed that Americans’ racial attitudes can best be understood in terms of newer, subtler forms of racism and have developed theories and measures to capture a more elusive form of racism, such as laissez-faire racism (Bobo, Kluegel, and Smith Reference Bobo, Kluegel, Smith, Tuch and Martin1997), racial resentment (Kinder and Sanders Reference Kinder and Sanders1996), and color-blind racism (Bonilla-Silva Reference Bonilla-Silva2017). The theory and measurement of racial resentment have become central to political science scholarship that focuses on (Whites’) racial attitudes. Racial resentment is rooted in a reservoir of anti-Black sentiment coupled with the belief that, because the civil rights movement ostensibly leveled the racial playing field, contemporary racial inequality—especially between Black and White Americans—can best be explained by the idea that “Blacks violate such traditional American values as individualism and self-reliance, the work ethic, obedience, and discipline” (Kinder and Sears Reference Kinder and Sears1981, 416). Recently scholars have shown that both White and Black Americans who score high on the racial resentment scale tend to explain ongoing racial inequality in terms of individual behavior, whereas those on the scale’s lower end focus on structural inequalities (Kam and Burge Reference Kam and Burge2018).
Although some critique the meaning and measure of racial resentment (e.g., Reference DeSante and SmithDesante and Smith forthcoming; Kluegel and Bobo Reference Kluegel, Bobo, Sniderman, Tetlock and Carmines1993; Sniderman, Crosby, and Howell Reference Sniderman, Crosby, Howell, Sears, Sidanius and Bobo2000), the principal creators of this measure provide evidence for its validity and have shown that the construct is a coherent belief system that is independent of old-fashioned racism and political conservatism (Henry and Sears Reference Henry and Sears2002). An ever-growing number of studies show that racial resentment influences White Americans’ attitudes on a wide range of political and policy preferences, including the death penalty (Unnever and Cullen Reference Unnever and Cullen2007), social welfare policies (Kinder and Mendelberg Reference Kinder, Mendelberg., Sears, Sidanius and Bobo2000), affirmative action (Bobo Reference Bobo, Sears, Sidanius and Bobo2000), vote choice (Kinder and Sears Reference Kinder and Sears1981; Tesler and Sears Reference Tesler and Sears2010), and who is deserving of the government’s help (DeSante Reference DeSante2013).
Racial attitudes tend to evolve in the face of major social, demographic, political, and economic shifts in society (Bonilla-Silva and Lewis Reference Bonilla-Silva, Lewis and Wong1999). There have been massive changes in the United States since the racial resentment scale was incorporated into the American National Election Studies (ANES) in 1988, but as we show, national aggregate levels of racial resentment seem impervious to the past three decades of change. To be sure, the few scholars who have examined national trends over time provide evidence that racial resentment has become more virulent in effect (Enders and Scott Reference Enders and Scott2018) and has “spilled over” to affect nonracialized policy preferences such as health care (Tesler Reference Tesler2012; Yadon and Piston Reference Yadon and Piston2018), but overall, levels of racial resentment among (White) Americans has largely remained stable in level since the mid-1980s.
We suspect, however, that data aggregated at the national level belie the dynamics that occur at the subnational level and thus do not clearly represent the variation that exists in this country. In the past decade, for example, US states have been differentially exposed to the introduction of new, highly contested debates about matters such as excessive police force/violence, racial symbols such as Confederate monuments, and racial discrimination in the criminal justice system. Some states are “new destinations” for immigrant and refugee groups, and still others have experienced major economic downturns. There have also been substantial policy changes in areas that have racialized components (e.g., voting rights) at the state level; some states have made an effort to reduce inequity, whereas others have done just the opposite.
Our intuition is that assessments of national-level racial attitudes disregard the nuances that occur at the state level, and thus, we take a deeper, exploratory dive into state-level differences in racial attitudes to develop a more accurate portrait of American politics and policy. We expect to uncover heterogeneous trends in racial attitudes over time at the state level, and we hypothesize that trends of liberalizing racial attitudes will neither be ubiquitous nor even common across the states.
Racial Attitudes in the United States across Space
Research that ascertains the role of racial attitudes in American politics is unquestionably robust, but there are two matters that have yet to be addressed in a tidy or satisfactory way. As mentioned, a great deal of the extant literature focuses on analysis at the national level; this makes intuitive sense: it takes a nation to elect a president, and landmark legislation that influences the shape of racial inequality, such as the Voting Rights Act and the Violent Crime Control and Law Enforcement Act of 1994, comes out of Congress. Yet “all politics is local”: indeed, it is at the subnational level that Americans vote for Electoral College delegates, senators, and representatives, and state politics, as mentioned, plays a major role in shaping our everyday lives and the specific contours of local racial inequality. It behooves scholars to consider the notion that contemporary racial attitudes do influence American politics, and thus we ought to provide more accurate links between race and politics at the state level. The first issue, then, is that we need measures of state-level racial attitudes that are more nuanced than political scientists have typically relied on.
Scholars of American political development have made it clear that there exists several state and regional political cultures (Elazar Reference Elazar1966; Hero Reference Hero2000; Mellow Reference Mellow2008); still more research reveals that as federal resources and power devolve to the state and local levels, street-level bureaucrats sometimes work to maintain the local racial status quo (Katznelson Reference Katznelson2005; Rothstein Reference Rothstein2017). To be sure, some scholars use quantitative methodological strategies that recognize that racial attitudes may have a different relationship with important political and policy matters across space. Much of this work, however, stops at the regional level: it is often focused on Southern versus non-Southern regional differences and is frequently marked by a Southern “dummy” variable. Ultimately, extant research suggests that the racial attitudes of Southern Whites, especially those who have been socialized there, are more anti-Black than those in other regions (Valentino and Sears Reference Valentino and Sears2005). Key (1949, 5) noted that it is “the whites of the black belts who have the deepest and most immediate concern about the maintenance of white supremacy,” and new research provides evidence for a “historical persistence” thesis, whereby Whites who live in places with deep roots in chattel slavery still harbor animosity toward Blacks and policies designed to mitigate historical injustices (Acharya, Blackwell, and Sen Reference Acharya, Blackwell and Sen2016). Many social scientists, thus, are inclined to rely on a South dummy variable to give a nod to Southern exceptionalism, rather than use nuanced measures of state-specific racial animus.
A more refined measure of state racial sentiments would be helpful given that racially biased policies are implemented across localities and, furthermore, racial bigotry and inequality are not unique to the South. For instance, some of the most fervent fights over civil rights occurred in northern cities like Boston and New York (Theoharis Reference Theoharis2018). For decades and still even today, New York State and several other non-Southern states dominate the list of the 20 most racially segregated school systems (Reardon and Owens Reference Reardon and Owens.2014). Meanwhile, the racial disparity in prison populations between Blacks and Whites in Minnesota, Michigan, Iowa, and Vermont is around 12:1, compared to a rate hovering around 4:1 across many of the states that were in the Confederacy (Sentencing Project 2017). States’ reputations for racist attitudes do not necessarily align with the severity of racially biased policy outputs.
Still other scholars who have studied state-based and localized assessments of racially inequitable policy outcomes have operationalized Whites’ racial attitudes through an area’s population demographics, often with special attention to the proportion of Blacks (Fossett and Kiecolt Reference Fossett and Jill Kiecolt1989; Key Jr. Reference Key1949; Lewis et al. Reference Lewis, Provine, Varsanyi and Decker2012; Soss, Fording, and Schram Reference Soss, Fording and Schram2008). These scholars take us through the ostensibly logical steps rooted in a theory of “racial threat,” which asserts that increased numbers of Blacks, in particular, are likely to produce greater racial animus among Whites, and thus we ought to expect more racially conservative policy outputs (Blalock Reference Blalock1956; Blumer Reference Blumer1958; Key Jr. Reference Key1949; Taylor Reference Taylor1998). Scholars have found mixed evidence for the racial threat hypothesis. Taylor (Reference Taylor1998, 532) notes, “Causal links between region and racial concentration are too intricate for effects of these predictors on racial attitudes to be neatly disentangled in multivariate analysis.” Meanwhile, Giles (Reference Giles1977, 412) explains, “The black concentration generalization…assumes a relationship between an aggregate level variable, percent black, and an individual level variable, racial attitude.” Acharya, Blackwell, and Sen (Reference Acharya, Blackwell and Sen2016, 630) also find evidence to the contrary, noting that once they “account for slavery in 1860, contemporary black concentrations appear to have the opposite effect that racial threat theory would predict for Southern white attitudes.”
It could be the case that scholars tend to see a weak link between the proportion of Blacks in a locality and aggregate racial attitudes because the racial threat theory rests on assumptions that center the attitudes of White residents and excludes the agency and attitudes of people of color. Our second point of contention with the traditional literature that links Whites’ racial attitudes with racial policy preferences and outcomes is rooted in that exclusion: attitudes of people of color have largely been omitted from analyses of American racial politics. Indeed, one might expect that, in places where many people of color live, the aggregate racial animus may be lower because Blacks, Latinos, and Asian Americans register lower levels of racial resentment (Henry and Sears Reference Henry and Sears2002). Though American politics is marked by an asymmetry of power among racial groups, people of color must still be accounted for in our analyses. Undeniably, politics and policy are the outcomes of dialectic processes, whereby various groups—including people of color— contend and compete for influence; we can account for this by assessing the role and effect of all Americans’ racial sentiments.
The overt exclusion of people of color in the larger literature on the role and effect of racial attitudes also implies that people of color do not subscribe to dominant racial ideologies. On the contrary: although Blacks and other people of color may not exhibit the same levels of anti-Black sentiments, they are neither immune from relying on individual rather than structural explanations of racial inequality (Nunnally and Carter Reference Nunnally and Carter.2012; Smith Reference Smith2014) nor impervious to a reliance on the dominant racial logic of the time (Bonilla-Silva Reference Bonilla-Silva2017). Henry and Sears (Reference Henry and Sears2002) show that the racial resentment measure is reliable for Blacks, and Kam and Burge (2018) find that White and Black Americans relate to that measure’s four questions in similar ways; consequently, there is no theoretical reason to exclude people of color from research on racial animus.
By relying on a close reading of foundational and new texts, we feel that developing a measure of state-level racial attitudes by aggregating up from all of the individuals in a state is a sound move. Ultimately, this article will enhance our understanding of racial attitudes across the United States by developing and exploring dynamic measures of racial attitudes over time and across each of the 50 US states that test our expectations of heterogeneity across space and nonlinearity over time.
Data and Methods: The Creation of Subnational Estimates of Public Opinion Using MRP
The study of state attitudes requires a significant amount of data. Scholars have used methods such as disaggregation (Erikson, Wright, and McIver Reference Erikson, Wright and McIver1993, Reference Erikson, Wright, McIver and Cohen2006) or the connection of election results with elite behavior (Berry et al. Reference Berry, Ringquist, Forading, Hanson and Ethridge1998) to estimate concepts like subnational ideology. In simple terms, disaggregating data involves calculating the percentage of individuals with a particular opinion or attitude within a geographic area, such as a state or district. These approaches have led to the creation of subnational estimates of opinion on a variety of specific policies (Arceneaux Reference Arceneaux2001; Brace et al. Reference Brace, Arceneaux, Johnson and Ulbig2007; Erikson, Wright, and McIver Reference Erikson, Wright and McIver1993; Norrander Reference Norrander2001). However, it is not always feasible to use disaggregation to create measures of state attitudes. Disaggregation requires the amalgamation of a large number of survey respondents and can only be done when there are many public opinion polls with identical questions, when the research design is not based on cluster samples, and when there are sufficient respondents in low-population units.
Multilevel regression with poststratification weighting (MRP) is an approach to estimating public opinion that overcomes many of the problems with disaggregation.Footnote 2 It works by bringing together three pieces of information: census data, survey data containing a measure of the attitude one is interested in measuring, and data on state-level variables that may have an impact on those attitudes. Public opinion is modeled as a function of demographic characteristics and state-level variables, and the responses are weighted using frequencies of demographic types from the census. The method has been vigorously tested and validated across a range of data, and several groups of scholars have created useful sets of guidelines and cautions to those using MRP (Buttice and Highton Reference Buttice and Highton.2013; Lax and Phillips Reference Lax and Phillips2013).
To implement MRP, we collected public opinion survey data on racial resentment over time using the ANES and pooled that data into a single dataset. The ANES asked the standard four-question battery of the racial resentment scale in 1988, 1990, 1992, 1994, 2000, 2004, 2008, 2012, and 2016. We follow conventions established by both scholars of MRP and racial resentment in our treatment of these questions in our analysis.
Next, we use a multilevel linear regression model to predict the level of racial resentment using a series of demographic and state-level factors found in the extant MRP literature. These factors include individual measures of race (non-Hispanic white, non-Hispanic Black, and other), gender (male or female), age (18–29, 30–44, 45–64, or 65+), education (less than high school graduate, high school graduate, some college, or college graduate), and state of residence (all 50 states). We also include interaction terms for race and gender, as well as a state-level variable representing state ideology (Berry et al. Reference Berry, Ringquist, Forading, Hanson and Ethridge1998) and an indicator variable for the year of the survey. The results of the model are used to predict the level of racial resentment for each possible “type” of individual based on combinations of the demographic and geographic identifiers. By “type” we are referring to the 4,800 permutations of individuals (3 race groups x 2 genders x 4 age groups x 4 education groups x 50 states) that we are able to ascertain within the constraints of the US Census data.Footnote 3 Because we are interested in estimating racial resentment in the states over time, we use an approach to dynamic MRP that pools all of the survey data into one analysis and includes indicator variables for year; doing so produces a more efficient model with tighter standard errors than other commonly used strategies ( Franko Reference Franko2017; Gelman et al. Reference Gelman, Lax, Phillips, Gabry and Trangucci2018).
The results of the multilevel model reflect our expectations and the broad literature on predicting racial resentment (refer to Appendix B1). In brief, we find that age has a positive relationship with racial resentment, meaning that older people tend to be more racially resentful, and higher education is associated with lower racial resentment. Finally, we find that gender and race are significant predictors of racial resentment (men and White people are more likely to be racially resentful), as is an interaction of these two variables. The state-level ideology variable is also significant.
After estimating the multilevel linear regression model, we predict the level of racial resentment for each of the “types” of people using the full slate of independent variables in the model. We then weight these person types by the frequency of those person types by each state, incorporating this information from the US Census. By combining the predicted level of racial resentment for each “type” of person by how many of those “types” of people there are in each state, we are able to construct a measure of state-level racial resentment.
Results: The Geography of Racial Resentment
Unlike old-fashioned racism, which declined precipitously between the 1940s and the 1970s (Schuman et al. Reference Schuman, Steeh, Bobo and Krysan1997), national-level symbolic racial attitudes have largely remained stable in another, modern 30-year time span. Figure 1 shows that there was very little change in national aggregate levels of racial animus between 1988 and 2012, with an apparent drop in 2016.Footnote 4 When people across racial groups are included, the difference in levels of racial resentment from the Whites-only aggregate level of racial resentment is quite small.
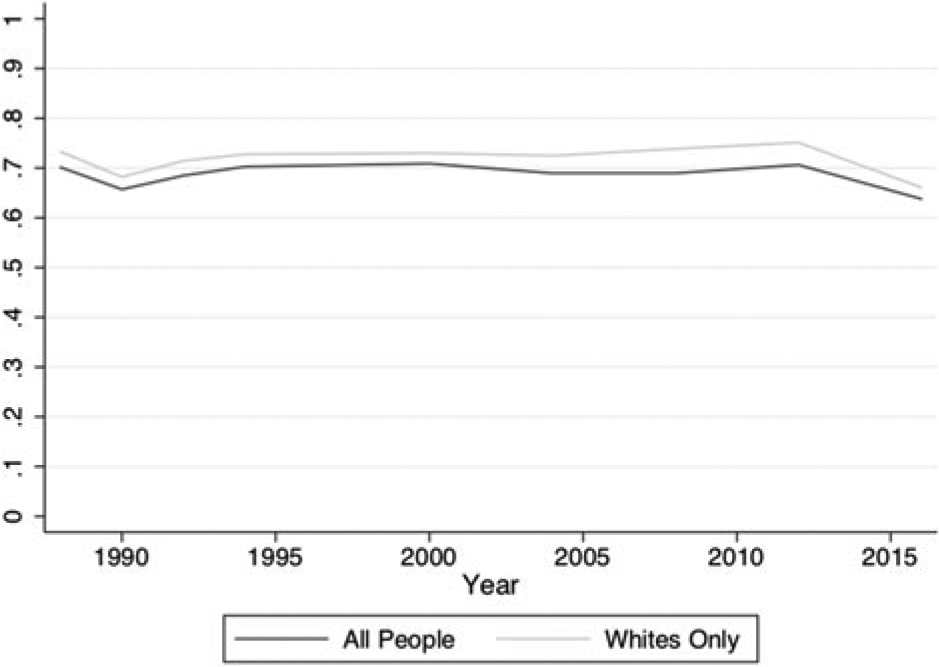
Figure 1 National Relative Racial Resentment, 1988–2016
As mentioned, we expect state-level racial attitudes to reveal different patterns of change over time in comparison to a national-level analysis, and Figure 2 provides evidence for this expectation. It shows state-level scores of racial resentment across three decades for a small sample of eight states that represent a range of trends.Footnote 5 Each state has its own unique trajectory. For instance, if we consider two states that have opposite reputations, we find counterintuitive trends: Mississippi’s aggregate levels of racial resentment decline over time, whereas Vermont, an ideologically liberal state, sees a slight uptick in racial resentment over time. Relatedly, Arizona and West Virginia start off with similar levels of racial resentment, but then diverge over time. Additionally, in 2006, California became a state where no racial group made up the majority, and Hawaii has never been a majority-White state; neither of these majority–minority states stand out as anti-racist signposts, and both trend alongside Utah, which in 2010 was around 89.2% white.
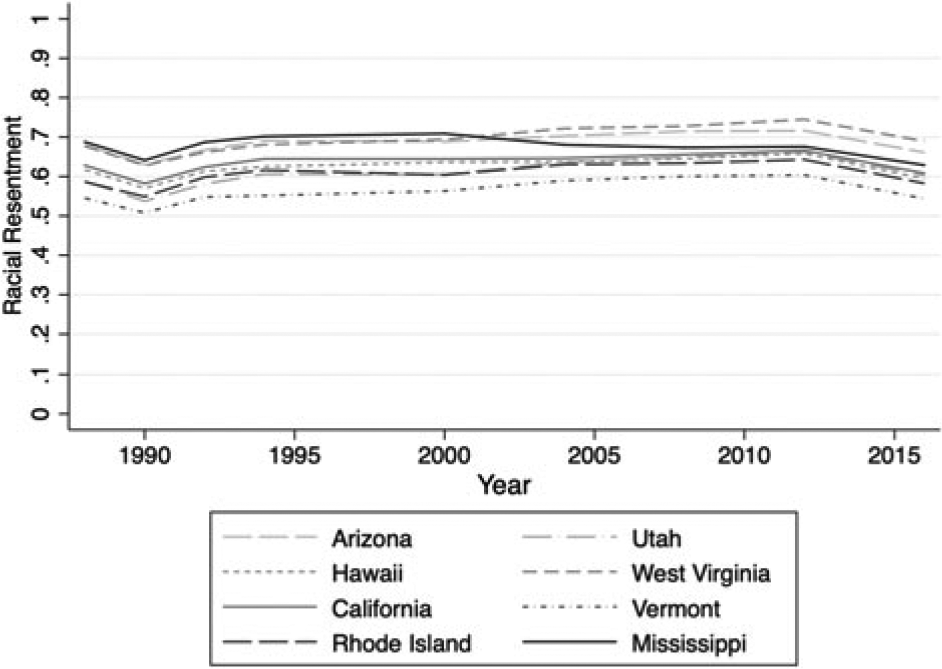
Figure 2 Sample of Eight States’ Racial Resentment, 1988–2016
We should also note that each state sees relatively slow change across time. Julianna Pacheco (2014, 990) notes that gradual but heterogeneous trends mean that certain attitudes are “fairly immune to short-term factors, but long-term factors serve to alter the relative ordering of the states”; these long-term but slow aggregate transformations “are caused by population changes that are also gradual, such as migration, immigration, generational replacement, differential birth, and death rates among different demographic segments of the population…or gradually changing cultural norms.” These changes are state specific.
Slow, heterogeneous changes in state levels of racial resentment may counteract each other in an aggregate national analysis, thus making the national level appear stable while altering the relative ordering of the states. In some ways, we are able to answer the evergreen question: Which state is the “most racist” this year? Figure 3 depicts the relative rankings of state “scores” for each of the nine years the ANES asked all four questions of the racial resentment battery. For ease, we divide scores into quintiles; lighter shades represent low levels of racial resentment, and darker shades represent high levels of racial resentment.Footnote 6
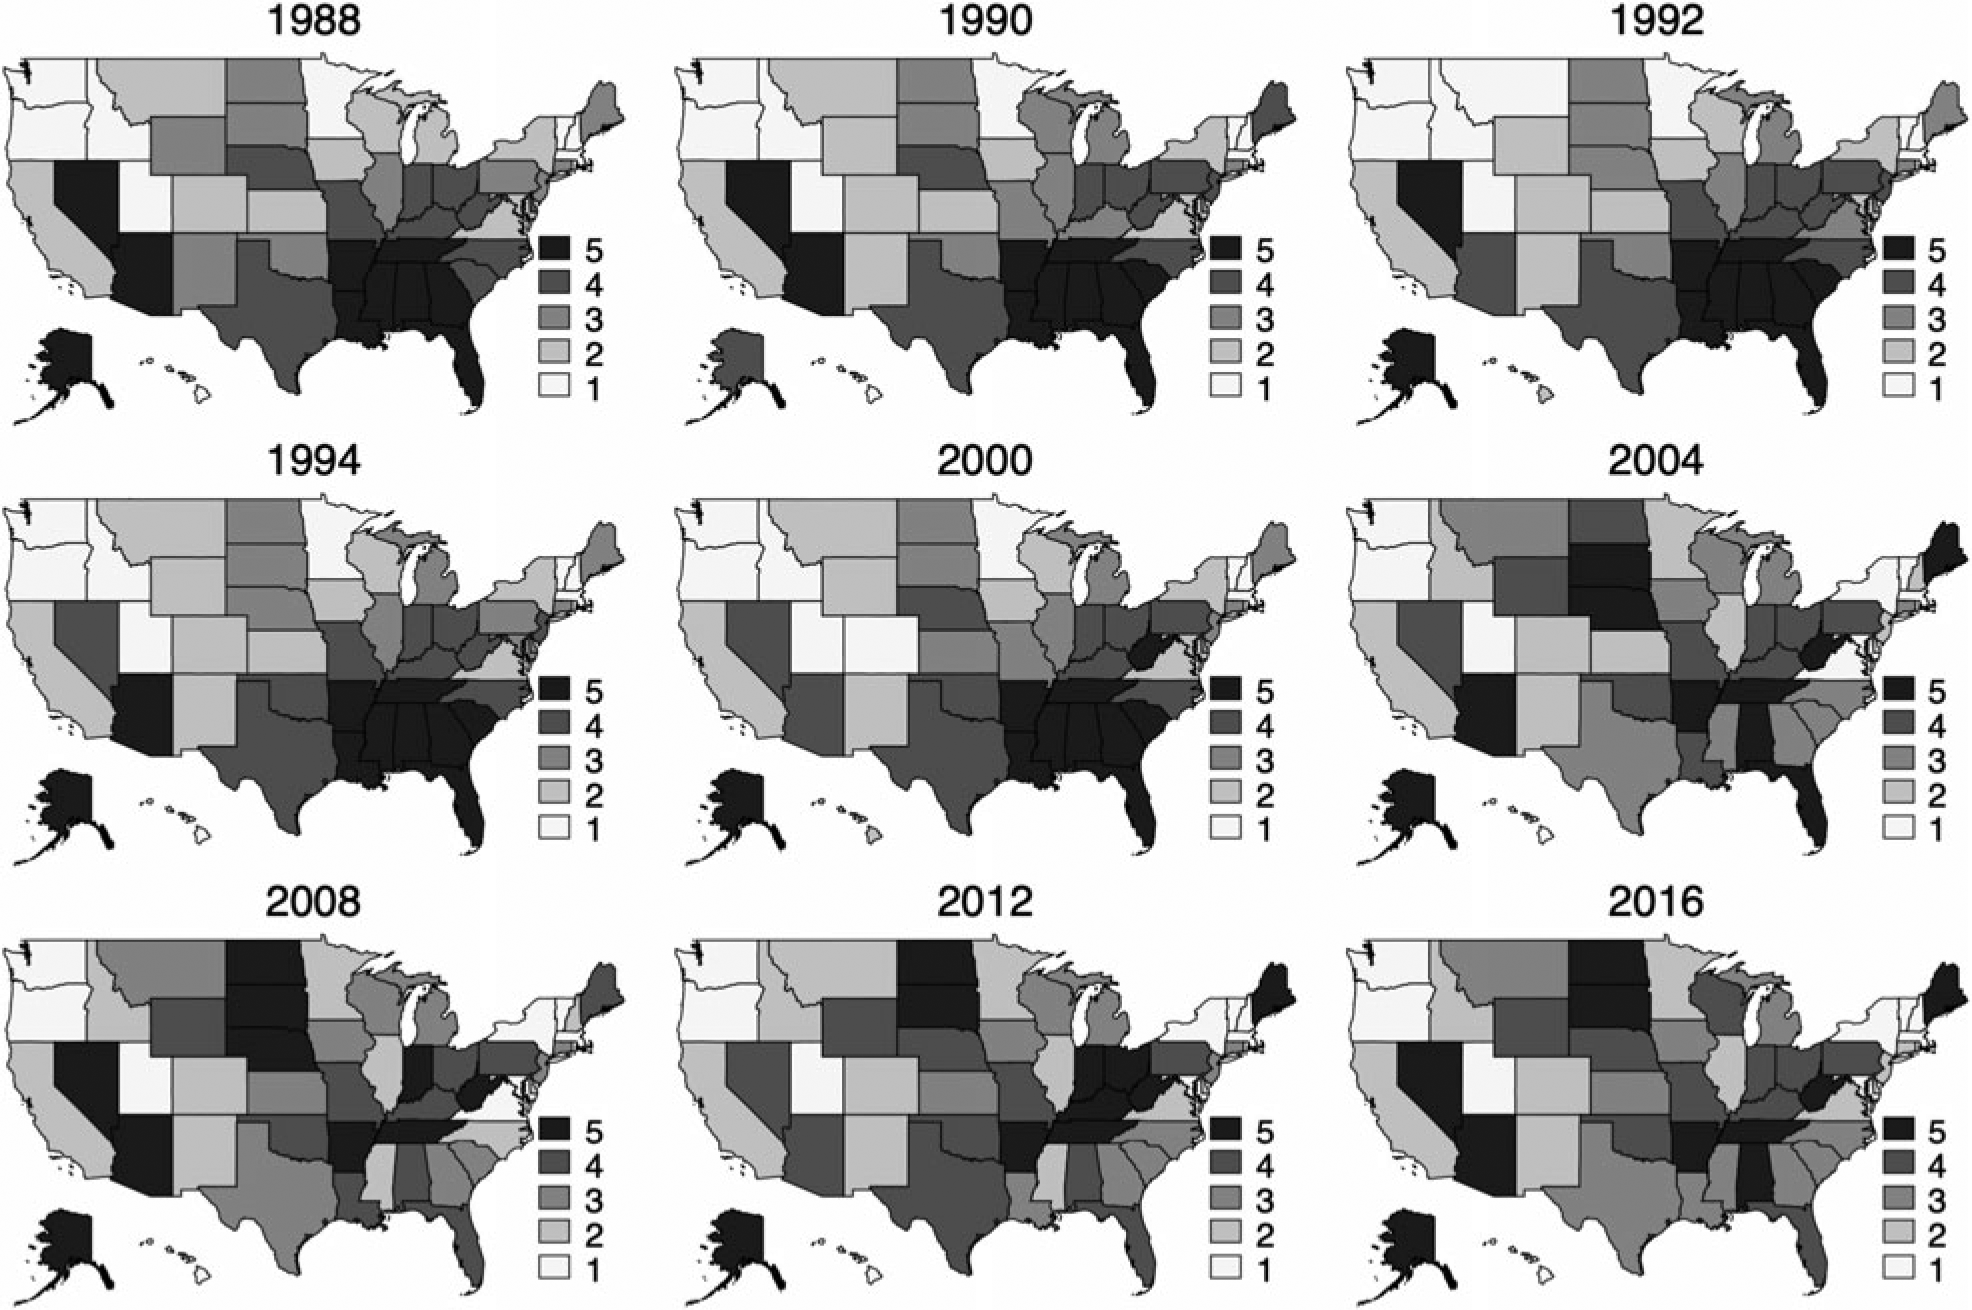
Figure 3 Annual Score of Racial Resentment in the States, 1988–2016
Figure 3 provides evidence for the conventional wisdom: Southern states have traditionally had the highest levels of racial animus in the country, denoted by the dark gray swaths that include Georgia, Alabama, Florida, Mississippi, Tennessee, Louisiana, Arkansas, and South Carolina between 1988 and 2000. Nevada and Arizona frequently rank high in racial resentment across this same period of time. West Virginia, alongside states like Pennsylvania, Indiana, Ohio, Missouri, and Texas vie for spots in the second-highest quintile across each time period. Figure 3, however, also shows that there is a clear dispersal of the darkest gray states after 2000. Here, we see that states like Maine, the Dakotas, and Arizona begin to compete for top spots among the most racially resentful states. Over the same period of time, most northeastern states, as well as the Pacific Coast states, maintain low rankings in each of the nine time periods. Here, we see a new configuration in the geography of racial resentment emerge.Footnote 7
To be clear, what this set of maps depicts is relative change in rank, not change in levels of racial resentment per se. The correlation of state scores over time is very high, ranging from .81 to .99. That means that Southern states, for example, can maintain their historical levels of racial resentment but be outranked by states whose state-level racial resentment slightly increases in the same period. We see that the relative rankings of state racial resentment are also high over time, though they are lower than the scores themselves. These scores range from .76 to .99, indicating that there is some, but not much, variability in the relative rank ordering of states’ racial resentment.Footnote 8
Results: Change over Time
The previous analysis examines racial resentment scores relative to each other at nine time points. Figure 4 provides a global portrait of all of the states’ level of racial resentment over a 30-year time period. It also shows that states’ trajectories vary substantially. Again, American popular culture and rhetoric assume a monotonic decline in racial animus over time (Nagourney Reference Nagourney2008), but the data reveal otherwise. For some states, their best times are behind them.
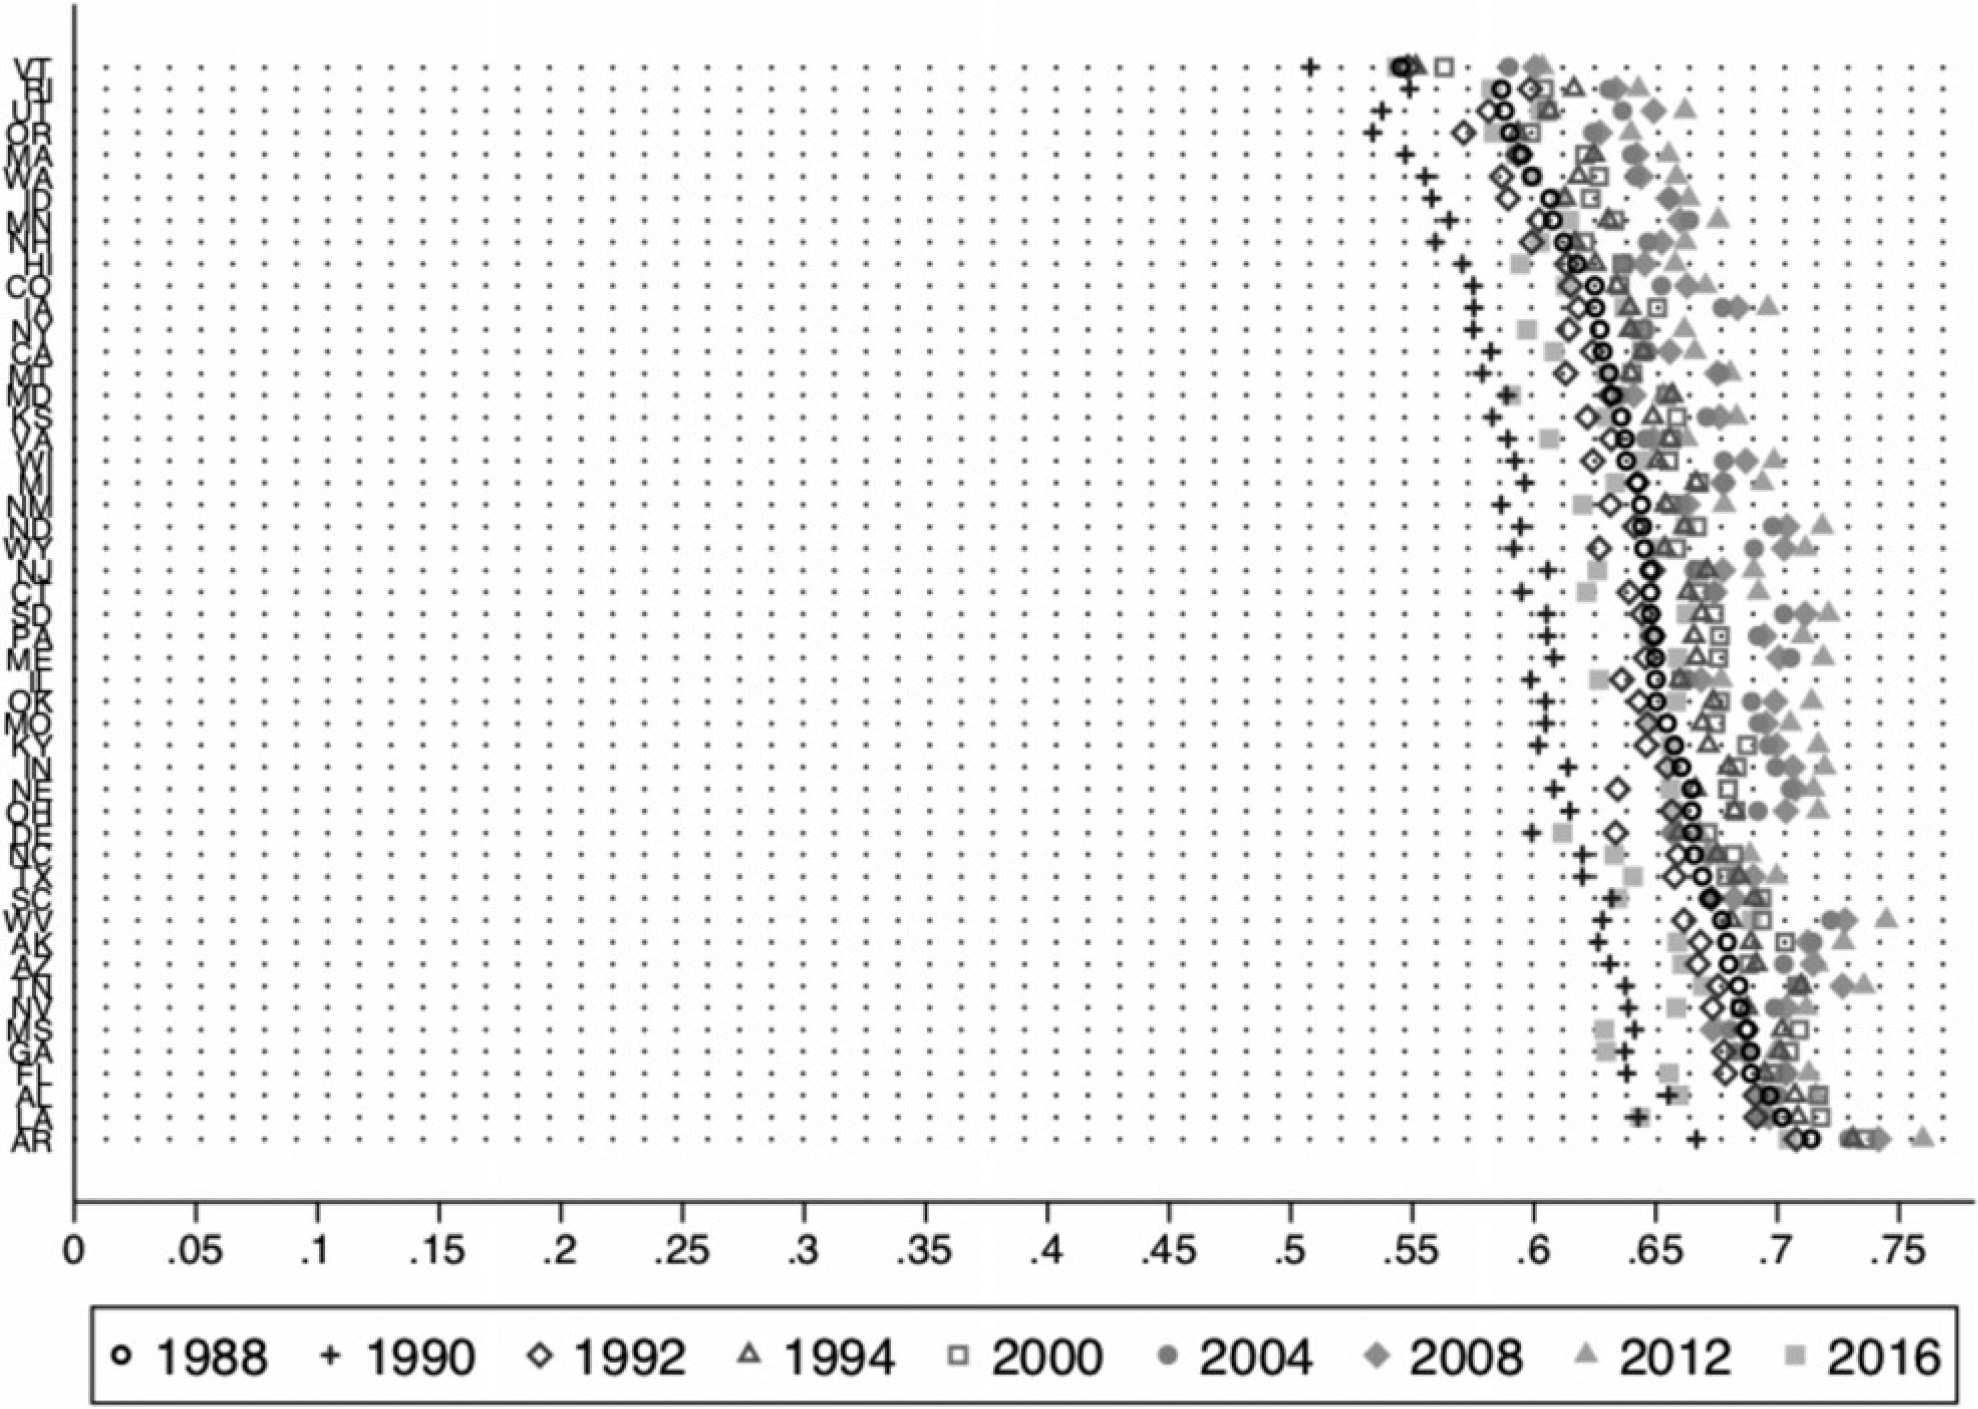
Figure 4 Changes in Estimated Racial Resentment over Time
In Figure 4, the hollow circles represent each state’s level of racial resentment in 1988, the first period for which we have data. Evidence for a national redemption narrative would be provided if each new year’s mark was farther to the left of 1988, but Figure 4 reveals that most states have markers to the left and right of their 1988 data point. Thus, there are times when states’ level of racial resentment is greater in later years than it was in 1988, and there are other times when racial resentment is lower than the 1988 levels.Footnote 9
A glance vertically provides comparisons across state and time, revealing some counterintuitive findings. For instance, Arkansas, the most racially resentful state in 1988, was at its most racially liberal in 1990, averaging about 0.7 (on a 0–1 scale); this score was reached in Wisconsin’s most conservative year, which occurred in 2012. Or, as another point of reference, Vermont has been the least racially resentful state over several years. Its most conservative score (0.6 in 2012) is also Kansas’s most liberal score, which occurred 29 years ago, in 1990. Taken together, we see that racial attitudes have not improved in a linear trend, but instead there is some back-and-forth movement in levels of racial resentment across states and across time. Overall, this analysis reveals that trends in states’ levels of racial animus are not consistently declining over time.
We provide another way to look at the data in Figure 5. Specifically, to create Figure 5 we treat each state-year as its own data point (50 x 9 time periods = 450 data points). We line them up from least to most racially resentful and then split them into quintiles. Thus Figure 5 illustrates the change in racial resentment over time. By showing changes in racial resentment at the state level, we get a different portrait of the national mood.
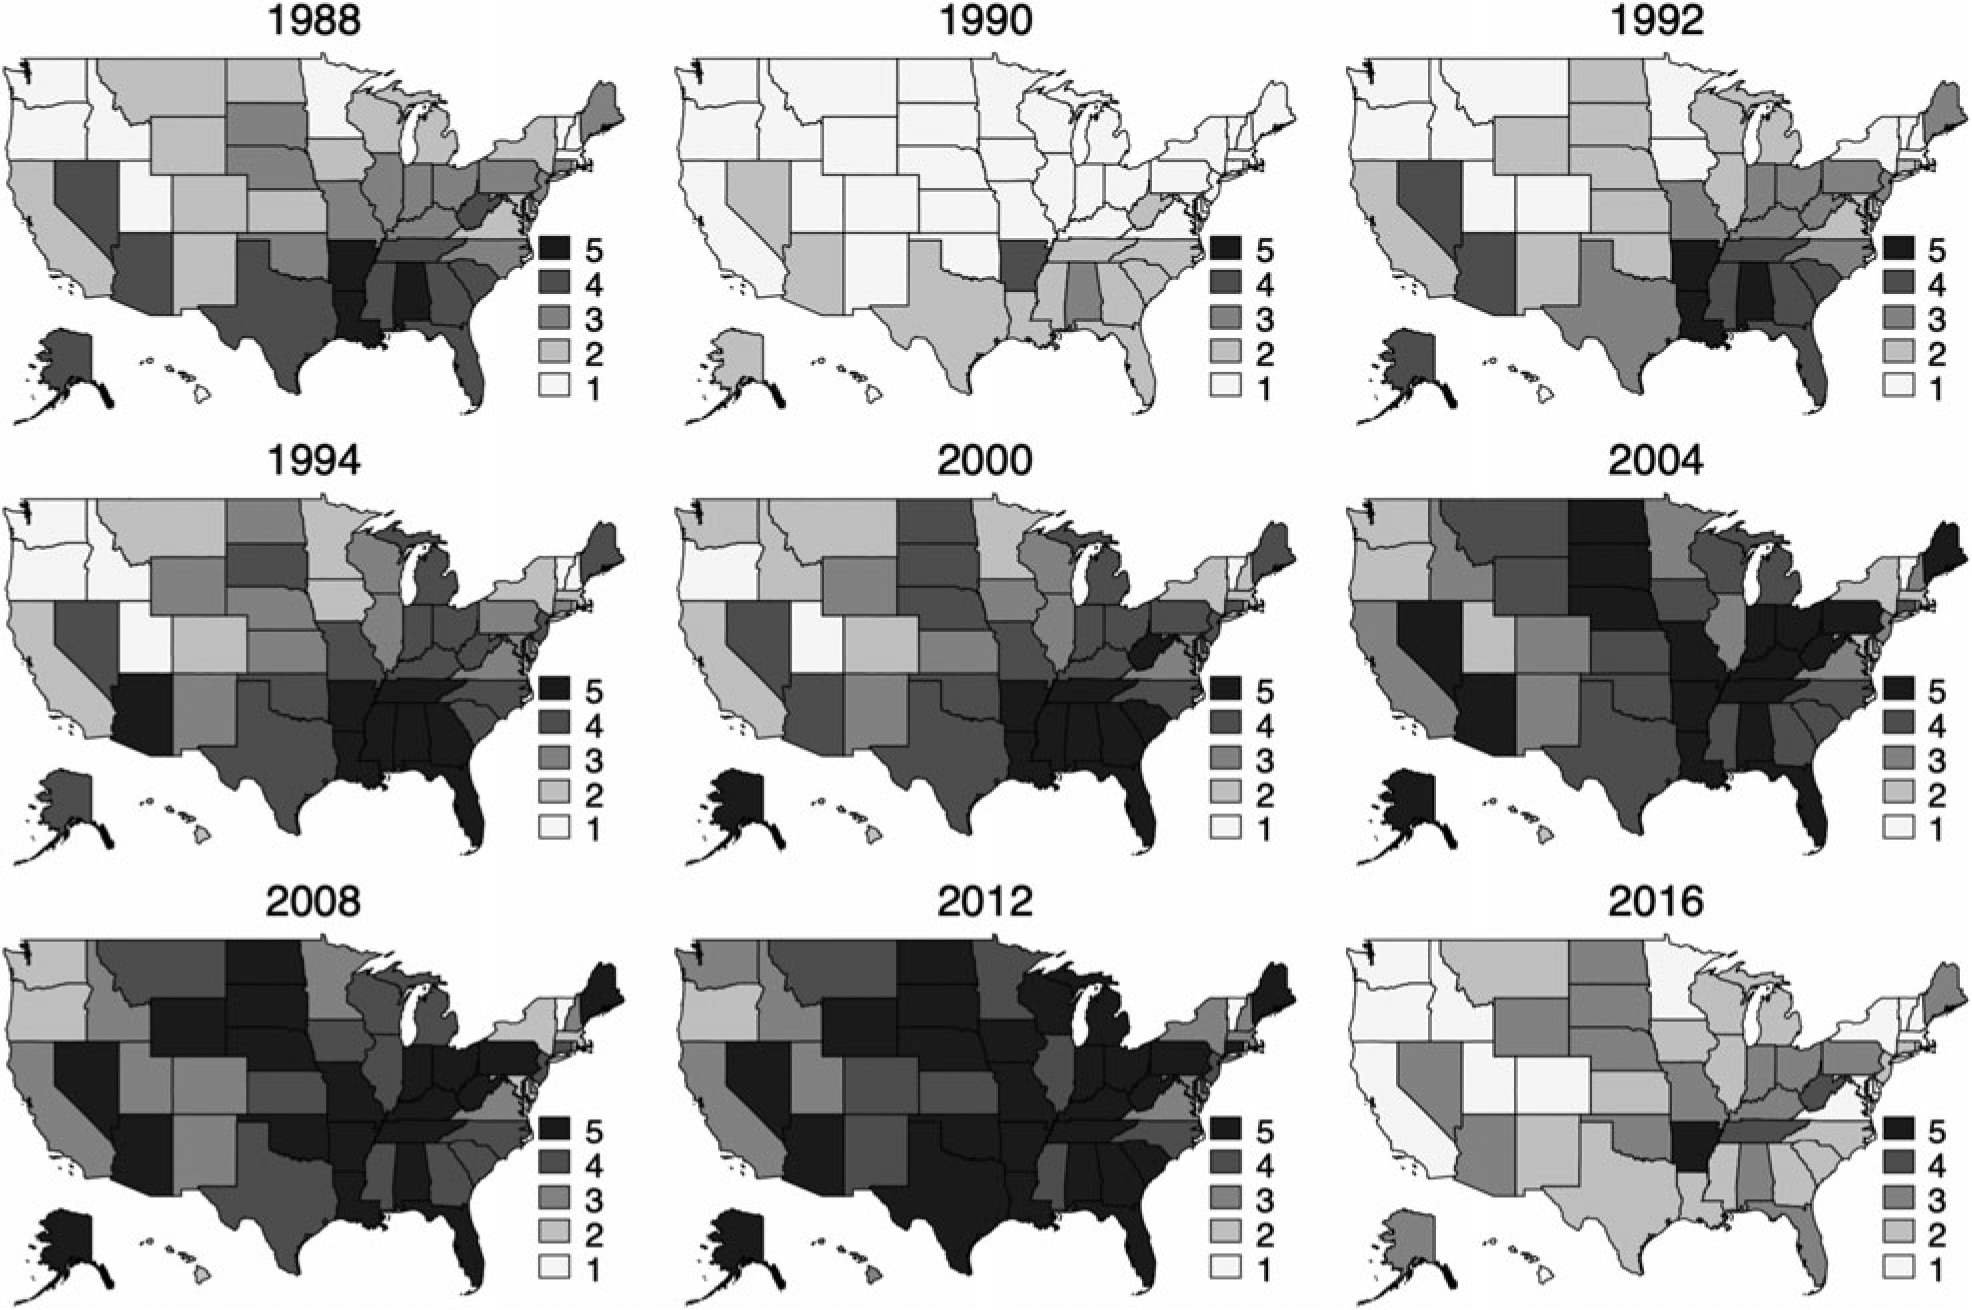
Figure 5 Mapping Changes in Racial Resentment in the States over Time, 1988–2016
What stands out is that the 1990 state-years appear to hold the lowest levels of racial resentment, much lower than 2004, 2008, and 2012. The cluster of lighter shades in the 1990s and 2016 suggests that states were generally lower in racial resentment in comparison to the years 2004, 2008 and 2012, which are largely marked by darker shades of gray. Here is another way to think about this finding: 1990 Texas ranked lower in racial resentment than 1994 Texas, 2012 Texas, and even 2012 Maine, a state not typically stereotyped as racially pernicious. We also see that Arkansas in 1988, 1992, 1994, 2000, 2004, 2008, 2012, and 2016 dominates high ranks of racial resentment across time and across states: even in periods where most other states are experiencing relatively lower levels of racial resentment (1990, 2016), Arkansas seems impervious to change.
Figure 5 also illustrates that few states reported lower levels of racial resentment in 2012 than in 1990. This analysis, which centers on state-level racial attitudes, reveals a more nuanced depiction of racial resentment across the country over time. Whereas national aggregate levels of racial resentment (Figure 1) suggest little change, Figures 4 and 5 show that there have been major changes in the way Americans across racial groups report levels of racial resentment at the state level.
Discussion
We wrote this article in service to our discipline, hoping not only to shed light on Americans’ racial attitudes where they are most likely to influence public policy and candidate selection—at the state level—but also to provide a tool for scholars. By merging nationally representative survey data and US Census data and applying MRP, an appropriate and sophisticated methodological strategy, we are able to create measures of state-level racial resentment. This measure bypasses the use of aggregate measures like demographic characteristics or conservative vote choice to operationalize racial attitudes; incorporates the values of all American adults; and leverages a tried-and-true measure of racial attitudes to create a dynamic metric of state-level racial attitudes. We avoid the ecological fallacy as well. These “scores” (provided online in Appendix B2) can be used by scholars to explain and predict policy outcomes, particularly in those policy domains that speak to racial inequity.
Our exploratory analysis reveals that racial progress has not been monotonically improving, perhaps adding to an emerging consensus (Enders and Scott Reference Enders and Scott2018; Yadon and Piston Reference Yadon and Piston2018), but this article also adds an important nuance: states’ levels of racial resentment have improved and declined at different rates and in different times. National-level analysis leaves us blind to this variation. In addition, we address questions about the reputations of states and regions. The South does have a dogged reputation as the “most racist” region, given its history of slavery and racial terror. But the contemporary policy outcomes of states across the country suggest that we should problematize this set of stereotypes. History shows that Jim Crow has had a long life in the Northeast and the Midwest, especially in the wake of and reaction to the Great Migration (Theoharis Reference Theoharis2018). Many of the most racially segregated cities and schools are not in the South, but instead are in the Midwest and in the so-called racially progressive northeastern states. In majority-minority states like California, the prison budgets are many times higher than that spent on schools, exposing the fact that their priorities are organized in a way to exacerbate racial inequality (Michener Reference Michener2019). In fact, our results show that, between the late 1980s and 2000, many Southern states lived up to their stereotype as the “most racist” (along with southwestern states like Nevada and Arizona, which the national conversation has ignored). But there appears to be an important break from this pattern after that period, giving rise to a new configuration of the geography of racial resentment. Today, a swath of states ranging from Pennsylvania, across the Appalachians, through the Midwest, and toward Oklahoma report some of the highest levels of symbolic racism. In addition, some Plains states have cropped up as new bastions of racial resentment since the turn of the twenty-first century.
Determining the causes of these dynamics is beyond the scope of this article, but we hope to inspire scholars to work to answer a new set of questions. Why do attitudes at the state level change? What are the mechanisms that influence shifts in racial resentment? What is the link between racial attitudes and change in policies over time?
Research on policy responsiveness reveals that, although there are some policy areas that may be likened to an on-off switch, where policy change and implementation result from a shock (e.g., state gun policy change in the wake of the Parkland shooting in Florida), there are other policy domains in which policy makers may only react when the general orientation—such as partisanship, ideology, or, arguably, racial attitudes—of a locality shifts (Erikson, Wright, and McIver Reference Erikson, Wright and McIver1993; Lax and Phillips Reference Lax and Phillips2009; Pacheco Reference Pacheco2014). The changes we highlight in subnational racial attitudes may help us understand why we are seeing phenomena like greater contention (and potential for change) around racist symbols in the South, entrenched punitive policies toward the poor and uninsured in some states, and heightened possibilities for criminal justice reform in others.
Again, the historical focus on the South has been helpful because of the history of white supremacy in that area, but racial animus is not unique to that region. An examination across the 50 states will likely provide a wider array of hypotheses to explain the various shapes that racial inequity takes as one moves across state and regional lines. Taken together, we hope to advance our understanding of American racial dynamics by providing a set of analyses that delve beyond the South–non-South dichotomy to specify changes in racial attitudes over time in each state. We offer a measure of, or at least a template for, racial attitudes at the subnational level, which is where most of the policy action in the United States takes place. We are motivated to learn more about how, why, and when policy makers respond to ongoing racial inequality that is within their purview, and we hope to have provided a tool for scholars to do this kind of work in a more precise way.
Supplementary Materials
To view supplementary material for this article, please visit https://doi.org/10.1017/S1537592719002688


