1 INTRODUCTION
Imaging spectroscopy over the centimetre and decimetre wavelength range is important for addressing fundamental problems of energy release, particles acceleration, and particle transport (Bastian, Benz, & Dary Reference Bastian, Benz and Dary1998). However, the available radio imaging observations are presently only at a few discrete frequencies in the range 150–450 MHz from Nancay Radioheliograph (Kerdraon et al. Reference Kerdraon, Delouis and Trottet1997), at 5.7 GHz from Siberian Solar Radio Telescope (Grechnev et al. Reference Grechnev2003), and at 17 and 34 GHz from Nobeyama Radioheliograph (NORH) (Nakajima, Nishio, & Enome Reference Nakajima, Nishio and Enome1994). Therefore, a new instrument which is capable of true imaging spectroscopy, with high temporal, spatial, and spectral resolutions is needed (Gary et al. Reference Gary and Keller2004). The Mingantu Ultrawide Spectral Radioheliograph (MUSER) has been built to meet this goal. The MUSER in centimetric–decimetric wave range is a solar-dedicated radio interferometric array that will be used to carry out imaging spectroscopy of the Sun, to produce high space resolution, high time resolution, and high-frequency resolution images of the Sun simultaneously (Yan et al. Reference Yan, Zhang, Huang, Tang and Liu2004, Reference Yan, Zhang, Wang, Liu, Chen and Ji2009).
Image simulations are significant and necessary for evaluating a radio interferometric array. The Brazilian decimetric array (BDA) simulated a radio observation at 1.5 GHz with the T-shaped array and compare the restored images with that obtained by NORH and the YOHKOH satellite (Lüdke, et al. Reference Lüdke2000). The Frequency Agile Solar Radioheliograph (FASR) present some simulations of imaging the thermal free–free emission from the Sun's atmosphere using models based on EUV data at 1 and 5 GHz (White et al. Reference White, Lee, Aschwanden and Bastian2003). Now, MUSER, including antennas, receivers, and correlators, has already been established and in the stage of testing observation. In order to cooperate with the testing observation, it is necessary to do some image simulations to assess the imaging performance.
In this paper, we discuss three different array configurations for MUSER-I, and analyse the beam parameters, the uv points distribution and the image fidelity. Assessing the dynamic range of the restored image which is produced with the visibility has different phase errors, and the lack of antenna impact on the image quality. In order to study more realistic situations of the Sun, we use the models based on the NORH and the Solar Dynamics Observatory Atmospheric Imaging Assembly observations (SDO/AIA) EUV data, and make simulations with CASA (the Common Astronomy Software Applications).
2 THEORY OF SYNTHESIS IMAGING
The complex visibility function is a Fourier component of the true sky brightness distribution (Clark Reference Clark, Taylor, Carilli and Perley1999).
The spatial frequency u, v is a measurement of the complex visibility function V(u, v) given in wavelength, which depends on the differences of the baselines (the distance and direction) between two antennas. For N antennas, there will be N(N − 1)/2 simultaneous measurements in the u–v plane given by N(N − 1)/2 interferometer pairs, then the true sky brightness distribution can be obtained through the inverse Fourier transform, which is the image we want to obtain (Sault et al. Reference Sault and Wieringa1994).
For an interferometer array composed of N antennas, there will be N(N − 1)/2 interferometer pairs and N(N − 1)/2 baselines, so in the u –v plane will be N(N − 1)/2 (u, v) points, the distribution of these (u, v) points is called uv configuration or uv sampling. For a complex visibility function V(u, v), there is always a brightness function I(l, m) corresponding to it. The complex visibility function is a continuous complex function, but in an aperture synthesis array there is only limited numbers of baselines, it is mean that only a limited of the complex visibility function can be get, it is sampling the complex visibility function, so the distribution function of the (u, v) points in the uv plane called sampling function S(u, v). Above all, the sampled complex visibility function is the real data produced from the aperture synthesis array. The Fourier transform of these data can produce the dirty map I D(l, m).
The Fourier transform of the sampling function is called the dirty beam or the point spread function. According to the convolution theorem, the dirty map yields the true sky brightness convolved with the point spread function (Clark Reference Clark, Taylor, Carilli and Perley1999).
To find the true sky brightness I(l, m), deconvolving the point spread function B D(l, m) from the dirty image I D(l, m) is necessary.
3 DESCRIPTION OF MUSER
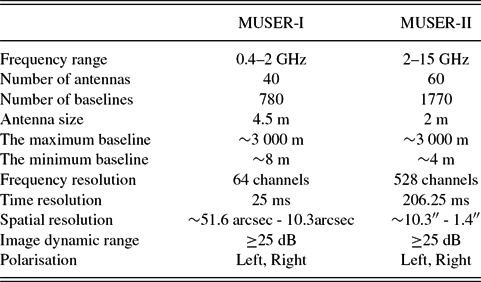
The MUSER array is situated in Inner Mongolia of China, 42°12′42.6′′ north latitude, 115°15′1.8′′ east longitude, altitude 1365 m. The frequency range is 0.4–15 GHz, and the radio frequency signal is divided into 0.4–2 GHz (MUSER-I) and 2–15 GHz (MUSER-II) bands. MUSER-I is composed of 40 equatorial mounted parabolic 4.5-m antennas, and MUSER-II is composed of 60 equatorial mounted parabolic 2.0-m antennas. All of these antennas are installed according to a three-arm spiral arrangement. The antenna arrangement of MUSER-I are shown in Figures 1 and 2 (Wang et al. Reference Wang2013). Now, MUSER, including antennas, receivers, and correlators, has already been established and entered into the stage of test observation. Some technical specifications of MUSER-I and MUSER-II, as driven by scientific requirements, are shown in Table 1 (Yan et al. Reference Yan, Zhang, Wang, Liu, Chen and Ji2009; Wang et al. Reference Wang2013).

Figure 1. Antenna arrangement of MUSER-I.

Figure 2. Antenna arrangement of the MUSER-I central part.
Table 1. MUSER specifications.

4 IMAGE SIMULATION OF MUSER-I
4.1 The array configuration
The array configuration of MUSER-I is designed to be a spiral array which has the capability to map the entire Sun at 0.4–2 GHz.
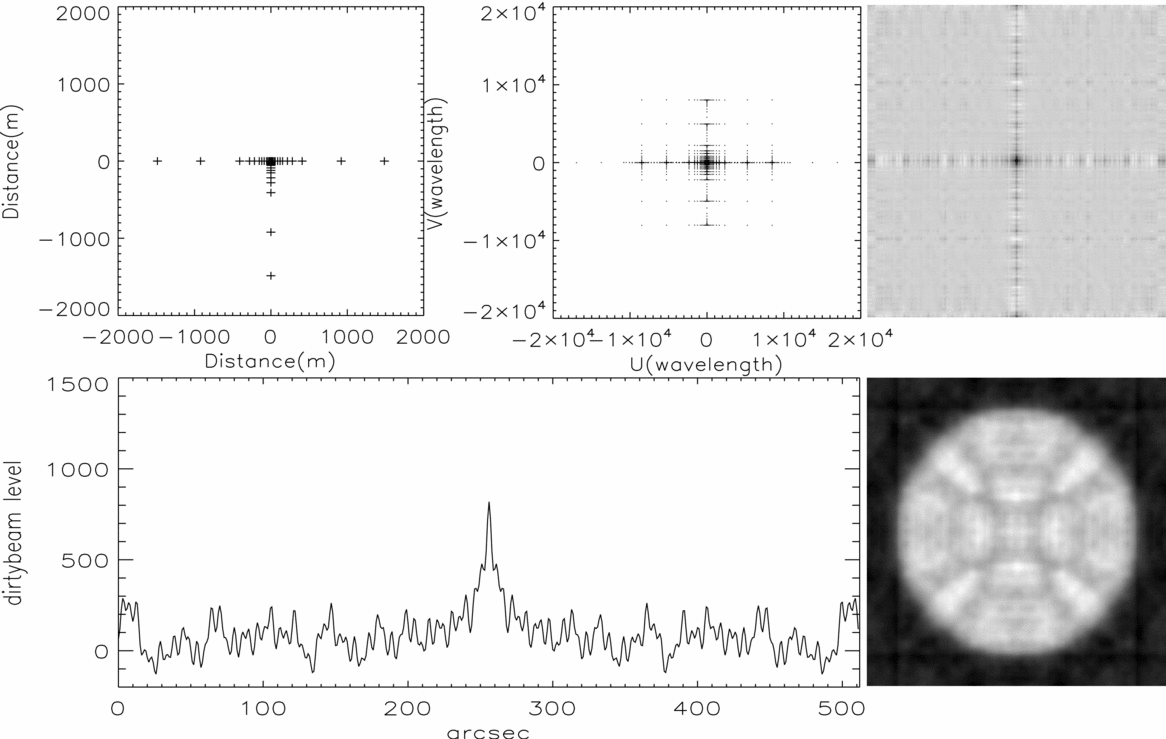
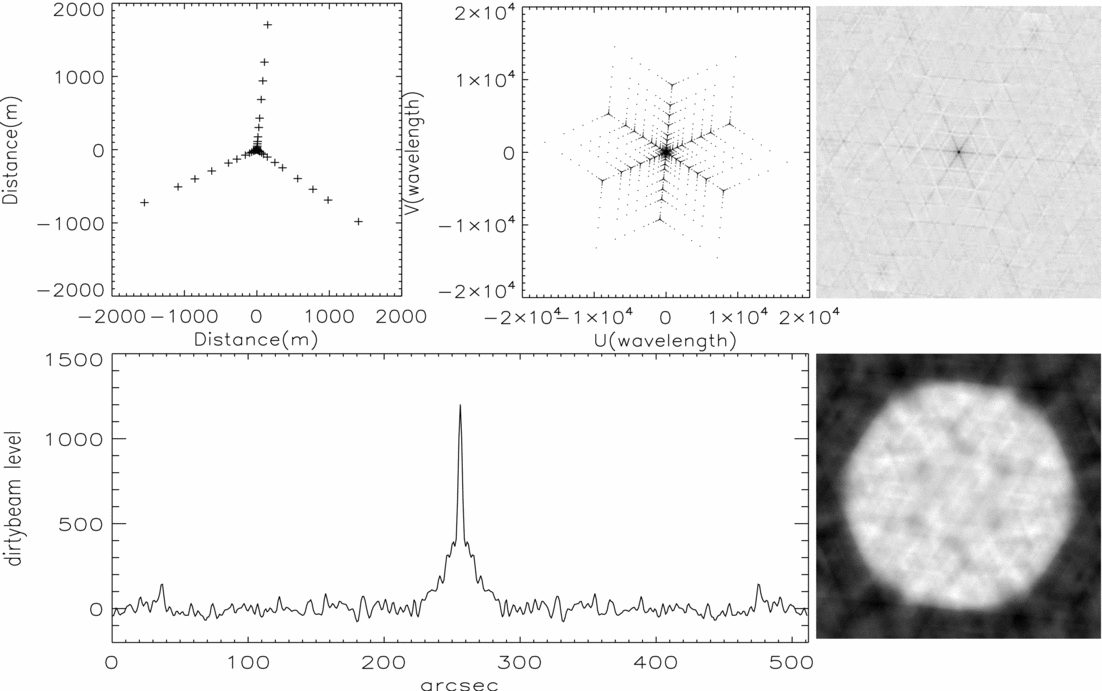
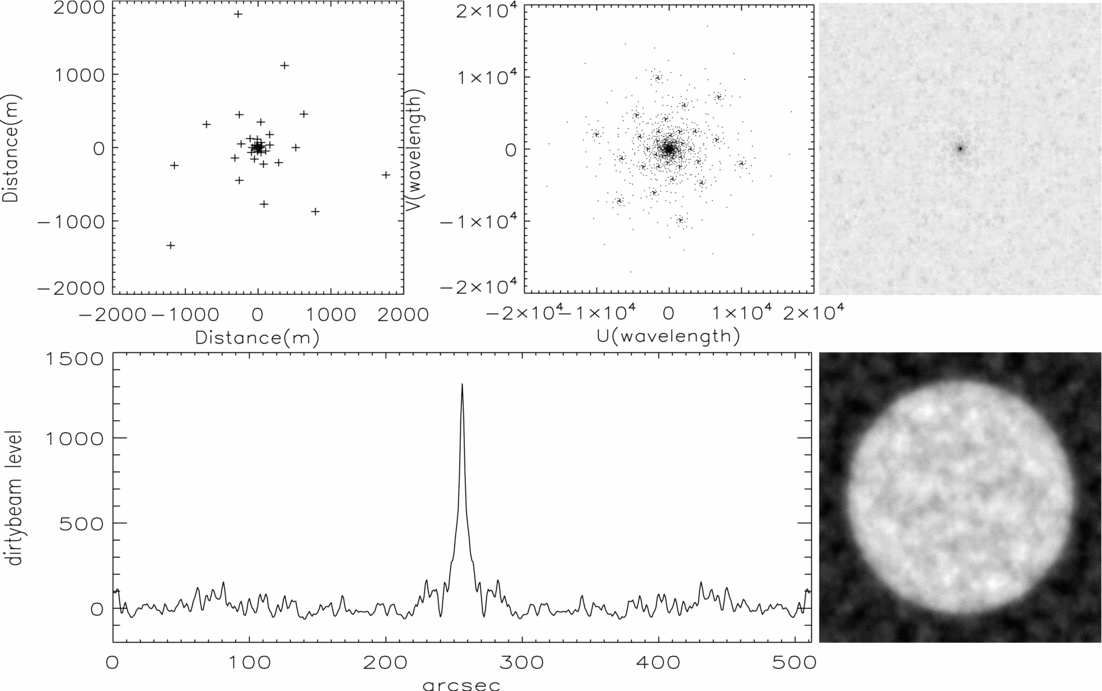
In order to analyse the effect of the array configuration in imaging quality, we considered three different shape arrays (T-array, Y-array, and the spiral array), each array consist of 40 antennas together with the same maximum and minimum baseline. The maximum baseline is 3 km, and the minimum baseline is 8 m. The antenna position of T-array follows the NORH (Nakajima et al. Reference Nakajima, Nishio and Enome1994), the array configuration is a multiply-equally-spaced T-array. The configuration of Y-array is designed to be another multiply-equally-spaced array, and make each arm differ by 120° like VLA (Thompson et al. Reference Thompson, Clark, Wade and Napier1980). MUSER-I is the spiral array. Here, we adopt an ideal solar disk as the model and observer it with these three arrays, the pixel is 512 × 512 and the corresponding field of view is 40 arcmin × 40 arcmin. The declination of source is 23.5°, the observation frequency is 1.7 GHz, and the observation mode is snapshot. According to the synthesis imaging theory, Figures 3–5 can be obtained, which shows the antenna layout, the snapshot uv configuration, the dirty beam and its cross section, and the restored image produced from T-array, Y-array, and MUSER-I.

Figure 3. Top left: The antenna layout of T-array. Top middle: The snapshot u–v distribution resulting from this configuration at 1.7 GHz. Top right: The dirty beam. Bottom left: The dirty beam's cross section. Bottom right: The full disk radio image observed with T-array at 1.7 GHz.

Figure 4. Top left: The antenna layout of Y-array. Top middle: The snapshot u–v distribution resulting from this configuration at 1.7 GHz. Top right: The dirty beam. Bottom left: The dirty beam's cross section. Bottom right: The full disk radio image observed with Y-array at 1.7 GHz.

Figure 5. Top left: The antenna layout of MUSER-I. Top middle: The snapshot u–v distribution resulting from this configuration at 1.7 GHz. Top right: The dirty beam. Bottom left: The dirty beam's cross section. Bottom right: The full disk radio image observed with MUSER-I at 1.7 GHz.
In this simulation, the resolution, the baseline distribution function, and the restored image fidelity of these three arrays are on the focus. The resolution represents the ability of the Radioheliograph to distinguish between two adjacent sources, the baseline distribution function represents the sensitivity of observing different scale sources, and the fidelity of the restored image is a good indicator of the image quality.
According to the synthesis imaging theory, the dirty map is the true sky brightness convolved with the dirty beam, so the nature of the dirty beam is very important for image quality. Table 2 shows the beam parameters of T-array, Y-array, and MUSER-I, including the sidelobe distribution, the maximum axial resolution (Rmaj), the minimum axial resolution (Rmin), and the position angle. Furthermore, the declination of the Sun varies between − 23.5° and 23.5° during a year's observation, then the baseline in the north–south direction varies with the Sun's angle of incidence, which will influence the dirty beam and the image quality of the interferometer. Table 3 shows the beam parameters vary with declinations of the Sun in MUSER-I. At different declinations, although observing the same source, the resolution of the image in the declination direction will go down with the resolution of the north–south baseline getting worse.
Table 2. The beam parameters of the three different arrays.

Table 3. The beam parameters of MUSER-I at different declinations.

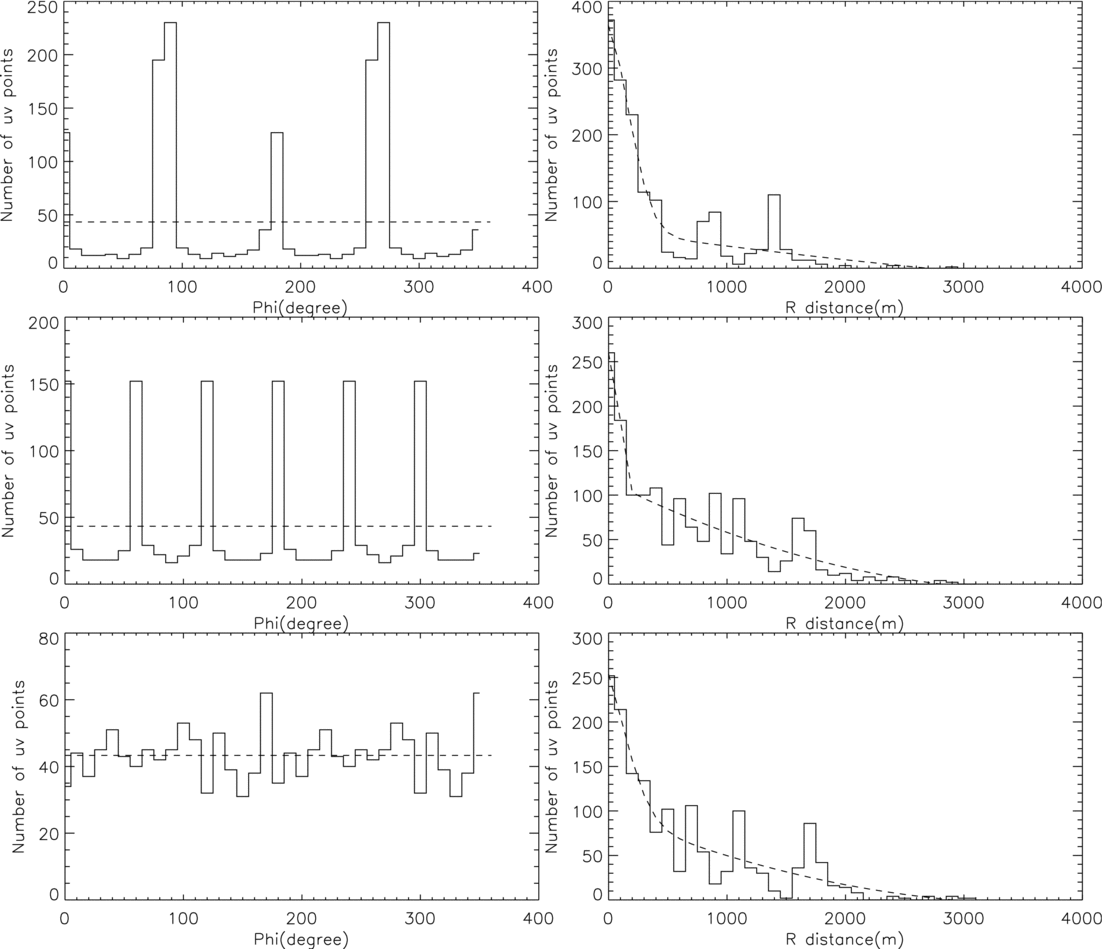
The baseline distribution can be studies by the uv points distribution, Figure 6 shows the uv points distribution with the azimuth and the radius in these three arrays. The uv points of T-array are distributed mainly in four directions. The uv points of the four direction regions accounted for 70.77% of the total, and the densest direction regions is about 5.31 times denser than the average. The uv points of Y-array are distributed mainly in six symmetry directions. The uv points of the six direction regions accounted for 58.46% of the total, and the densest direction regions is about 3.51 times denser than the average. The uv points of MUSER-I distributed relatively uniform with the azimuth, and the densest direction regions is about 1.43 times denser than the average. Furthermore, the uv points distributions with radius are very close due to the similar parameters set in the three arrays.

Figure 6. Left column is the uv points distribution with the azimuth, the dotted line represents the average of the uv points. Right column is the uv points distribution with the radius, the dotted line represents the Gaussian fitting. From top to bottom are T-array, Y-array, and MUSER-I.
The ‘fidelity’ defined as the ratio of the value of a pixel to the error between the true sky distribution T(x) and the reconstructed image I(x). The fidelity is therefore an image that expresses an estimate of the signal-to-noise ratio (SNR) for each pixel. Here we estimate a fidelity index (FI) by taking the median value, which is only an approximation to the true fidelity (Cornwell, Holdaway, & Uson Reference Cornwell, Holdaway and Uson1993).
Table 4 shows the FI of the restored image produced from T-array, Y-array, and MUSER-I at different frequencies. The image FI of MUSER-I is almost better than that in the other two arrays.
Table 4. The fidelity index (FI) of the cleaned image which is obtained by the three different arrays at different frequencies (GHz).

4.2 The dynamic range
The dynamic range attained in an image depends on the type, size, and distribution of errors in the measurements of the visibility (Perley Reference Perley, Taylor, Carilli and Perley1999; Koshiishi et al. Reference Koshiishi1994). Since the Sun is an extended source relative to the main beam of each antenna, off-pointing causes relatively large phase errors, rather than amplitude errors (Koshiishi et al. Reference Koshiishi1994). Therefore, ignoring the amplitude errors, we only consider the typical phase errors at one time or place to simulate the images. Dividing the phase errors into two categories: one is antenna-based error; the other is baseline-based error. Evaluating these errors with two different distributions: the Uniform distribution and the Gaussian distribution.
A antenna-based error can be identified with an antenna, whose effect thus occurs equally on all baselines which use that antenna, while a baseline-based error cannot be separated into a pair of antenna-based errors – it is identified with a particular baseline. Consider a snapshot observation, suppose the errors are antenna-based or baseline-based, and all antennas or all baselines have a typical phase error, the dynamic range yielding Equations (3), (4) (Perley Reference Perley, Taylor, Carilli and Perley1999).
(D is the dynamic range, N is the number of the antennas, ϕ is the phase error (in radians))
These equations can also be used to estimate the tolerable phase error to attain the theoretically best dynamic range. For MUSER-I, the expected dynamic range is 25 dB (320:1) for a single snapshot with 40 antennas, calculating from the equations can draw that the tolerable phase error is 5°.
The dynamic range of an image is defined as the ratio between the peak brightness of the strongest compact source in the image and the standard deviation of the errors (Koshiishi et al. Reference Koshiishi1994). The errors are the differential image between two dirty images: one is synthesised from the original visibilities and the other is synthesized from the visibilities which includes the phase errors by a Fourier transformation (I 1(x), I 2(x)).
We simulate two sources of different structures: one is a point source which is situated at the phase center, the other is a solar radio model which contains some point sources and Gaussian active regions. Then some dirty images can be produced with different frequencies and different declinations by observing the models with MUSER-I. Supposing all antennas have a typical antenna-based phase error or all baselines have a typical baseline-based phase error, which obeys Uniform distribution (the maximum phase error is 5°) or Gaussian distribution (3σ = 5) to produce new dirty images. Then, the dynamic range can be calculated with equation (8), the results are shown in Figures 7 and 8. We can see that the dynamic range almost agree with 25 dB, which satisfied the system requirement.

Figure 7. The dynamic range of the restored images with different frequencies and different declinations. The model is a point source. The phase errors of the upper two are antenna-based, and the lower two are baseline-based. The errors of (a), (c) are the Uniform distribution, and the errors of (b), (d) are the Gaussian distribution. Different declinations marked in different colours (blue: 23.5°, red: 10°, green: 0°, black: − 23.5°)

Figure 8. The dynamic range of the restored images with different frequencies and different declinations. The model is a solar disk with some point sources and some Gaussian active regions. The phase errors of the upper two are antenna-based, and the lower two are baseline-based. The errors of (a), (c) are the Uniform distribution, and the errors of (b), (d) are the Gaussian distribution. Different declinations marked in different colours (blue: 23.5°, red: 10°, green: 0°, black: − 23.5°)
4.3 Simulation of flagging some antennas
For an interferometer, the number of the antennas determines the number of the baselines and the number of the uv points, and further influences the beam and the restored image. But in the daily observation, it is inevitable to flag some antennas along with the instrument aging or some unforeseeable situations. Thus, it is need to do some simulations to try to know the lack of antenna impact on the image quality.
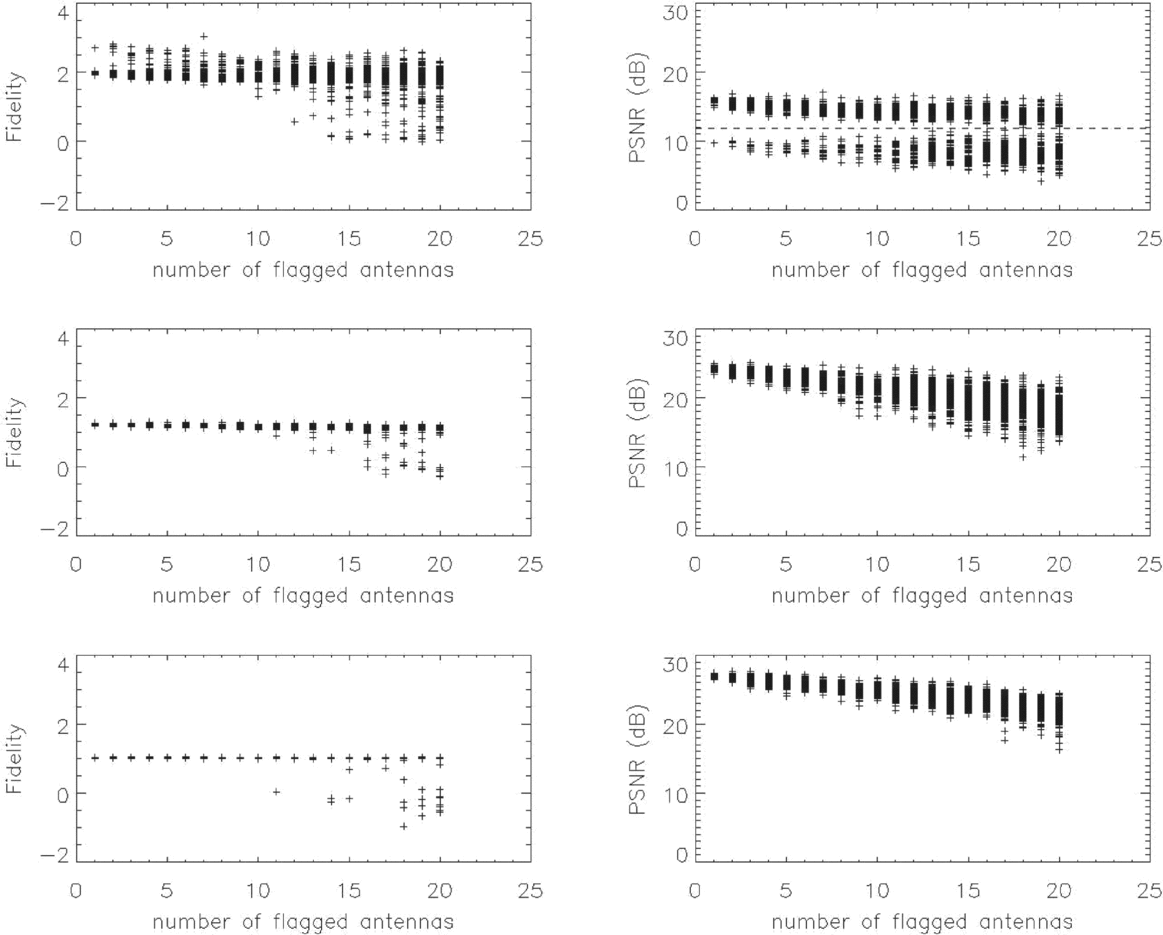
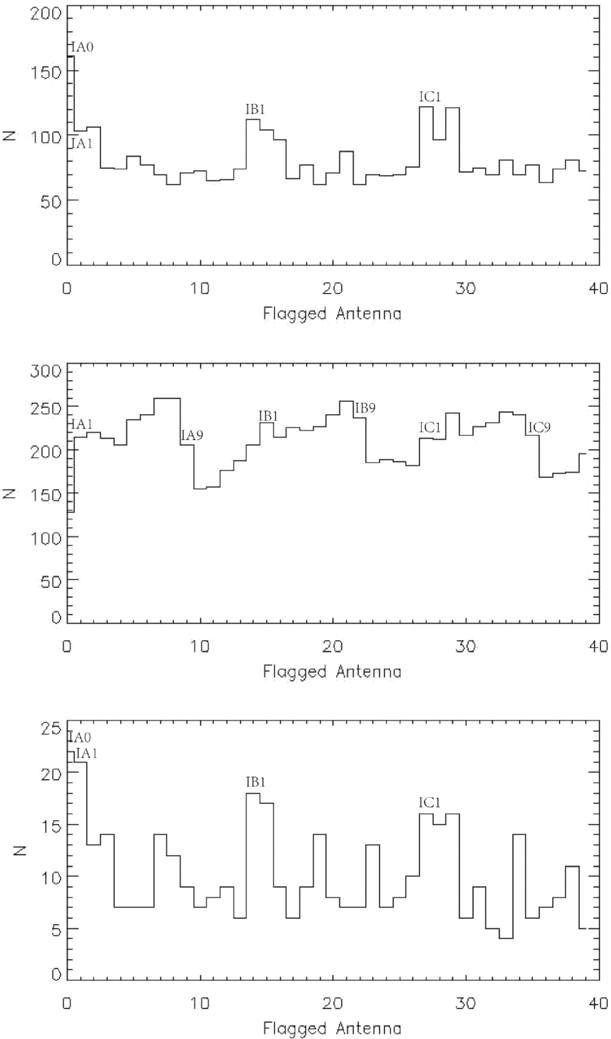
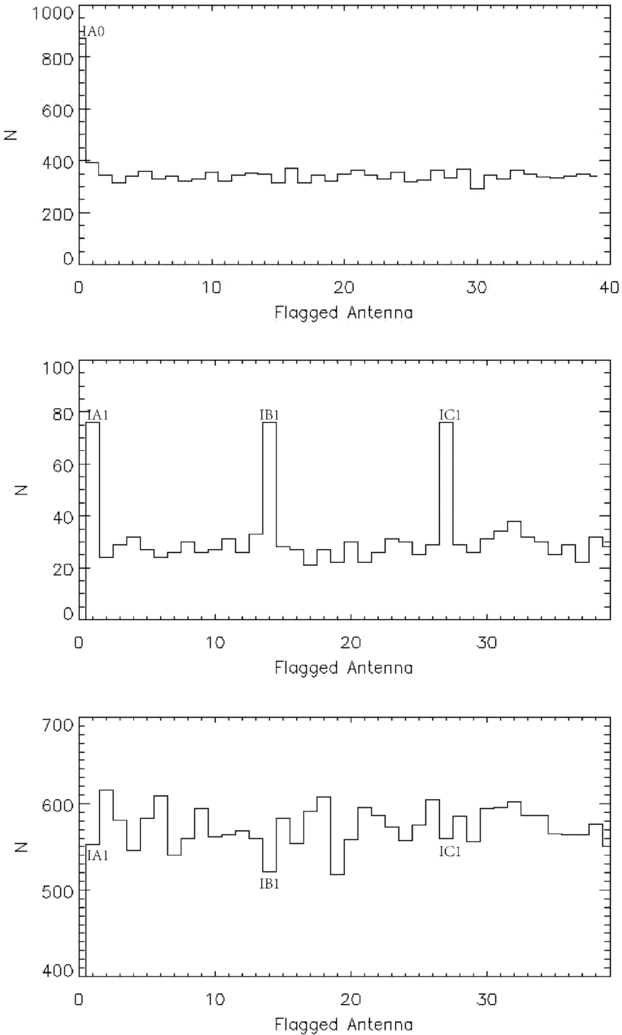
In order to simulate the actual situation of the Sun, considering three models: (1) a quiet sun model (Quiet), (2) an active solar model (Active), (3) a solar model with a strong explosive event (Flare). These models are based on the NORH data observed at 17 GHz on 2013 March 2, 2012 March 7, and 2014 October 28 (Figure 9). In this simulation, the observe frequency is 1.7 GHz, the declination 23.5°, and the hour angle is 0°. For each model, we flag different number of antennas (1 ~ 20) in turn, evaluate the images with the FI and the peak signal-to-noise ratio (PSNR). In each simulation, the mode of flagging antennas is random. The number of the simulations which flag 1 ~ 10 antennas are 100 and the others are 200. As the results shown in Figure 10, the FI does not change too much in these three models, and the PSNR goes down as the number of flagging antennas increases. From the left column of Figure 10, some of the FI are significantly lower than the average value, the number of these lower FI simulations in these three models are 6.40, 16.17, and 0.77% of the total simulation times, respectively. For the flagging simulations that produce anomalously low Fluctuation Indices (Figure 10, left), Figure 11 shows number of times each of the 40 antennas were flagged. From Figure 11 and the antenna arrangement of MUSER-I (Figures 1 and 2), it can be seen that for the Quiet and the Flare models, the missing of the short distance antennas affects image fidelity seriously, and for the Active model, the short and middle distance antennas are more important. For the Quiet model, there is a clear boundary in the PSNR (Figure 10, right top). Here the total number of simulations is 3 000, and the number of the lower PSNR simulations (PSNR ⩽ 11.8) is 948. The top panel of Figure 12 shows number of times each antenna were flagged in the lower PSNR simulations. It is found that IA0 is the most important for PSNR, the flagged number of IA0 is 872, which is obvious that not all of the lower PSNR simulations flagged IA0, so the middle panel of Figure 12 is another statistic of the other 76 lower PSNR simulations without IA0. It is found that all of these 76 simulations flagged IA1, IB1, and IC1 simultaneously, and all of these four antennas are short distance in MUSER-I. The bottom panel of Figure 12 is the statistic of the higher PSNR simulations (PSNR > 11.8), none of the 2052 simulations flagged IA0 or all of the ![]() $\#$1 antennas (IA1, IB1, IC1).
$\#$1 antennas (IA1, IB1, IC1).

Figure 9. The models for the flag antenna simulation which is based on the NORH data observed at 17 GHz on 2013 March 2 (Quiet), 2012 March 7 (Active), and 2014 October 28 (Flare). The peak of these three models is 30 896, 515 433, and 4 120 619K, especially.

Figure 10. The fidelity index (FI) and the peak signal-to-noise ratio (PSNR) of the cleaned images produced from MUSER-I when it flags different number of antennas (1 ~ 20) in turn. The mode is random, and the times of flagging 1 ~ 10 antennas are 100 and the others are 200. From top to bottom, the models are the Quiet, Active, and Flare models.

Figure 11. For the flagging simulations that produce anomalously low Fluctuation Indices (Figure 10, left), this figure shows number of times each of the 40 antennas were flagged. It is inferred that the FI is more sensitive to the loss of those antennas with high counts. From top to bottom, the models are the Quiet, Active, and Flare models.

Figure 12. For the flagging simulations that produce anomalously low Fluctuation Indices (Figure 10, right top), the top panel shows number of times each of the 40 antennas were flagged, the middle panel shows number of times each of the other 39 antennas (without IA0) were flagged. And the bottom panel shows number of times each of the 40 antennas were flagged for the flagging simulations that produce high Fluctuation Indices. It is inferred that the PSNR is more sensitive to the loss of those antennas with high counts. The model is the Quiet model.
From all the results discussed above, we may draw the conclusion that the short distance antennas are the main factors affecting the image quality in the solar observation. In the quiet sun observation, IA0 plays the most important role in MUSER-I, which will affect the image PSNR seriously even we only flag IA0, and the ![]() $\#$1 antennas (IA1, IB1, IC1) play the second important role in PSNR. In daily observation, it is important to guarantee that the short distance antennas work well especially for the quiet sun observation.
$\#$1 antennas (IA1, IB1, IC1) play the second important role in PSNR. In daily observation, it is important to guarantee that the short distance antennas work well especially for the quiet sun observation.
4.4 Image simulation using CASA
CASA (the Common Astronomy Software Applications) will be used in MUSER to support the data post-processing because it can process interferometric data and provide basic and advanced capabilities useful for the analysis for data. CASA also takes advantage of the speed, large internal memory, and graphics capabilities to provide a fast and flexible data reduction environment for the astronomer, so here we use CASA to image the sun at radio wavelengths and present some simulations using models based on NORH and SDO/AIA data (Nakajima et al. Reference Nakajima, Nishio and Enome1994; Lemen et al. Reference Lemen2012). In these simulations, the radio image from the NORH and EUV image from the SDO/AIA are used as the simulation models, processing them through MUSER-I and comparing with the actual images (Lüdke, et al. Reference Lüdke2000; White et al. Reference White, Lee, Aschwanden and Bastian2003).
Figure 13 shows the model of the solar disk which obtained from NORH and the clean radio image at 1.7 GHz produced with MUSER-I. In this simulation, the model data are observed by NORH at 17 GHz on 2013 January 13 with a very intense flare. Using the task ‘simobserve’ to convert the model data into a model observation, the observed frequency is 1.7 GHz, the pixel is 4 arcsec, the bandwidth is 25 MHz, the integration time is 3 ms, and the total time is 1 time to make the observation as a snapshot. In the clean procedure, setting the parameter ‘niter’ to zero to obtain the dirty map, and then clean the residual image iteratively to obtain the cleaned map (the right panel in Figure 13). From the cleaned map, the intense flare is visible on the disk obviously and matches the model well, and the dynamic range of the cleaned map is 55.47 dB corresponding to the dynamic range of the model is 82.68 dB.

Figure 13. Left: The model of the solar disk based on the Nobeyama Radioheliograph data at 17 GHz on 2013 January 13 with a very intense flare. Right: The cleaned map processed through MUSER-I at 1.7 GHz, the pixel is 4 arcsec, the region is 512 × 512 pixels, corresponding the field of view is 34 arcmin.
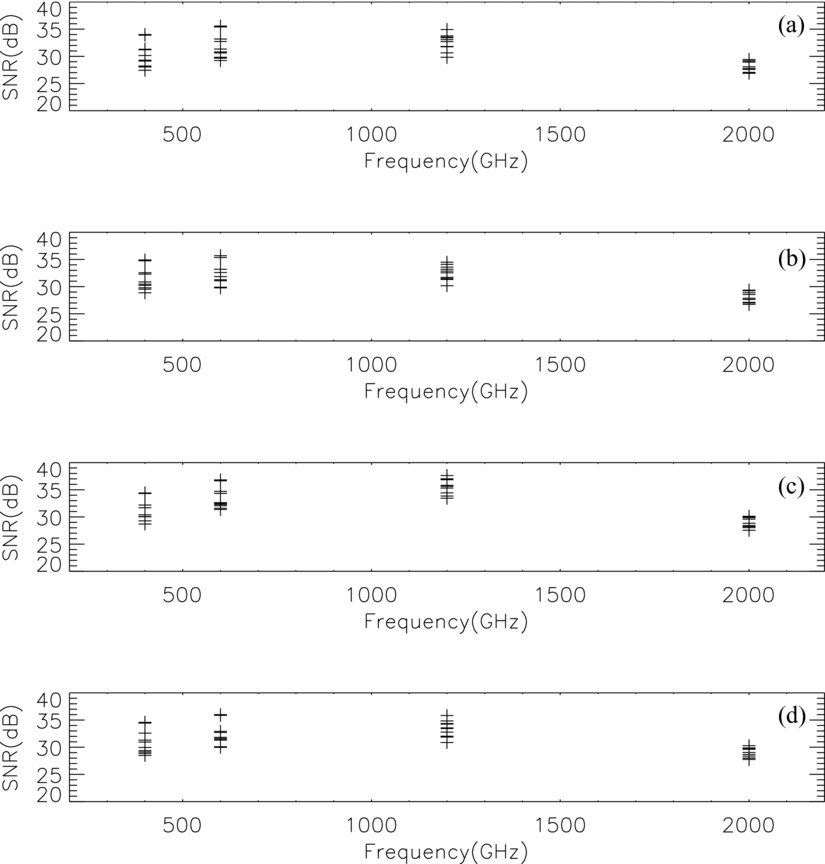
In order to simulate the capability of imaging for MUSER-I realistically, the EUV image data from SDO/AIA on 2011 February 14 are used as an input image of the model without considering the radio emission. The model has many active regions on the disk, so it is typical and very suitable for simulating. Furthermore, MUSER is a solar-dedicated radio interferometric array at multiple frequencies, so we observe the model at different frequencies for imaging. Due to the spatial resolution varying with the frequency, one-third of the spatial resolution is used as the pixel and considering the size of the sun to determine the size of image under different frequencies. Figure 14 shows the inputted image obtained from SDO/AIA on 2011 February 14 with many active regions (a ~ j). The snap-shot-cleaned maps produced with MUSER-I at 0.4, 0.6, 1.2 and 2 GHz are shown in Figure 15. As we seen, the profile of the Sun and the structure of the active regions are getting more clearly as the frequency increases. Tables 5 and 6 show the SNR of the different regions (a ~ j) in the cleaned maps which is produced with MUSER-I with different frequencies or different integration time, the regions selected as the Figure 14 shown. In the snap-shot mode, MUSER-I will produce an image every 3 ms. From Table 6, we can see that the SNR of region a ~ j is getting better when the integration time increases, the image quality is getting better. Figure 16 shows the SNR of the region a ~ j in the cleaned maps when MUSER-I has a 5° phase error using the method mentioned in the Section 4.2 (different types and distributions error).

Figure 14. The inputted image of the simulation model obtained from the SDO/AIA on 2011 February 14 with many active regions (a ~ j) on the disk.

Figure 15. The snap-shot-cleaned maps produced with MUSER-I at different frequencies. Top left: The frequency is 0.4 GHz, the spatial resolution is ![]() $51.6\,\text{arcsec}$, and the pixel is
$51.6\,\text{arcsec}$, and the pixel is ![]() $17.2\,\text{arcsec}$. top right: The frequency is 0.6 GHz, the spatial resolution is
$17.2\,\text{arcsec}$. top right: The frequency is 0.6 GHz, the spatial resolution is ![]() $34.4\,\text{arcsec}$, and the pixel is
$34.4\,\text{arcsec}$, and the pixel is ![]() $11.5\,\text{arcsec}$. bottom left: The frequency is 1.2 GHz, the spatial resolution is
$11.5\,\text{arcsec}$. bottom left: The frequency is 1.2 GHz, the spatial resolution is ![]() $17.7\,\text{arcsec}$, and the pixel is
$17.7\,\text{arcsec}$, and the pixel is ![]() $5.9\,\text{arcsec}$. bottom right: The frequency is 2 GHz, the spatial resolution is
$5.9\,\text{arcsec}$. bottom right: The frequency is 2 GHz, the spatial resolution is ![]() $10.3\,\text{arcsec}$, and the pixel is
$10.3\,\text{arcsec}$, and the pixel is ![]() $3.4\,\text{arcsec}$. The black patch in the lower panel shows the beam shape.
$3.4\,\text{arcsec}$. The black patch in the lower panel shows the beam shape.

Figure 16. The range of signal to noise ratio (SNR) over the 10 active regions (a ~ j) in the cleaned maps with different phase errors and different frequencies. The phase errors of the upper two panels are antenna-based, the phase errors of the lower two panels are baseline-based. The errors of (a), (c) follow the Gaussian distribution, the errors of (b), (d) follow the Uniform distribution.
Table 5. The signal to noise ratio (dB) of the different regions (a ~ j) with different frequencies.

Table 6. The signal to noise ratio (dB) of the different regions (a ~ j) with different integration time. The frequency is 0.4 GHz.

5 CONCLUSION
MUSER will be used to obtain solar radio images with a range of science issues (flare science, coronal mass ejections, solar energetic particles) over a wide frequency range in the decimetric to centimetric wave range, it will also play an important role in space weather studies. Here we have discussed three different array configurations: T-array, Y-array, and MUSER-I, and MUSER-I has a more uniform uv points distribution with the azimuth than the other two. The image fidelity with different frequencies of MUSER-I are almost better than that in the other two arrays. In order to know the dynamic range that MUSER-I can achieve, we considered the point source and the extended source with active regions. We also do some simulations with a typical phase error which has different types and different distributions. The results almost consistent with theoretical requirements. The simulations of flagging some antennas give us an impression of the considerations that must be taken into account in observing to achieve its scientific goals. From the flag simulations, we found that it is important to guarantee the short distance antennas work well in the daily observation, especially for the quiet sun observation. The simulations with CASA based on the actual solar models, give us an impression of the imaging power that MUSER-I will deliver.


