INTRODUCTION
Quality improvement (QI) using analytic methodology is rarely encountered in the emergency medicine literature and may be poorly understood by the emergency medicine research community.
Traditional research methodology familiar to most emergency physicians most often uses approaches that can be described as “enumerative studies.”Reference Deming 1 , Reference Moen, Nolan and Provost 2 Enumerative studies are focused on an estimation through sufficient sampling from a contained source, not dissimilar to assessing water quality in a pond.Reference Wheeler and Chambers 3 In these studies, the purpose and actions are focused on the material (patients in clinical research) being studied, although typically in standard research the information derived is extrapolated more generally to other settings and future practice. In such studies, the timing of the sampling is generally less important than having a sufficient sample size for the power required to answer the question posed.
QI, by contrast, frequently uses methods known as analytic studies. These methods have the explicit aim to take action on the process or cause-system that produced the outcomes of interest, with the intent being to improve practice in the future.Reference Wheeler and Chambers 3 Here data are sampled from a frame that changes over time; thus, to continue the water quality analogy further, in this situation data are sampled not from a pond but rather from a flowing river.
Although controversial, proponents of analytic methodology argue that, for research questions aimed at evaluating a change in a process of care, these methodologies are preferred for their applicability to understand future performance, as opposed to the estimation of a current situation.Reference Deming 1 , Reference Provost 4
The purpose of this study was to apply QI design and analysis techniques comparatively to an existing data set from a previously published enumerative study on the application of the Ottawa ankle rules (OAR) by emergency department (ED) triage nurses.Reference Wailliam, Filiatrault and Abu-Laban 5 We hypothesized that the use of QI analytic methodology would lead to an improved understanding of the effect of the study intervention and an earlier detection of a treatment effect compared with the standard methodology used in the original study.
METHODS
Data source and statistical approach
We used data from a previously published randomized controlled trial (RCT) carried out by our group on triage nurse-initiated radiography using the OAR.Reference Wailliam, Filiatrault and Abu-Laban 5
QI analytic tools were applied to the data set from this study, in particular, control charts (also known as Shewhart charts, developed in 1924 by Walter A. Shewhart – American physicist, engineer, and statistician) and evaluated comparatively against the standard research methodology of the original study.
The Research Ethics Board (REB) approval from the University of British Columbia was obtained for the original study and was waived by the REB for this secondary analysis.
Background on original study and control charts
The objective of our original study was to determine the effect of triage nurse-initiated radiographs using the OAR on ED length of stay (LOS). This prospective study was carried out as an enumerative studyReference Deming 6 and used an RCT design. The interpretation of LOS results relied upon classical statistical methods, specifically changes in median and mean LOS and their associated p-values.Reference Deming 1 The original study enrolled 146 patients over 11 months and concluded that “triage nurse-initiated radiograph using the OAR is accepted by both nurses and patients and led to a statistically significant decrease of 20 minutes median and 28 minutes mean ED LOS at a tertiary care centre.”Reference Wailliam, Filiatrault and Abu-Laban 5
One of the primary reasons that the original study was done prospectively and used an RCT was to control for possible confounders “due to the dynamic nature of the ED patient volume and staffing and numerous interventions at the study location . . . all of which have the potential to significantly affect our primary outcome (ED LOS).”Reference Deming 6
An alternative method is the use of control charts, which are QI analytic instruments commonly used in a wide range of fields prior to their more recent introduction in medicine. Some of the many uses of control charts include QI of products and services in the automobile, aviation, and high-technology industries.Reference Deming 6 , Reference Nicolay, Purkayastha and Greenhalgh 7 Control charts are time-series charts, with a foundation in statistical principles, and provide a visual understanding of whether or not processes are stable and predictable.
Control charts have four main features (Figure 1) – data displayed over time, a centre line (average), upper control limit (UCL), and a lower control limit (LCL). The control limits represent three sigma limits calculated from the data, which are analogous to three standard deviations.
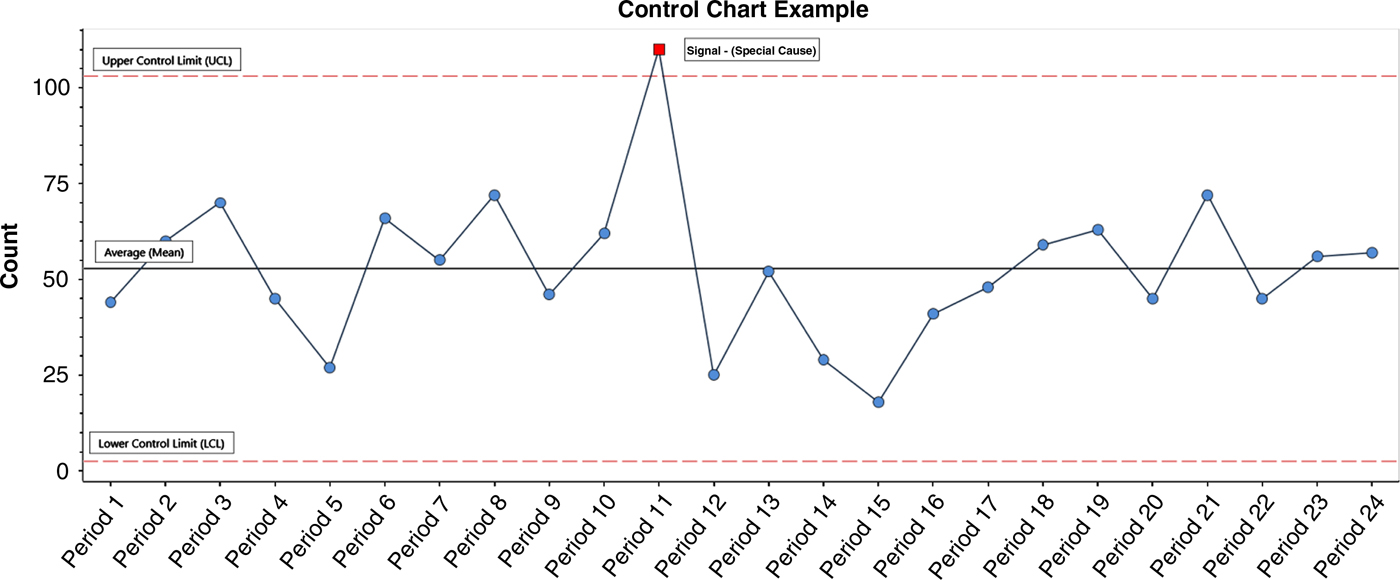
Figure 1. Control Chart Example: Count or measurement of interest plotted sequentially for periods 1–24.
When a process has data falling between the UCL and LCL and with no unusual distribution patterns, it is said to be stable (predictable). This is known as a system of common cause variation, whereby any variation is inherent or built into the system or process itself. On occasion, points may either occur beyond a control limit or may present specific patterns of distribution, indicating that the data are unusual as defined by pre-set rules with a foundation in statistics(Box 1).
Box 1. Shewhart’s rules of interpretation of special cause variation
Rules for Determining a Special CauseReference Provost and Murray 8
1. A single point outside the control limits.
2. A run of eight or more points in a row above (or below) the center line.
3. Six consecutive points increasing (trend up) or decreasing (trend down).
4. Two out of three consecutive points near (outer one-third) a control limit.
5. Fifteen consecutive points close (inner one-third of the chart) to the center line.
Datapoints fulfilling any of these rules indicate that the process contains what is known as a special cause variation that is a distribution that is not simply accounted for by the inherent variation of the process. When a process is performing predictably (within a range), it provides a rational basis for determining future performance. Further, this predictability provides a basis for learning the effects of changes. Specifically, this highlights the importance of investigating and learning from special cause variations when signals appear in an otherwise stable process. The findings may reveal a particular intervention associated with improved performance in the system of interest, ultimately helping refine the final intervention/change introduced.
Considerations on variation in current study
In the current study, there are many factors that could be expected to form part of the system of common causes contributing to the variation in the LOS. These include expected variations of the daily census, speed of the specific providers working on a given day, and the number of X-rays requested around the same time. An example of special cause variation would be ED radiology equipment problems that required emergency patients to have their imaging done in another part of the hospital, farther away but also alongside the inpatient population. The new diagnostic imaging bottleneck arising from such an event would then create a special cause variation.
RESULTS
We started in the same manner as the original study by examining the entire data set of both the control group (Figure 2) and the intervention group (Figure 3). Control charts show information as it is acquired over time, thus preserving (rather than combining) the longitudinal nature of the data obtained.Reference Provost 4 , Reference Shewhart 9 The approach contrasts with the original analysis where the order of appearance of data was irrelevant to the analysis that was used.
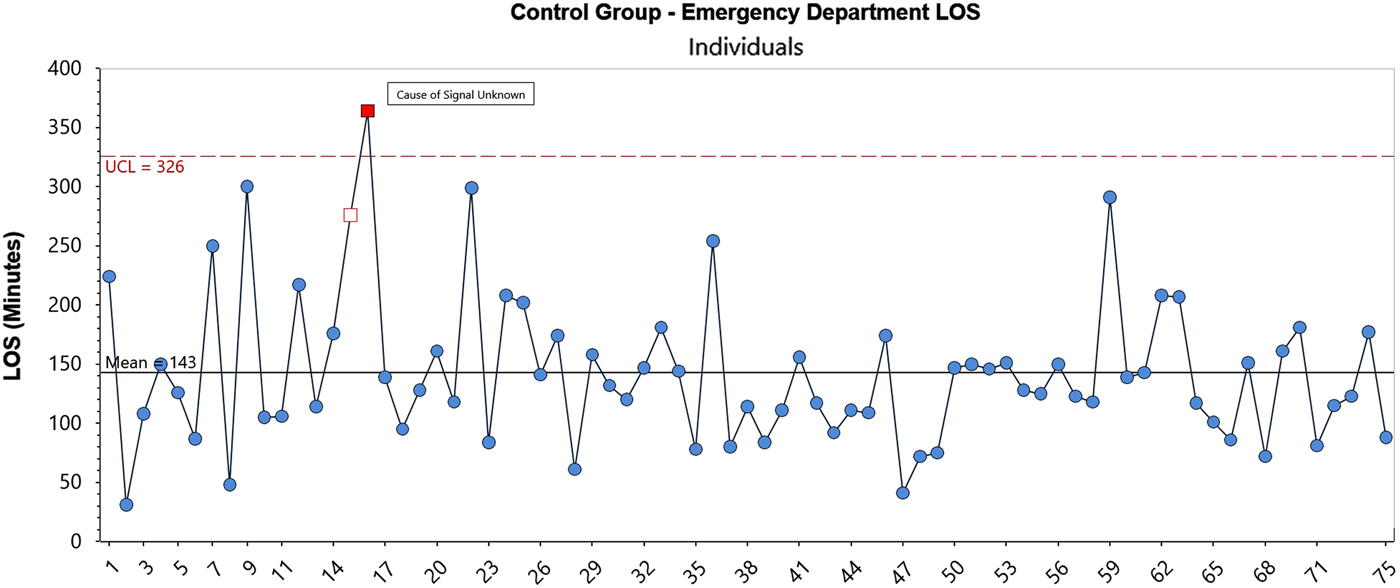
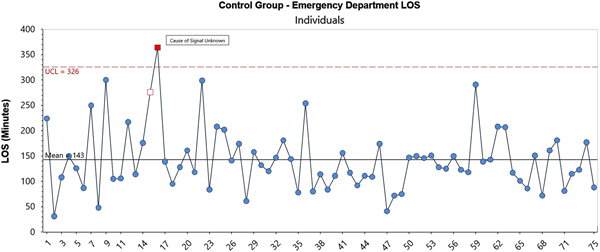
Figure 2. Control Chart: EDLOS in minutes for Control Group, patients 1–75.
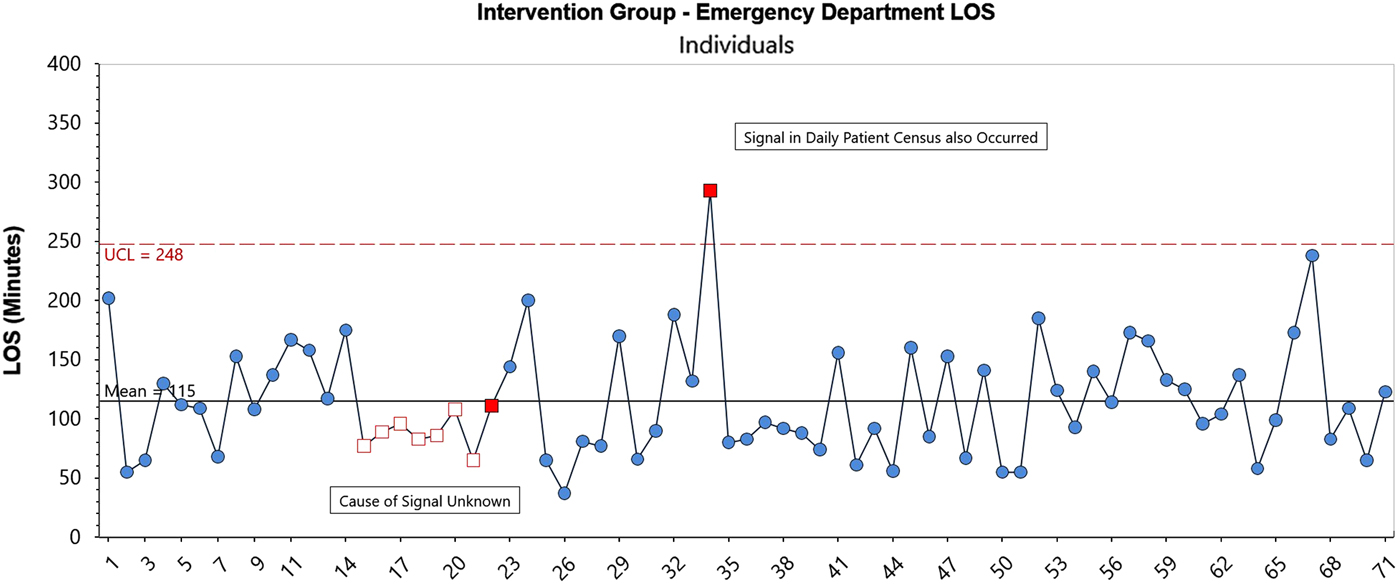
Figure 3. Control Chart: EDLOS in minutes for OAR Intervention Group, patients 1–71.
The control group data display for the most part a statistically stable system, with one instance of a special cause (red box). The source of the special cause was not identified. The system is predictable with an expected mean average ED LOS of 143 minutes and an expected upper limit LOS of 326 minutes.
The intervention group also appears to be performing predictably with two exceptions – a run of eight points below the average and a point above the UCL. The latter point coincided with a spike in the number of ED patient visits (census) on that day. In a discussion with the research team, the cause of the eight-point run was not determined. An important concept in analytic studies is to learn from signals like these in close to real time. Our post-hoc analysis resulted in an inability for the team to discover the reason(s) behind this positive signal.
Overall, however, the intervention group system appears to be performing predictably, with the noted exceptions. It has an expected mean average ED LOS of 115 minutes and an expected upper limit LOS of 248 minutes.
From the preceding analysis, we replicated the original study’s finding of a 28-minute reduction in mean ED LOS for those in the intervention group, 115 minutes versus 143 minutes.
Although our initial analysis followed the same approach as the original study, that is, we used all of the data at once, this is not as informative as when an evaluation is done prospectively, nor is it necessarily even ideal. Data in QI initiatives are more commonly used for learning in real time. A baseline level of performance is first determined, and then new data are viewed as they occur to determine whether an improvement happens after a specific intervention. This real- or near-real-time approach avoids wasting time and resources pursuing inherent and expected variation in the system, and helps identify datapoints that truly require investigating.Reference Chrusch and Martin 10
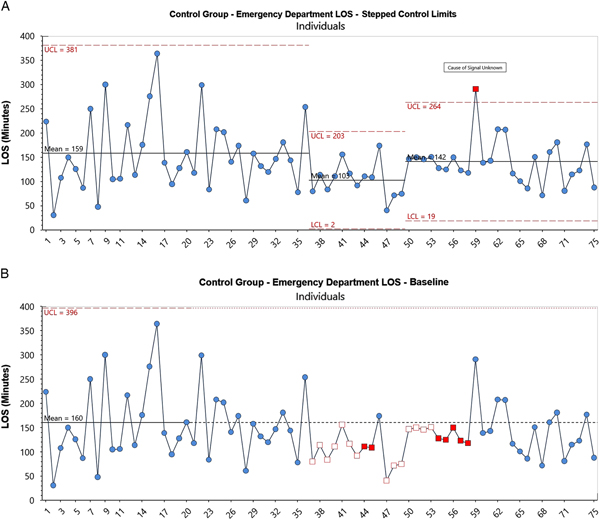
Using the previously mentioned approach, we viewed the first 20 patients of the control group as a “baseline” then extended those limits to determine how the balance of the control group performed.
When compared to a baseline of the first 20 control group cases, Figure 4 illustrates a period of “better” performance beginning at point 37 until point 58, based on rule #2 (eight points above/below the centre line).Reference Provost and Murray 8 No explanation was determined for this difference. When an apparent change has occurred, it is common practice to re-compute the centre line and the limits.Reference Provost and Murray 11 The result is shown in Figure 4-A, which has “stepped control limits.” This shows the expected performance of the new system going forward. Further literature about expected performance in analytic methodologies exists for readers who desire a more detailed understanding of this.Reference Wheeler 12 The expected mean ED LOS performance in the future is shown to be 142 minutes with an upper range LOS of 264 minutes.
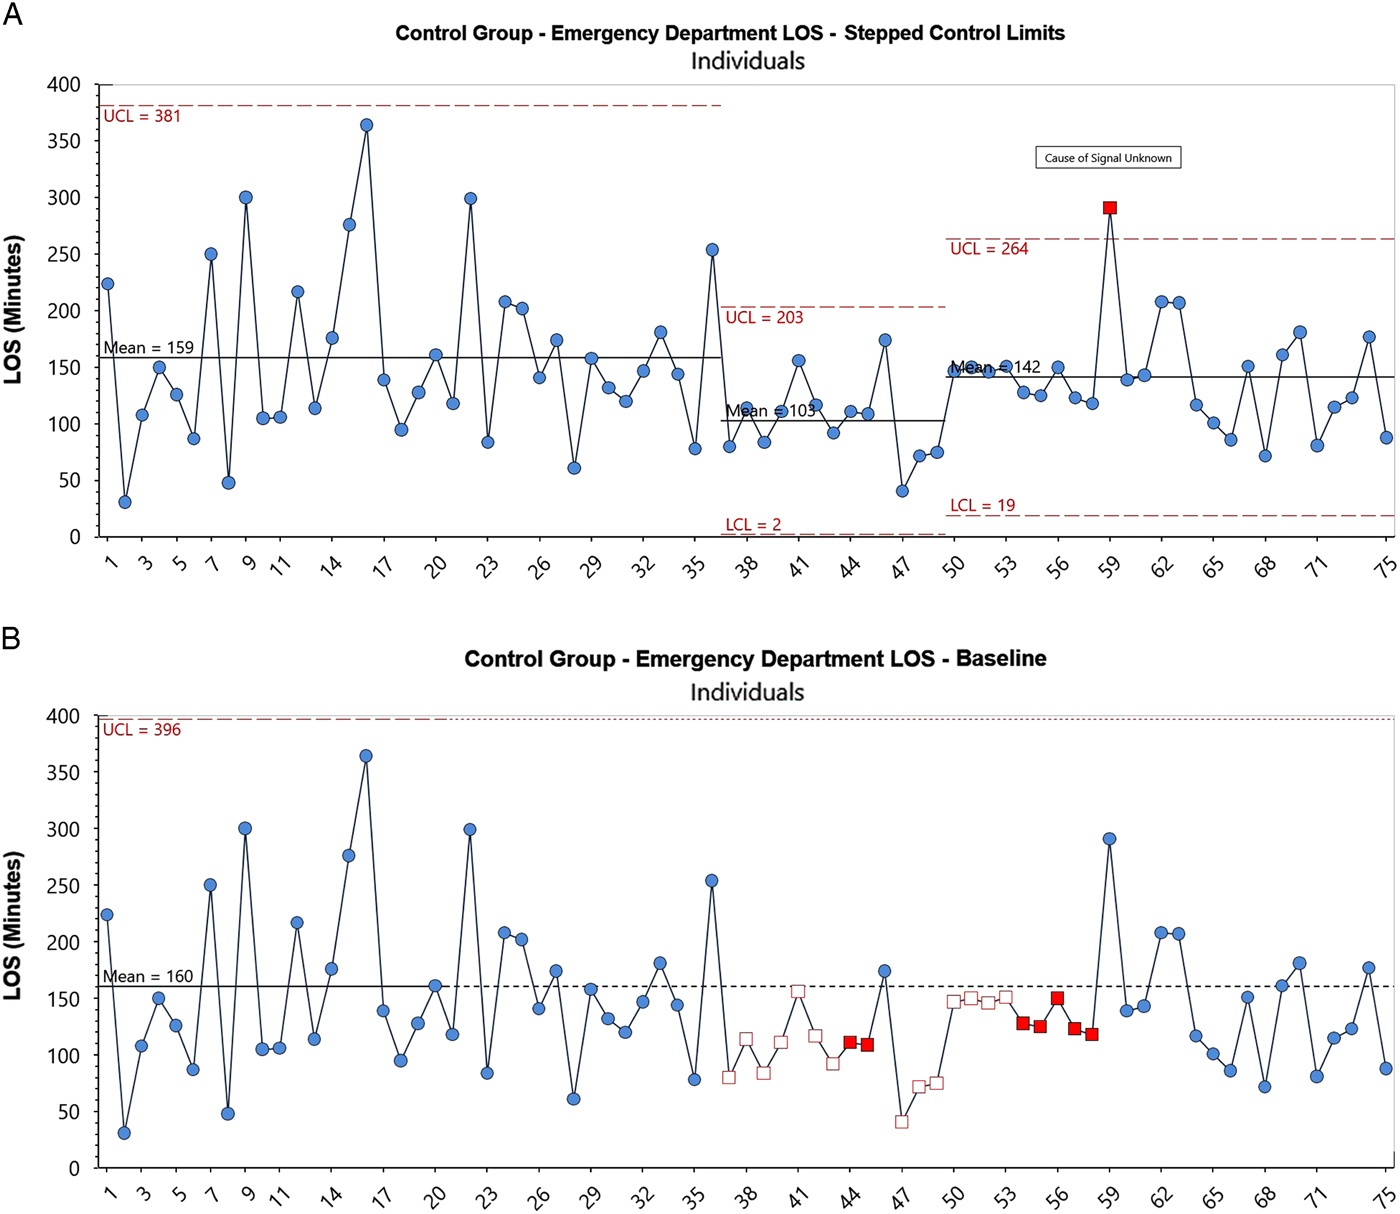
Figure 4. (A) Control Chart with extended limits: EDLOS in minutes for Control Group, with Control patients 1–20 providing baseline performance for the Control Group. (B) Control Chart with stepped control limits: EDLOS in minutes for Control Group, with Control patients 1--20 providing baseline performance for the Control Group.
Next, we refined our analysis to help further address the question: Was the intervention likely to result in a different level of performance in the future? To address this, we compared the baseline performance as indicated by the control group at the beginning of the study followed by the intervention group performance. We used the first 20 patients of the control group to represent the baseline performance. We then examined the performance of the intervention group starting at patient 21 (the next patient in time order). This approach had the important advantage of preserving the time sequence of the original data. Other analyses, such as using the entire control group as a baseline, would negate this fundamental principle.
Figures 5 and 5-A indicate that, when using the control group to represent baseline performance, a new level of performance (better) would have been seen after 22 intervention patients (February 20) based on control chart rule #2 (a run of eight or more points in a row above [or below] the centre line). Further signals are evident through to patient 51, based on the same rule (Figure 5).Reference Shewhart 9 The improved performance shown by the intervention group appears to continue for the balance of the study (Figure 5-A). The system thus appears to be statistically stable (predictable) with an expected mean average ED LOS of 112 minutes and an expected upper limit LOS of 244 minutes.
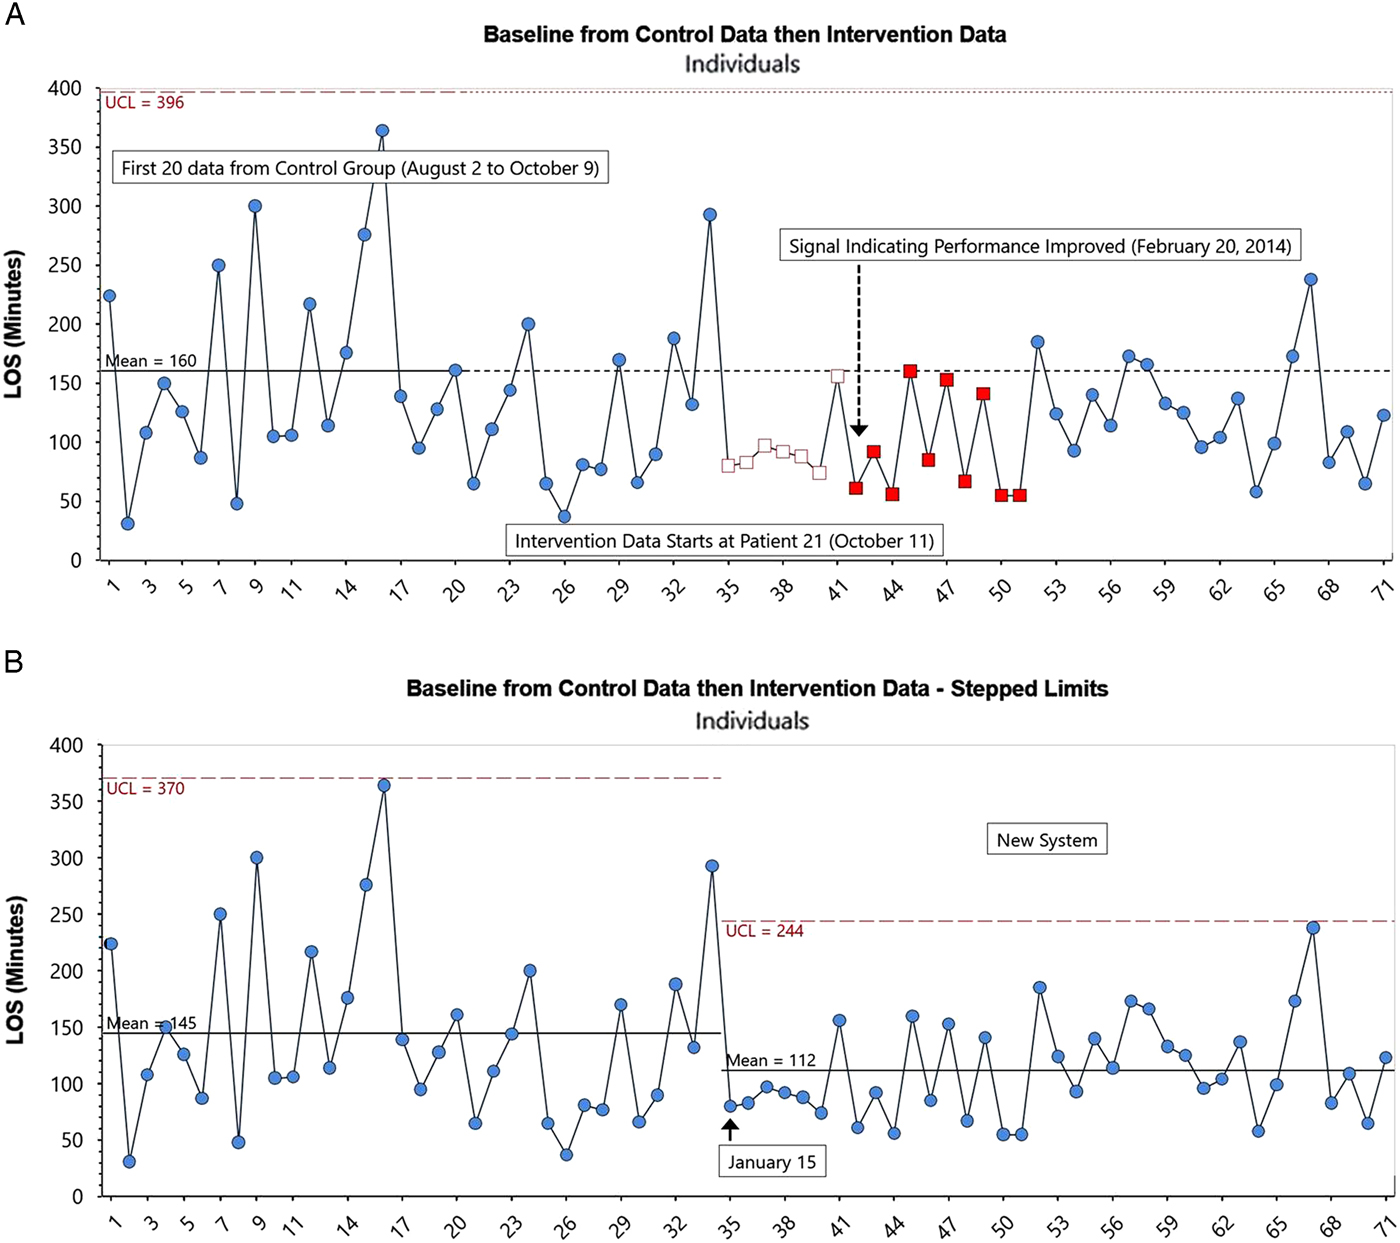
Figure 5. (A) Control Chart with baseline data (EDLOS in minutes) from control group (patients 1--20) followed by OAR intervention group EDLOS for patients 21--71. (B) Control chart with Stepped Limits: baseline data (EDLOS in minutes) from control group (patients 1--20) followed by OAR intervention group EDLOS for patients 21--71.
From this analysis, it can be concluded that the OAR intervention resulted in improved LOS during the study, and argued that this improvement would likely continue into the future.
DISCUSSION
In our original study, we used a parallel group RCT design in large part to address the possibility that confounders (such as variations in staffing and scheduling, or other secular trends) could interfere with accurately attributing any reduction in ED LOS to the intervention being studied if other methods such as a pre/post design were applied. The original study had a fixed hypothesis intended to minimize bias and potential confounders. By contrast, QI interventions start with an hypothesis that is expected to be modified through iterative rolling plan-do-study-act (PDSA) cycles. As a result, the final intervention may in fact be quite different from that derived from the original hypothesis.
Typically, in QI, testing occurs across a whole range of conditions to determine how these interact with the intervention and ultimately improve or disprove belief in the validity and generalizability of the effect of the intervention. Modifications to the intervention are then made accordingly to ensure that the final version is “effective” in the environment in which it will be implemented. Not paying close attention to the local environment and context likely accounts for many research results that are ultimately not reproducible in the “real world,” underscoring the important distinction between effectiveness and efficacy.
Although many RCTs use interim analyses, typically for the purposes of assessing harm but sometimes for the purposes of assessing benefit, with the exception of infrequently used adaptive clinical trials, most do not allow for the continual interpretation of data as the data are obtained. The dynamic method of continuous interpretation used in control charts provides a different basis for predicting future performance than classic statistical significance testing and p-values.Reference Wailliam, Filiatrault and Abu-Laban 5 , Reference Ziliak and McCloskey 13 , Reference Wasserstein and Lazar 14
Similar to a census, the original study allowed a valid description, specifically an estimate of the number of patients seen in the ED with blunt ankle injuries and the comparative mean and median ED LOS for those treated with the intervention and the control. However, beyond description, our goal was to better understand the impact of our intervention to see whether it would likely lead to improvement in the future. In other words, our purpose was not to take action on existing patients but instead to improve the system to affect future patients. This is a key distinction, because some would argue that an analytic methodology would have been more appropriate to apply under such circumstances. Beyond this, our results suggest that the improvement found in the original study would have been detected sooner if baseline data were available prior to the beginning of the study and QI analytic methodology had been used.
This comparative analysis demonstrates some of the potential benefits of applying QI methodology for evaluating a change in a process of care, using a case study of an intervention widely known to emergency physicians. Our results illustrate that if a QI approach had been used in the original study, the insights regarding the benefit of nurse-initiated radiography using the OAR would have been achieved earlier, and thus potentially at a lower cost if the study had been stopped earlier as a result, than in the original study. Beyond this, in situations where the overarching aim is to accelerate the implementation of practice improvement to benefit future patients, we believe that increased consideration should be given to the use of QI analytic methodology.
LIMITATIONS
There are limitations to the comparative analysis that we carried out. Our findings would have been more compelling if 2 to 3 months of baseline data had been available prior to the introduction of the intervention. Although there are no rules on the size of baseline data set prior to introducing an intervention, the selection of an appropriate baseline period should be guided by evidence of a stable system as well as subject matter experts – those who understand both the inherent process variability and the burden of data collection. As such, the number of control patients chosen for the baseline in Figure 4, 5, and 5-A followed deliberations that suggested 20 data collected over a 10-week period would be a reasonable representation of the current system. The original system was indeed stable prior to introducing the intervention, as evidenced in Figure 4 until datapoint 37. Our approach is also supported by standard QI methodology and the use of a Shewhart chart.Reference Provost and Murray 15
Ideally, we would have modified the study to record baseline data and then apply the OAR at triage to all eligible patients without the need for a control group. In our current analysis, approximately half of the presenting patients after October 15, until a signal occurred on February 20, were used to populate the control group. In this revised design, all of the patients in sequence would be in the intervention (OAR) group from the beginning of the intervention, thus avoiding a two-tier design of control versus OAR. If such an approach had been used, the improvement may have been easier to detect and may also have been detected sooner.
As noted previously, we were not using the data to learn in real time and thus potentially missed an opportunity to discover the source of the special cause signal, which occurred early in the intervention. It can be difficult or even impossible to determine the source of a special cause long after a signal occurs. Here, the importance of subject matter knowledge, in addition to statistical understanding, cannot be understated. People working in a system have an intimate, deep understanding of the local conditions that may be affecting the outcomes under study. In the case of the previously mentioned special cause, had the reason for the signal been identified close to real time by those providing patient care, knowledge could perhaps have been applied to reduce LOS even further.
CONCLUSIONS
This comparative analysis demonstrates some of the potential benefits of applying QI analytic methodology for evaluating a change in a process of care, using a case study of an intervention widely known to emergency physicians.
We believe that the analytic approach of QI has a number of potential benefits, as follows:
∙ Quantification of performance for both the control and intervention groups
∙ Ability to indicate whether performance is predictable (statistically stable)
∙ Ability to identify whether a change has occurred based on accepted rules of control chart interpretation
∙ A built-in feedback loop for learning if changes result in improvements
∙ Provision of a rational basis for action
In emergency medicine research situations where the overarching aim is to accelerate implementation of practice improvement to benefit future patients, we believe that increased consideration should be given to the use of QI analytic methodology.
Acknowledgements
We acknowledge the leadership of Dr. Wailliam Lee, the Principal Investigator (PI) of the original study we undertook, and thank him for his support and encouragement in undertaking this secondary analysis. We are also grateful to Clifford L. Norman of Associates in Process Improvement (API) for his input in earlier versions of this paper.
Competing interests
None declared.