


Introduction
Earmarks – congressionally mandated spending for specific projects – have long fascinated congressional scholars due to their traceability to individual members of Congress, their influence in passing legislation, and the signals they send about congressional power structures. But earmarks were presumed to no longer influence policy outcomes in 2020, because Congress placed a moratorium on inserting earmarks into legislation in 2011. Legislators continued to seek out particularistic spending in their district in the absence of earmarks, but they did so by communicating directly with bureaucratic leaders (Mills and Kalaf-Hughes Reference Mills and Kalaf-Hughes2015; Mills et al. Reference Mills, Kalaf-Hughes and MacDonald2016; Kalaf-Hughes and Mills Reference Kalaf-Hughes and Mills2016). In addition to seeking out particularised benefits in new ways, I argue that the earmark moratorium led legislators to preserve and extend previous earmarks that benefited their constituents.
The last time earmarks were written into federal surface transportation legislation was the 2005 law (SAFETEA-LU), which authorised highway programme funding through 2009. Congress passed multiple surface transportation authorisations under the earmark moratorium, meaning the direct influence of earmarking over policy outcomes ended in 2009 with the expiration of SAFETEA-LU earmarks. However, the funding “formulas” established by all post-2009 surface transportation bills are based solely on the percentage of total highway allocation each state received in the preceding year. Effectively, the state allocation percentages set in FY 2009, inclusive of earmarks, were locked in place and continued to dictate highway funding through 2020. This article examines the resulting influence of SAFETEA-LU earmarks over highway funding from 2010 to 2020, as they were institutionalised into the frozen funding formula.
The frozen highway funding formula and continuous payout of old earmarks from 2010 to 2020 offer a useful window for exploring the institutionalisation of previous earmarks during the moratorium. I examine whether the influence of institutional earmarks over policy outcomes grew, contracted, or stayed even during the decade after the earmarks officially expired. I argue that SAFETEA-LU earmarks are meaningfully associated with changes in malapportionment – the over-funding and under-funding of states – from 2010 to 2020. While the original earmarked projects were based on local and state needs in 2005, the continued payout of earmark funds for previously completed projects likely exacerbated highway funding malapportionment. Rather than fading away under the earmark moratorium, I argue SAFETEA-LU earmarks increased in policy significance during the earmark moratorium.
I utilise earmark data, the SAFETEA-LU federal highway funding formula, and state-level highway statistics to clarify the relationship between institutional highway earmarks and 2010 to 2020 highway funding malapportionment change. To operationalise malapportionment change, I construct multiple measurements of state-level highway programme malapportionment and calculate the change in state funding malapportionment between 2010 and 2020. I find SAFETEA-LU earmarks are positively associated with highway funding malapportionment change from 2010 to 2020. By continuously paying out to states for previously completed projects, the institutionalised 2005 earmarks increased in policy significance during the earmark moratorium. To rule out the possibility that 2010–2020 highway malapportionment change is a function of differences between states rather than institutional earmarks, I repeat the analysis for the period in which the SAFETEA-LU funding formula and earmarks were active (2005–2009) and find no such relationship between earmarks and malapportionment change. When the funding formula is unfrozen and earmarks represent active community needs, earmarking levels are unassociated or negatively associated with malapportionment change.
This article makes two contributions to the literature on budgetary policy and distributive politics. First, it adds to a growing line of research on how government spending outcomes are shaped by the nature of lawmaking in the United States Congress. For instance, extant research finds a small state funding advantage (Lee Reference Lee2000) and shows how Congress modifies bureaucratic decision-making tools to shape distributive politics outcomes (Mills Reference Mills2013). I advance this line of research by revealing how Congress can use funding formulas to institutionalise funding disparities between states. Second, this article advances the literature on distributive politics by detailing the failure of the earmark moratorium to rid highway spending of earmarks. The primary finding paints a picture of congressional particularistic spending as alive and well, though more hidden from public view, under the earmark moratorium. In the case of federal highway funding, the victors of the earmark moratorium were previous pork winners, not porkbusters aiming to root out particularistic spending.
Congressional earmarks
Previous research examines the dynamics of congressional earmarking and the role earmarks play in the policymaking process. The literature on congressional earmarks generally fits into three categories: earmarks’ electoral benefits, the determinants of earmark distribution among members of Congress, and earmarks’ utility in building legislative coalitions.
Earmarks logically connect to Mayhew’s (Reference Mayhew1974) conception of credit claiming, and extant research speaks to the nature, magnitude, and conditionality of earmarks’ electoral value. Earmarks decrease the likelihood of electoral challenge and increase campaign contributions (Bickers and Stein Reference Bickers and Stein1996; Rocca and Gordon Reference Rocca and Gordon2013), but the electoral benefits of earmarking are conditional on successful credit claiming and the relevance of earmarked projects to constituents (Grimmer et al. Reference Grimmer, Messing and Westwood2012; Braidwood Reference Braidwood2015). Additionally, Lazarus et al. (Reference Lazarus, Glas and Barbieri2012) find only Democrats reap the electoral benefits of earmarking.
Another branch of research focuses on the determinants of earmark distribution among members of Congress, thereby shedding light on congressional power structures. Membership and leadership on key committees – such as appropriations – are associated with increased access to earmarks (Shepsle and Weingast Reference Shepsle and Weingast1987; Lazarus Reference Lazarus2009; Clemens et al. Reference Clemens, Crespin and Finocchiaro2015). Additionally, partisanship influences earmark distribution. Members of the majority party are advantaged when it comes to securing earmarks (Lazarus Reference Lazarus2009; Balla et al. Reference Balla, Lawrence, Maltzman and Sigelman2002; Clemens et al. Reference Clemens, Crespin and Finocchiaro2015). Finally, earmark distribution patterns vary between the House and the Senate (Lee Reference Lee2003, Reference Lee2004; Lazarus and Steigerwalt Reference Lazarus and Steigerwalt2009), and interchamber balancing shapes the overall distribution of earmarks (Shepsle et al. Reference Shepsle, Van Houweling, Abrams and Hanson2009).
A third branch of research casts earmarks as a tool for legislative coalition building, highlighting earmarking’s utility as a policy instrument. Earmarks “grease the wheels” of Congress for coalition leaders to pass general interest legislation, such as highway authorisations, appropriations bills, and trade agreements (Evans Reference Evans2004). For instance, Lee (Reference Lee2003) finds earmarks to be a critical coalition-building tool used to push the 1998 federal highway authorisation bill through the House.
The House Republican Conference in the 113th Congress altered the role of congressional earmarks by placing a moratorium on all earmark requests, and the earmark moratorium remained in place from 2010 to 2022 (Gordon Reference Gordon2018). Recently, after a surge in calls for bringing back earmarks and reconstituting congressionally directed spending (Hudak Reference Hudak2018; NYT Reference NYT2020; Courser and Kosar Reference Courser and Kosar2021), the 117th Congress restored congressionally directed spending. Arguments for restoring congressional earmarks highlight earmarks’ legislative value as bipartisan coalition-building tools, their negligible budgetary cost, and their ability to address local needs (Evans Reference Evans2004; Crespin et al. Reference Crespin, Finocchiaro and Wanless2009; Lazarus Reference Lazarus2010; Strand and Lang Reference Strand and Lang2018).
What happens when re-election-focused members of Congress lose the ability to legislatively mandate federal spending projects in their districts? An innovative line of research from Mills, Kalaf-Hughes, and MacDonald shows that legislators seek out particularistic benefits in other ways (Mills and Kalaf-Hughes Reference Mills and Kalaf-Hughes2015; Kalaf-Hughes and Mills Reference Kalaf-Hughes and Mills2016; Mills et al. Reference Mills, Kalaf-Hughes and MacDonald2016). Specifically, members of Congress replace earmarking with letter-marking – “when members of Congress explicitly ask (in writing) the head of an administrative agency to retain or allocate distributive benefits in their districts” (Mills and Kalaf-Hughes Reference Mills and Kalaf-Hughes2015, 36). In addition to direct communication with agency leaders, I argue that legislators may seek to protect and extend previous earmarks to ensure the continuation of distributive benefits in their districts. While legislators could not mandate new projects in legislation under the earmark moratorium, they could endeavour to protect existing particularistic funding sources by institutionalising previous earmarks.
Earmarks and federal highway funding policy
Universal demand for highway funding among states means that members of Congress share the desire to bring home transportation funding. “Every state and every congressional district has roads, highways, and bridges and has members of Congress who take an interest in these funds” (Lee Reference Lee2004, 189). As such, earmarks have historically played a central role in the passage of surface transportation authorisation laws that shape federal highway funding (Adler Reference Adler2002; Lee Reference Lee2003; Evans Reference Evans2004). Additionally, major surface transportation laws were passed both before and after the earmark moratorium, making federal highway finding an ideal policy venue for examining what happened to particularistic spending under the earmark moratorium.
Long-term surface transportation authorisations have historically established policy goals, specified the funding formulas to achieve such goals, and mandated funding for special projects. Formula-based grants to the states are foundational to federal highway funding policy and comprise a large proportion of funds authorised in highway-aid legislation; such grants made up more than 90% of highway funding and allocated over $40 billion to states in 2018 (Kirk Reference Kirk2019). As such, the federal highway funding formula is consequential policy that shapes the nation’s infrastructure system.
Federal aid to states for highway construction and maintenance began in 1916 with the Federal aid Road Act (Lewis et al. Reference Lewis, Davis and Grossman2019). Funding formulas have shifted throughout the programme’s history as Congress has set new federal highway policy priorities, but factors that vary over time – such as population, federal highway miles, and Highway Trust Fund contributions – have historically dictated the allocation of federal highway funds to the states (Kirk Reference Kirk2019).Footnote 1 In 2005, Congress passed the Safe, Accountable, Flexible, Efficient Transportation Equity Act: a Legacy for Users (SAFETEA-LU), the last highway authorisation bill to establish funding formulas based on time-varying formula factors. SAFETEA-LU allocated $244 billion to the states through FY 2009 and notoriously established over $20 billion in earmarked projects over the five-year authorisation (Fischer Reference Fischer2005).Footnote 2 After the SAFETEA-LU authorisation expired in 2009, Congress passed a series of short-term funding extensions until the three-year Moving Ahead for Progress in the 21st Century Act (MAP-21) was passed in 2012, followed by the five-year Fixing America’s Surface Transportation Act (FAST Act) in 2015 (Kirk Reference Kirk2019). MAP-21 and FAST are long-term authorisations, but the funding “formulas” in MAP-21 and FAST are based solely on the percentage of total highway allocation each state received in the preceding year. Effectively, the state allocation percentages set in FY 2009 – the last year of SAFETEA-LU – were locked in place and continued to dictate highway funding in 2020 (Lewis et al. Reference Lewis, Davis and Grossman2019). Functionally, MAP-21 and FAST are more like extensions than new authorisations.
The last year in which the funding formula relied on time-varying formula factors, 2009, acts as the sole determinant of highway apportionment for all subsequent years. Funding in 2009 followed the SAFETEA-LU allocation formula and was populated by 2007 data. Therefore, federal highway funding to the states in 2020 was based on a law passed in 2005 and the state of the country in 2007. The only aspect of the highway funding that relied on current data in 2020 was a rule that each state must be allocated at least 95 cents for every dollar it contributes to the Highway Trust Fund (HTF), and Texas is the only state to trigger this requirement (Lewis et al. Reference Lewis, Davis and Grossman2019). The decision to include earmarks in the 2009 state allocation percentages, rather than rely strictly on the funding formula, ensured the continued policy relevance of SAFETEA-LU earmarks. The $20 billion in SAFETEA-LU earmarks (spread out evenly from 2005 to 2009) accounted for over 8% of the total authorisation. In sum, federal highway programme funding to the states in 2020 was effectively determined by the state of the country in 2007 and SAFETEA-LU earmarks written in 2005. The expired earmarks continued to impact each state’s level of highway funding through 2020, perennially advantaging states whose congressional representatives fought for extra projects in 2005.
Theoretical expectations
The federal highway funding formula has not drawn on time-varying formula factors data since fiscal year 2009, likely leading to a significant degree of malapportionment – some states receiving more (or less) than they should be based on real-world circumstances and transportation policy goals. My central theoretical claim is that SAFETEA-LU earmarks are positively associated with the growth of malapportionment under the earmark moratorium. While the earmarks originally stemmed at least partially from funding needs, their inclusion in the federal highway formula after 2009 is not grounded in anything besides legislative manoeuvring. In other words, SAFETEA-LU earmarks better-reflected policy goals and state needs in the period of their authorisation (2005–2009) than the period after they expired (2010–2020). Lawmakers in 2005 had no way of knowing that their earmarking efforts would continue to pay out for a decade after the earmarks’ scheduled expiration, making it unlikely that 2005 earmarking involved long-term policy planning. As such, the relative advantage certain states received via SAFETEA-LU earmarks was enhanced by the institutionalisation of the earmarks into the frozen funding formula.
An example of how earmarks could fuel malapportionment change helps clarify the theory. Fatalities on the federal aid system in each state are a time-varying factor in the SAFETEA-LU funding formula, as such fatalities indicate a need for highway improvements. All else equal, states with more fatalities received greater highway funding under the SAFETEA-LU formula. Similarly, earmarks provide additional funding for states to improve surface transportation, thereby enhancing highway safety. Assuming a state uses earmark projects and funding to improve its highways, fatalities can be expected to fall. This decrease in fatalities would trigger an update in the SAFETEA-LU funding formula, meaning a highly earmarked state would eventually receive less formula funding due to the earmarks addressing demand for highway safety funding. However, under a frozen funding formula with institutionalised earmarks, a reduction in fatalities does not trigger a decrease in earmark funding or formula funding. Over time, highly earmarked states are expected to experience fewer fatalities relative to other states due to extra funding. Their relative demand, therefore, decreases with time, yet their relative funding remains elevated. In other words, if the SAFETEA-LU funding formula was reactivated in 2020 with its time-varying formula factors, it would show that highly earmarked states received far more than the formula called for relative to lowly earmarked states.
Therefore, I hypothesise that the amount of SAFETEA-LU earmarks a state was awarded in 2005 is positively associated with malapportionment change from 2010 to 2020. Highly earmarked states experienced positive malapportionment change – receiving increasingly more than their fair share. Conversely, states with relatively few SAFETEA-LU earmarks experienced negative malapportionment change, receiving increasingly less than their fair share. Rather than fading in policy significance over time, SAFETEA-LU earmarks increased in influence during the earmark moratorium.
Data and measurements
Testing the claim outlined above requires operationalising two central concepts: SAFETEA-LU earmarking levels and highway funding malapportionment change. The Federal Highway Administration provides transparent figures for SAFETEA-LU earmarks at the state level, as such figures were used in the computation of post-2009 highway funding apportionment. However, a dollar value of earmarks does not accurately operationalise the concept of state earmarking advantage. States vary in size and other characteristics, meaning the equal dollar apportionment of earmarks would not represent equality among states. I operationalise “level of earmarking” by calculating the percentage of each states’ fiscal year 2009 highway authorisation that is composed of earmarks (earmark dollars/total FY 2009 authorisation dollars × 100).
An alternative, and more common, measure for earmarking is earmark dollars per capita. Allocation per capita is a useful measure in the distributive politics literature (Lee Reference Lee2000, Reference Lee2004), and earmark dollars per capita fits the “level of earmarking” concept. However, I argue that earmarks as a percentage of highway funding are a better measure for the analysis below, as population does not map cleanly onto state demand for highway funding. A large state with many highway miles likely requires more funding than a small state with the same population. Earmark dollars per capita would classify the two states as equal if they received the same number of earmark dollars, masking the difference in demand for funding. Rather than rely on a single characteristic – population – to scale earmarks for states, earmarks as a per cent of highway funding are based on the entire funding formula. State population is included in the funding formula and therefore contributes to the measure, but so do the other state-level factors that determine highway funding. I use earmarks as a per cent of highway funding in the analysis below, but replacing the measure with earmarks per capita does not meaningfully change the results (see Online Appendix).
Highway funding malapportionment change is based on the idea that funding outcomes have drifted from policy goals since the funding formula was frozen at 2009 funding levels. Funding malapportionment is the difference between how much highway funding a state would have received in a given year with an unfrozen funding formula and how much it actually received. Highway funding malapportionment change from 2010 to 2020, therefore, is the degree to which a state benefited or suffered from the funding formula being frozen for over a decade. A state that experienced population growth and increasing highway usage between 2010 and 2020 suffered from the frozen formula, as increases in highway funding demand were not met with increased highway funding relative to other states. A state that experienced population decline and decreasing highway usage between 2010 and 2020 benefited from the frozen formula, as decreases in highway funding demand were not met with decreased highway funding relative to other states. I operationalise highway funding malapportionment change in three steps: I create state-level measures of “correct” highway funding using time-varying formula factors, I construct malapportionment measures by comparing the “correct” spending measures with how much states actually received, and I calculate changes in state malapportionment between 2010 and 2020.
I define “correct” state highway funding as the amount of federal highway funding each state would receive in a given year if allocation was based on longstanding policy goals and updated time-varying formula factors. The funding formula has changed multiple times throughout history as transportation policy goals change, meaning there is no consensus measure. However, the funding formulas used to determine highway funding up until the formula was frozen in 2009 rely on similar time-varying formula factors. As such, a valid measure of “correct” federal highway spending in each state must be based on time-varying formula factors that have historically shaped the allocation of highway funds. I collect recent state-level data on time-varying formula factors and construct two defensible measures of “correct” funding.
First, I recreate the SAFETEA-LU funding formula – the last formula to use time-varying formula factors – with 2010 and 2020 data. I collect state-level data for all time-varying formula factors included in the SAFETEA-LU formula from the Department of Transportation for both 2010 and 2020. Using this data to recreate the multifaceted SAFETEA-LU funding formula is made possible by the Eno Center for Transportation’s efforts to recreate the SAFETEA-LU formula for 2018. “The SAFETEA-LU era apportionments use data factors that are readily available and relatively straightforward to calculate” (Lewis et al. Reference Lewis, Davis and Grossman2019, 30), and researchers at the Eno Center created a publicly available excel-based tool that computes each state’s highway apportionment under the SAFETEA-LU formula. Using total highway apportionment figures as baselines and time-varying formula factors as inputs, the Eno tool weights the data according to the SAFETEA-LU formula and calculates each state’s apportionment. Using Eno’s SAFETEA-LU formula template and my collected data on 2010 and 2020 time-varying formula factors, I calculate each states’ formula-derived apportionment for 2010 and 2020. For instance, if the $38 billion allocated for highways in 2010 was allocated under the SAFETEA-LU formula with 2010 state-level data, Alabama would have been allocated $707 million.
The “correct” counterfactual, therefore, is that the highway funding formula used from 2005–2009 continued to determine funding allocations in 2010 and 2020. This allows for a precise measure of “correct” funding that reflects recent transportation policy goals, though it includes a few assumptions and adjustments to the original SAFETEA-LU formula. For instance, the Eno tool is based purely on time-varying formula factors, meaning it excludes the equity bonus payments programme, which was inserted into SAFETEA-LU to engender political support from reluctant members of Congress.Footnote 3 However, because my aim is to generate valid measures of “correct” appropriations rather than stay true to the original SAFETEA-LU formula, I consider the removal of a political variable from the formula as an improvement.
For an alternative “correct” funding measure, I record each states’ yearly Highway Trust Fund (HTF) contribution for 2010 and 2020.Footnote 4 State return on HTF contributions has long been at the centre of federal highway funding considerations and is a highly consequential time-varying formula factor (Lee Reference Lee2003; Kirk Reference Kirk2019). HTF contribution is a limited measure of “correct” funding because it ignores all other time-varying formula factors, but it makes for an easily interpretable alternative measure with high face validity – the metric is often used in debates over proposed highway funding formulas to determine which states are advantaged and disadvantaged. As such, I use HTF contribution as a robustness check on the primary analysis.
To create measures of state highway funding malapportionment, I compare the amount a state received in highway programme funding with their “correct” funding measures for that year. I create both a ratio (actual/correct) and difference (actual – correct) malapportionment measure for each “correct” funding measure. Because Alabama actually received $759 million in 2010 rather than the $707 million called for by the formula, Alabama has a ratio malapportionment score of 1.07 and difference malapportionment score of $52 million for 2010. Finally, I use the malapportionment measures to construct the dependent variable for analysis – malapportionment change. This is achieved by calculating the change in state malapportionment from 2010 to 2020 for each of the malapportionment measures. Positive values indicate positive malapportionment change and negative values indicate negative malapportionment change over time. Alabama’s ratio malapportionment score of 1.07 in 2010 sunk to 1.03 in 2020, yielding a − 0.04 malapportionment change score. Meaning, Alabama was slightly less advantaged by the frozen funding formula in 2020 than in 2010. Distributions of the two malapportionment change measures used in the primary analysis are shown in Figure 1.

Figure 1. Density plots of 2010 to 2020 malapportionment change measures.
Source: United States Department of Transportation.
Methods
Based on the theory outlined above and the observed data generation process, I estimate two models to explore the relationship between SAFETEA-LU earmarks and state malapportionment change. To test the claim that SAFETEA-LU earmarks positively predict malapportionment change during the formula freeze period, I model the two SAFETEA-LU-based measures of state malapportionment change as a function of the Per cent Earmarks variable and a list of state-level covariates that are likely to effect state highway funding needs: population (logged), federal aid highway miles (logged), and vehicle miles travelled on federal aid highways (logged).Footnote
5
These covariates are included in the model to account for differences between states that plausibly effect highway funding malapportionment. Because highway funding was locked in under the frozen formula, possible confounding variables are those that plausibly impact demand for highway funds rather than variables that ordinarily impact spending, such as natural disasters or shifts in party control of Congress. The dependent variable, 2010 to 2020 malapportionment change, is distributed according to the normal distribution with mean, $\mu $
, and variance,
$\mu $
, and variance, ${\sigma ^2}$
. I model
${\sigma ^2}$
. I model $\mu $
as a function of the matrix of state-level covariates and a vector of coefficients
$\mu $
as a function of the matrix of state-level covariates and a vector of coefficients $\beta $
, to be estimated from the data:
$\beta $
, to be estimated from the data:
 $$y \sim {f_N}(\mu ,{\sigma ^2})$$
 $$\mu = \chi \beta $$
where $y$
represents state malapportionment change,
$y$
represents state malapportionment change, $\chi $
represents the matrix of state covariates,
$\chi $
represents the matrix of state covariates, $\beta $
represents the estimated coefficients, and
$\beta $
represents the estimated coefficients, and ${\sigma ^2}$
is a measure of assumed constant variance.
${\sigma ^2}$
is a measure of assumed constant variance.
Due to the presence of outliers in the data, I employ robust linear regression to generate coefficient estimates. Next, I use the model estimates to predict values of malapportionment change across the full range of the Per Cent Earmarks variable. To capture the uncertainty around these model predictions, I simulate from the full distributions of $\beta $
coefficients and generate confidence intervals around the predicted malapportionment values.
$\beta $
coefficients and generate confidence intervals around the predicted malapportionment values.
Results
Consistent with expectations, I find SAFETEA-LU earmarks are a positive predictor of state malapportionment change from 2010 to 2020. Table 1 displays the coefficient estimates and standard errors for the two models. The mean coefficients for the Per Cent Earmarks variable are positive across both models and reach conventional levels of statistical significance in the ratio model (p-value < 0.01). Meaning, states that received high levels of SAFETEA-LU earmark funding benefited from highway funding malapportionment change between 2010 and 2020. The earmarks technically expired in 2009, but their influence over highway funding policy outcomes grew in the decade after their expiration. These findings do not change when using the alternative independent variable measure – earmarks per capita – or dependent variable measure – return on HTF contribution.Footnote 6
Table 1. Earmarks and highway funding malapportionment change: 2010–2020
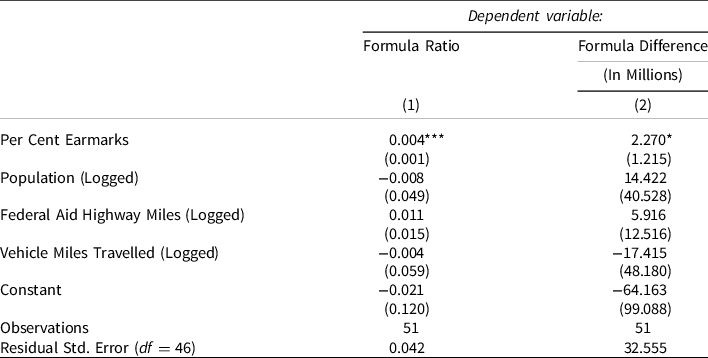
Note: Robust Linear Regression.
*p < 0.1; **p < 0.05; ***p < 0.01.
To clarify the magnitude and uncertainty of the relationship between earmarks and malapportionment change, I use the regression coefficients to simulate predictions of 2010 to 2020 malapportionment change across the entire observed range of the Per Cent Earmarks variable. I simulate 1,000 state malapportionment predictions for each hypothetical value of the Per Cent Earmarks variable at 0.1 increments from 3.24% (lowest observed value in the data) to 35.64% (highest observed value). The simulation draws from the entire distribution of betas generated by the model, thereby capturing model uncertainty across the counterfactual range of earmark values. Figure 2 displays the simulation results with a 95% prediction interval band for both models.
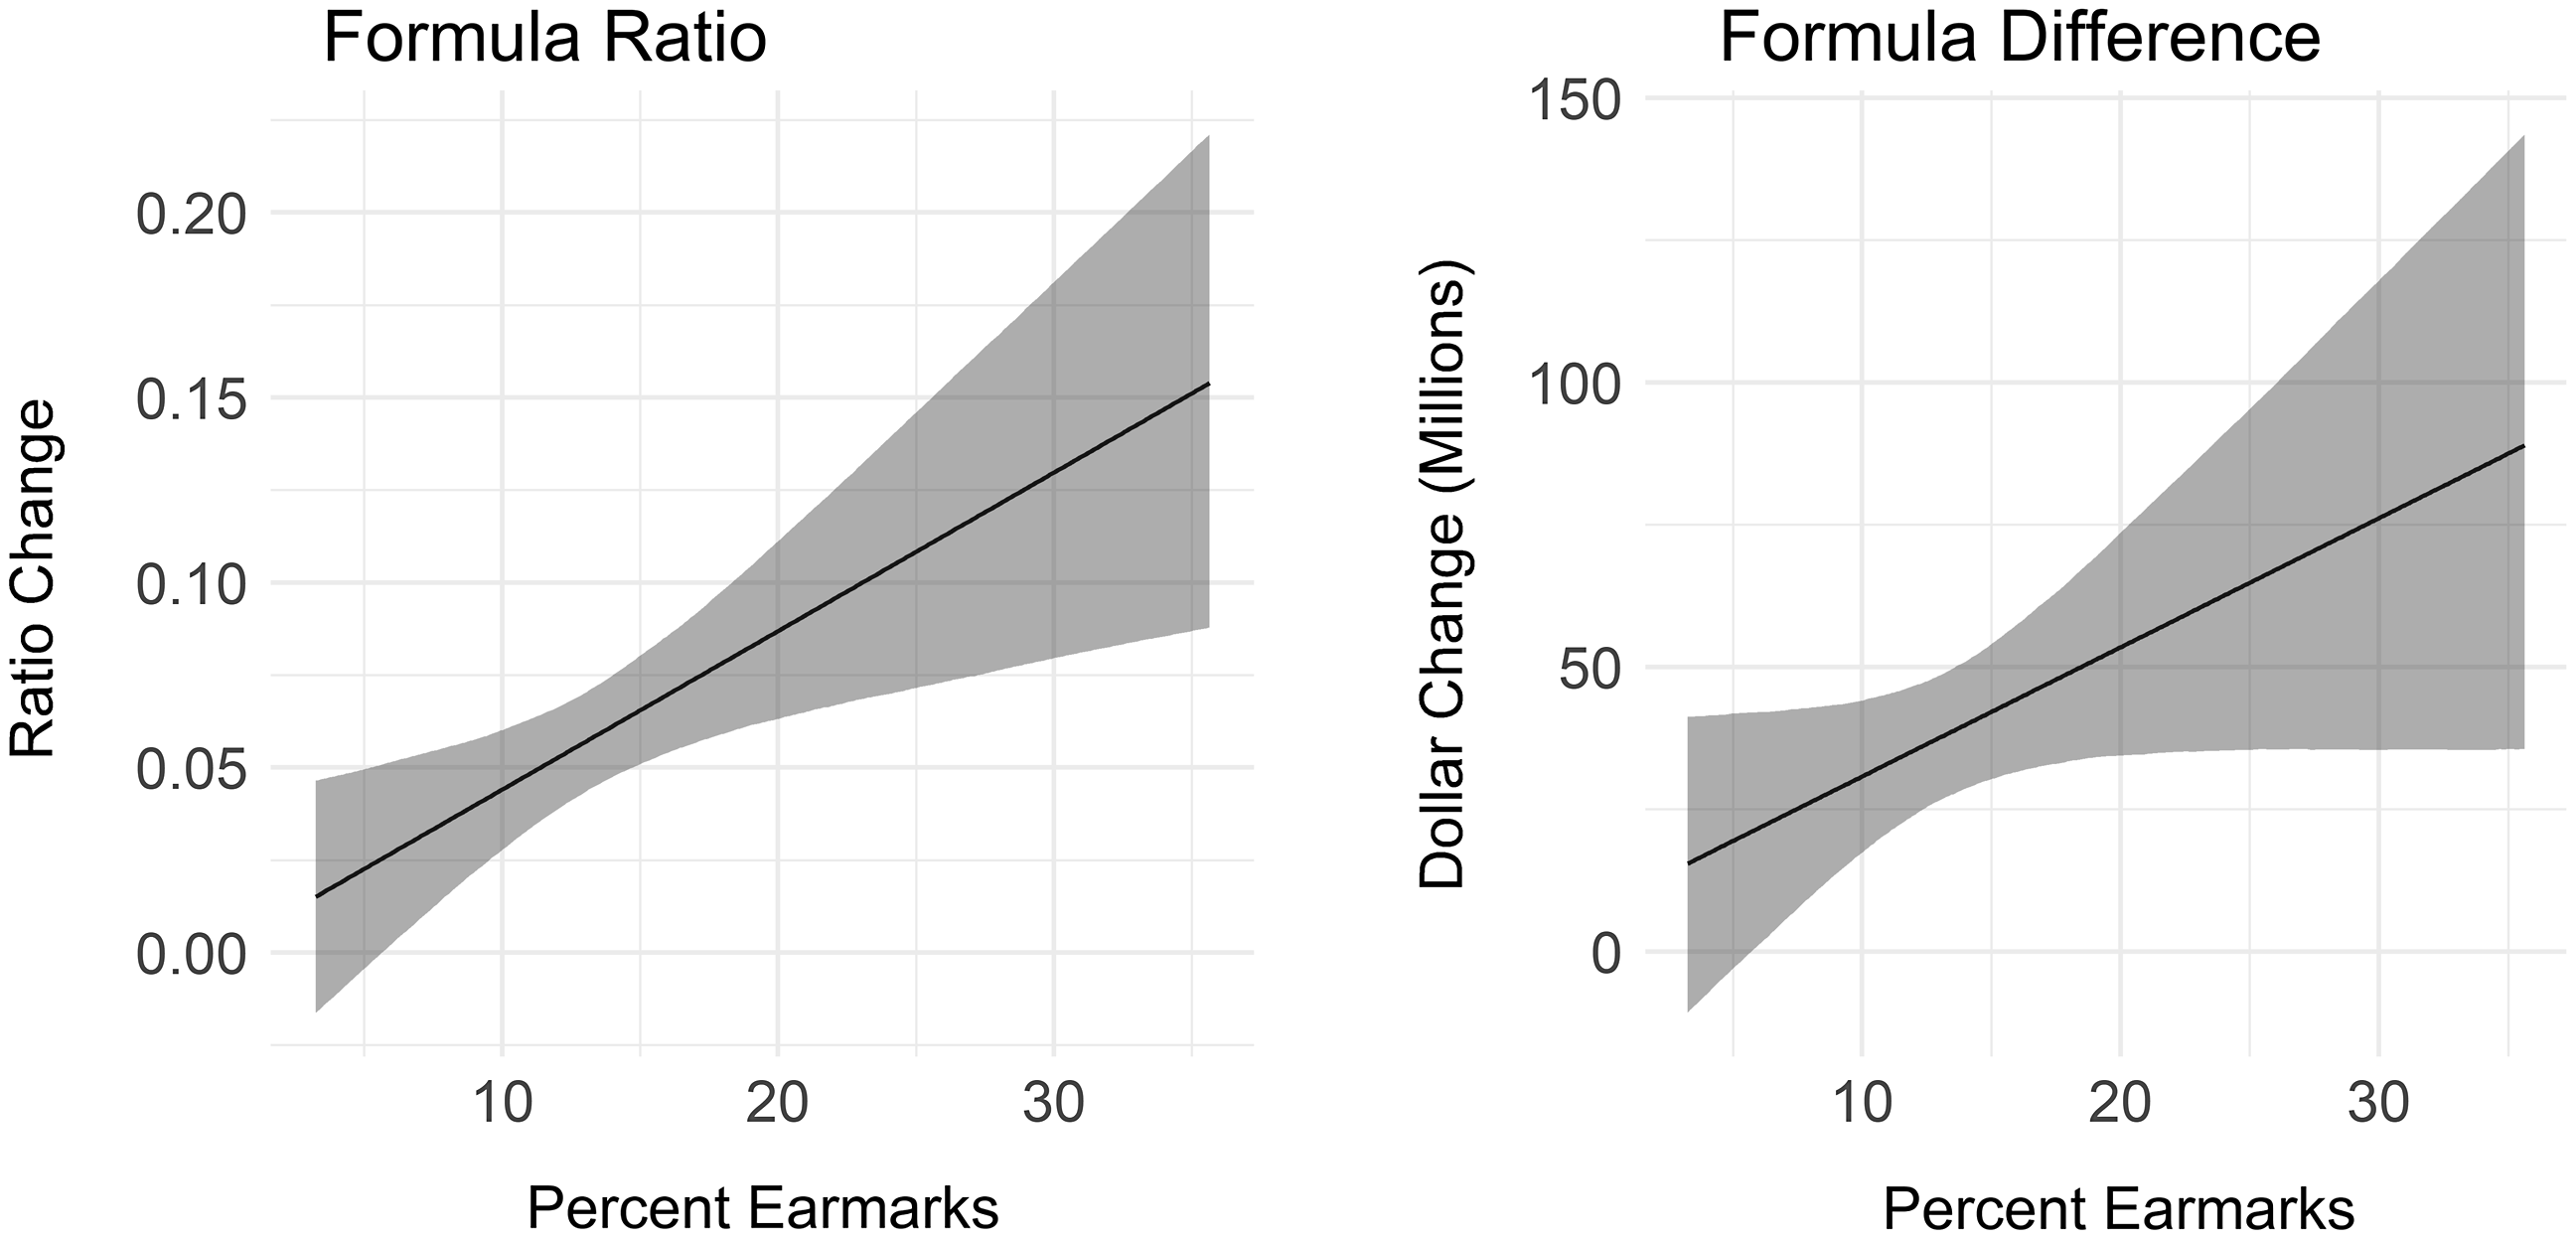
Figure 2. Predicted state malapportionment change by the level of earmarking.
The findings displayed in Figure 2 are substantively meaningful, and an interpretation of results from the Formula Ratio model contextualises the observed relationship between institutionalised earmarks and malapportionment change in terms of 2020 highway funding. A mean-sized state whose 2009 highway apportionment was made up of 8.9% earmarks (first quartile value) is predicted to receive approximately $0.04 more per formula prescribed dollar in 2020 than in 2010, whereas a mean-sized state whose 2009 highway apportionment was made up of 16.7% earmarks (third quartile value) is predicted to receives $0.07 more per formula prescribed dollar in 2020 than in 2010. For a state with the mean formula prescribed highway allocation in 2020 ($850,388,124), the difference between a 0.07 ratio increase and a 0.04 ratio increase is $25,511,644. In sum, the effects of institutionalised earmarks on highway funding malapportionment change carry significant distributive policy consequences.
Placebo test: 2005–2009 malapportionment change
I argue above that SAFETEA-LU earmarks became disassociated with state need and policy goals as they continued to pay out long after their intended use, resulting in a positive relationship between SAFETEA-LU earmarks and highway funding malapportionment change. The advantage states received from their congressional representatives securing high levels of SAFETEA-LU earmarks grew under the frozen formula, as they continued to receive earmark money long after the earmarked projects concluded. I find support for this theory above – earmarking levels positively predict federal highway funding malapportionment change from 2010 to 2020.
However, it remains possible that the reported relationship stems from unobserved differences between states affecting both earmarking and malapportionment change. Adding controls for observable variables that might affect earmarking and malapportionment change – population, federal aid highway miles, and vehicle miles travelled on federal aid highways, 2009 total highway funding, and region of the country – does not change the reported findings, but it is impossible to control for all potential confounding variables. To test this confounding concern and strengthen my empirical claims, I employ a placebo test to explore whether the relationship between earmarking and malapportionment change exists during an era with active earmarks and an unfrozen funding formula. That is, when the dynamics that I argue lead to a positive relationship between earmarking and malapportionment change are not present, does a state’s level of earmarking still predict highway funding malapportionment change?
I examine highway funding malapportionment change during the SAFETEA-LU period (2005–2009). Highway funding in this period included a formula that used yearly time-varying formula factors, and earmark spending in this period was on active projects deemed worthy of funding in 2005. If the relationship between earmarking and malapportionment change is the result of unobserved differences between states, we would expect to observe a similarly positive relationship between SAFETEA-LU earmarks and malapportionment change from 2005 to 2009. Alternatively, if the above findings are attributable to institutionalised earmarks driving malapportionment change during the earmark moratorium, we should not observe a positive relationship between SAFETEA-LU earmarking and 2005 to 2009 malapportionment change. I argue that institutionalised earmarks under the frozen funding formula are the driving force behind the positive association observed above, so I expect that there is not a meaningfully positive association between earmarking and malapportionment change from 2005 to 2009.
The Formula Ratio and Formula Difference measures of malapportionment change cannot be used for this analysis, as they are derived directly from the SAFETEA-LU funding formula. Therefore, they are incapable of detecting malapportionment change during the SAFETEA-LU period. However, the two Highway Trust Fund measures of malapportionment change can be replicated for the 2005 to 2009 period. Similar to the SAFETEA-LU funding formula analysis, earmarking is a significant and substantial predictor of malapportionment change in both the HTF Ratio and HTF Difference models (see Online Appendix for further discussion of this analysis). Using the same data sources and measurement scheme for all variables used in the earlier analysis, I replicate the HTF Ratio and HTF Difference models with 2005 to 2009 malapportionment change as the dependent variable. The first two columns of Table 2 display the 2005 to 2009 analysis of HTF measures, while the third and fourth columns display the 2010 to 2020 analysis of HTF measures for reference.
Table 2. Earmarks and highway funding malapportionment change: placebo test

Note: Robust Linear Regression.
*p < 0.1; **p < 0.05; ***p < 0.01.
Inconsistent with the confounding hypothesis, results reported in Table 2 show no evidence of a positive relationship between SAFETEA-LU earmarks and 2005 to 2009 highway funding malapportionment change. The mean coefficient for the Per Cent Earmarks variable is negative in both models and statistically distinct from zero in the HTF Difference model. Therefore, the substantially positive association between institutionalised earmarks and 2010 to 2020 malapportionment change cannot be cast aside as a spurious relationship based on differences between states, because no such relationship existed in the period preceding the formula freeze. In an era where earmarks reflected current community needs and the funding formula was updated yearly based on time-varying formula factors, the association between earmarking and malapportionment change is nonexistent or negative.
It is worth noting that the placebo window (2005–2009) is substantially shorter than the window used in the analysis above (2010–2020). As such, it is not a perfect placebo test, because it remains possible that the shorter window did not allow enough time for the relationship between earmarking and malapportionment change to emerge. However, that the coefficient for the Per Cent Earmarks variable is negative in both models and statistically distinct from zero in one model helps mitigate this concern. Further, the negative association between earmarking and malapportionment change from 2005 to 2009 is robust to model specification. When replacing the independent variable with earmark dollars per capita, the association between earmarking and malapportionment change is negative and statistically significant in both models (see Online Appendix for results). The placebo time window is shorter, but the relationship between earmarking and malapportionment change appears to be meaningfully different in the SAFETEA-LU period than in the frozen formula period.
In sum, the placebo test adds credibility to findings from the primary analysis on the positive association between institutional earmarks and malapportionment change. The combined analysis does not establish causality, as the research design is unable to rule out all alternative explanations and omitted variables. However, these findings offer a detailed description of an important policy moment and suggest a meaningful relationship between institutional earmarks and malapportionment change.
Conclusion
Federal highway earmarks officially expired in 2009, yet they continued to influence highway funding policy outcomes in 2020. Their institutionalisation into the frozen funding formula ensured their continued policy relevance. Further, the earmarks’ association with funding malapportionment strengthened between 2010 and 2020. I find robust evidence of a positive association between earmarks and malapportionment change under the frozen funding formula. States that were advantaged in the 2005 earmarking process became even more advantaged after the earmarks were institutionalised into the frozen highway funding formula in 2010.
Three central takeaways emerge from these findings to inform our understanding of the United States Congress and budgetary policy. First, these findings add to the diverse and growing body of research on how government spending outcomes are shaped by the nature of lawmaking in Congress. For instance, Lee (Reference Lee2000) finds that small states are advantaged in distributive politics due to the Senate’s equal weighting of states, and Mills (Reference Mills2013) shows how Congress modifies bureaucratic decision-making tools, such as benefit-cost analysis calculations, to shape distributive politics outcomes. The above analysis contributes to this line of research by revealing how Congress can use funding formulas to preserve particularistic benefits and institutionalise funding disparities between states.
Second, public policy researchers document the punctuated equilibrium nature of budgetary policy change – characterised by long periods of stability and major punctuations – stemming from institutional friction (Jones et al. Reference Jones, Sulkin and Larsen2003; Breunig et al. Reference Breunig, Koski and Mortensen2010). This article identifies frozen funding formulas as a mechanism of institutional friction in congressional distributive politics and highlights institutional earmarks as one way in which funding outcomes can drift away from policy goals over time.
Third, this analysis advances the literature on congressional representation by detailing the failure of the earmark moratorium to rid transportation policy of earmarks. A long literature conceives of earmarks and particularistic spending as foundational to congressional representation (Mayhew Reference Mayhew1974; Bickers and Stein Reference Bickers and Stein1996; Lazarus Reference Lazarus2010) and lawmaking (Lee Reference Lee2003; Evans Reference Evans2004). As such, the earmark moratorium is a potential disruption to extant research on Congress and deserves scholarly attention. Recent research shows that members of Congress did not stop seeking particularistic benefits under the moratorium, but instead changed tactics to less visible strategies, such as letter-marking (Kalaf-Hughes and Mills Reference Kalaf-Hughes and Mills2016; Mills et al. Reference Mills, Kalaf-Hughes and MacDonald2016). My findings paint a picture of congressional particularistic spending as alive and well, though more hidden from public view, under the earmark moratorium.
However, this analysis is limited in that it only explores the institutionalisation of earmarks into in federal highway funding, one specific form of spending policy. The policy implications discussed above are consequential even if limited to highway funding – SAFETEA-LU appropriated $4 billion per year in highway earmarks, while all appropriations earmarks for FY 2009 totalled $19.6 billion (Crespin et al. Reference Crespin, Finocchiaro and Wanless2009) – but whether the concept of institutional earmarks generalises to other policy domains remains an open question. After all, the normal appropriations bills did not freeze funding levels and institutionalise previous earmarks during the earmark moratorium. I argue the concept of institutional earmarks is useful for distributive politics research moving forward, particularly with the return of earmarks to Congress in 2022. First, there are already calls by members of Congress to again eliminate earmarks,Footnote 7 and the potential for institutional earmarks in highway funding and other authorisation legislation looms if Congress eliminates earmarking again. Second, continuing resolutions have become the norm in the congressional appropriations process (McClanahan et al. Reference McClanahan, Bill, Saturno, Murray and Lynch2019), and legislators might look to institutionalise existing earmarks by including them in continuing resolutions. Therefore, examining efforts to institutionalise earmarks in continuing resolutions offers a potentially important next step in distributive politics research.
A few technical limitations of the analysis above are important to note and open the door for further research. First, the structure of the data required analysis with a small number of observations. I show in the Online Appendix that the reported findings are robust to multiple model specifications and measurement strategies, but the small sample size limits the certainty of findings. One avenue for future research is collecting highway funding data over a longer period of time and employing time-series analysis. Additionally, the empirical strategy employed above is unable to make strong causal inferences. The primary analysis reveals a substantive and positive association between a state’s level of earmarking and malapportionment change from 2010 to 2020, and the placebo analysis offers supportive evidence that institutional earmarks fuelled malapportionment change under the frozen funding formula. However, the former statement is more supported by the analysis than the later, and additional research is needed to confirm the causal role of institutional earmarks in malapportionment change. Finally, the nature of federal highway spending necessitated state-level analysis, but earmarks are generally a highly localised form of distributive spending. Further research should delve deeper into earmark spending at the local level to examine whether earmark-derived funds under the frozen highway formula kept flowing to particular counties, thereby exacerbating funding inequality, or were spread out within states.
Supplementary material
To view supplementary material for this article, please visit https://doi.org/10.1017/S0143814X2200037X
Acknowledgments
A previous version of this article was presented at the Annual Meeting of the Southern Political Science Association. I thank Michael Crespin, Charles Finocchiaro, Samuel Workman, Rachel Blum, Nathan Barron, Nicholas Napolio, and the anonymous reviewers for their helpful suggestions.
Data availability statement
Replication materials are available at https://doi.org/10.7910/DVN/WR4S9I.
Conflict of interests
The author declares none.


 Open access