


Contents
-
Section I. Introduction.
-
Section II. Morphological Relationships.
-
Section III. Measurements of Movement and Deformation.
Part I
-
Section IV. Relationships of Stress and Temperature.
-
Section V. Viscosity Relationships in Cold Ice.
-
Section VI. Comparison of Greenland and Alpine Relationships.
Part II
Sections IV, V and VI will appear in the next issue of the Journal.
I. Introduction
The behaviour of an ice cap is of particular interest in relation to Arctic and Antarctic glaciological problems, especially in connection with investigation of the Greenland ice sheet. A favourable opportunity to set about an examination of the stress, movement and temperature relationships in a cold ice cap presented itself in 1950 when for constructional purposes the 50 m. deep ice cap of the Jungfraujoch (3470 m. above sea level) had to be traversed by a 130 m. ice tunnel (Fig. 1, p. 581).

Fig. 1. Aerial photograph of the Jungfraujoch Ice Cap from the North
Since this tunnel would have to be maintained for at least ten years and sensitive installations housed therein, a system of observation tunnels was constructed for reasons of safety and control: these serve above all for the examination of ice movement and of creep in the cold ice.
On the basis of measurements of plastic distortion in ice tunnels of circular cross-section the state of stress and the relationships of plasticity were checked against theoretical calculations. A small ice laboratory served for carrying out loading tests of long duration on the ice in situ. The location of the top layer of rock was successfully established with the aid of hot water borings.
Within the narrow frame of the present paper it is not possible to give a detailed account of the execution and of the results of the research since it was commenced in 1950. Our article is primarily intended to make known the most important results of the last four years, together with an initial orientation of a general nature. The comparisonReference Haefeli and Kasser 1 with earlier research of a similar type in temperate glaciers makes possible a brief survey of the plastic behaviour of cold and temperate ice. Finally, some links with the exploration of the Greenland ice sheet are examined, with particular reference to the results of Expéditions Polaires Françaises of Paul-Émile Victor (1948–51).Reference Bauer 2 , Reference Cailleux 3 , Reference Holtzscherer and Bauer 4
II. Morphological Relationships
The deepest rock depression in the Jungfraujoch has the shape of a saddle, covered by a flat cap of firn and ice, which lies within the permafrost zone. While the southern part of this cap passes over into the Jungfrau firn of the Great Aletsch Glacier and is only separated from it by the bergschrund, towards the north it drops gently down for a distance of about 200 m. as far as the edge of the so-called Plateau, where the tumbling blocks of ice plunge down the steep northern face of the Bernese Alps towards the Guggi Glacier. To the east of the deepest part of the saddle rises the peak of the Sphynx, to the west, the sharp Mathilde ridge, which continues into the east ridge of the Jungfrau. Fig. 1 shows the cap from the north side of the Bernese Alps looking towards the Aletsch Glacier, and Fig. 2 (p. 573) the topography of the firn surface, together with the position of the ice tunnels. In Fig. 3, (p. 575) the most important cross profiles are represented, and for Profile hm. 1.00, the outline of the bedrock in the neighbourhood of the saddle is also given, as ascertained by a series of hot-water borings.

Fig. 2 Longitudinal profile of the Ice Cap at the position of the principle tunnel. (below). Plan of the Ice Cap showing the location of the longitudinal tunnel (L) (principal tunnel), and the cross-tunnels Q100 and Q120. F1 and F2 are window tunnels, S are longitudinal crevasses, B is the southern bergschrund (Jungfraufirn). A, C, and N are boring sites

Fig. 3. Cross-sections through the Ice Cap at three locations shown in Fig. 2 (p. 573), together with diagram (top right) to illustrate the formation of the central blue band at the division of movement
As can be seen from the diagrams, a succession of typical longitudinal crevasses were encountered when the tunnels were being dug: as a rule, these -extend neither to the surface of the firn, nor to the rock base, but are sealed interglacially both above and below. The biggest of these crevasses was struck on 8 October 1950 at hm. 0.85 by the main or longitudinal tunnel, which was climbing westwards at a gradient of about 12 per cent towards the Mathilde. Since this crevasse S 1 was filled with water to a level about 1.5 m. above the ceiling of the tunnel, a dangerous outburst of water followed. This poured out on to the Jungfrau firn through a gallery, F2, set at the lowest point in the tunnel: in parts, the tunnel was filled to the ceiling with water. The crevasse was about 50 m. long and at its widest 10 m. across, and its deepest point lay about 33 m. below the firn surface: it was bridged by a solid covered-in wooden gallery, and when work recommenced, borings were carefully made so as to avoid an unexpected outburst of water.
The shape and position of the crevasse S can be seen in longitudinal section or plan in Fig. 2 and in separate cross-sections in Fig. 4 (p. 575). From the lamella-shaped deposits of ice, observed at various levels, it is quite clear that in earlier times the crack was filled with water as far up as reference line 3450. Excluding the southern bergschrund (B), three other longitudinal cracks were encountered during the making of the two cross-tunnels Q100 and Q120: their form can be seen in figures 3, 6 and 7. All these cracks were filled with water above the height of the tunnel and had to be drained off. The smallest, only 16 cms. wide, was struck during the construction of the cross-tunnel Q120 at 03.00 hr. on 8/2/53, at a distance of 13.4 m. from the main tunnel, whereupon there appeared at the breast of the tunnel a hole about 10 cms. across, through which water at 0° C. poured out at a rate of 5 or 6 litres a minute. At 15.15 hr., after a sharp report, the strong noise resulted in an increased flow of water. The air temperature in the tunnel was −3° C., outside it was about −30° C. and the ice temperature in the cross-tunnel was estimated at .−2° or −3° C.

Fig. 4. Various profiles of Longitudinal Crevasses S1 (c.f. Fig. 2)
From November 1953 until June 1954 the cross-tunnel Q100, illustrated in Figs. 3 and 7 (p. 577), was excavated as an observation tunnel, during which the following longitudinal crevasses were encountered: about 26 metres south of the main tunnel, the bergschrund B, whose wall on the valley side was displaced almost vertically downwards at the rate of about 1 m. per month. Approximately 40 m. north of the main tunnel, the longitudinal crevasse S2 was traversed, which yielded 8–10,000 cu. m. of water, and which communicated with that crack, whose existence had been established around 70 m. north of the main tunnel. Between these two longitudinal cracks, two smaller cracks were also encountered.
The origin of the longitudinal cracks is explained by the relationships of stress and deformation while their filling up with water is conditioned thermodynamically. (Compare Sections III and IV.) Structurally interesting is the run of primary banding, which has arisen through metamorphosis from the firn banding, and in which the morphology of the rock base is so clearly shown that after some practice, the inclination of the rock foundation can be deduced approximately from the direction of the banding. So it may be concluded from the measurements of banding in the cross-tunnel Q100, that the saddle point (culmination) of the bedrock, lying some 20 m. deeper, should be situated 30 to 40 m. north of the main tunnel ; this was in fact confirmed by borings made in this profile. The neighbouring cross-tunnel Q120 also produced a similar picture (Figs. 6 and 7, p. 577).

Fig. 5. (a) Horizontal movement (Δy) of the axis of the longitudinal tunnel at various dates. (b) Graph of Δy as a function of time. (c) Vertical movement Δz of roof and floor of the tunnel and hence of its axis. (d) Vectors showing the movement of the tunnel axis at various points along its length

Fig. 6 Profile of Cross Tunnel Q120 showing the layering and blue band structure, also the method of measuring longitudinal extension. (Messuhr=dial gauge, Stahldraht=steel wire, Verankerungsbolzen= anchoring bolts.) (below). Horizontal displacements (vy) in mm. per day over three measuring periods. (Bewegungsscheide=division of movement.)

Fig. 7. Cross-tunnel Q100. (above). Section showing firn surface, tunnel with crevasses and blue bands. At the left is the bergschrund (B), beyond which the tunnel sank at the rate of 1 mm. per month. (Stollenaxe = longitudinal tunnel axis, Kreisprofil = circular profile, Blaufdrbung = blue colouration, Spalte = crevasse, Wasseranfall = water content, Schichtung = layering, Bohrungen—borings.) (below). Plans of various parts.
That disturbances in the course of the bands must occur in the immediate proximity of cracks is obvious. The correspondence between banding and the rock surface was particularly clear where the tunnel passed from the rock into the ice at hm. 0.30 ; that is to say, in a pronounced pressure zone. At the junction, the clear ice is frozen hard to the clean rock surface. Since, under these conditions, no slipping of the cold ice takes place on the rock, the longitudinal cracks observed never reach down to the rock bed, as has already been mentioned, and so the completely watertight cracks fill up with melting-water from above, even with a relatively small inflow during the hot season. Much less securely fixed is the junction between ice and rock at the western upper end of the ice tunnel, which lies in an area of tension (hm. 1.6). The correspondence between ice banding and rock surface is not present here.
In striking contrast to the primary band structure are the blue bands, which can here be observed in statu nascendi. It repeatedly happened that in the cross-tunnels and the ice laboratory, fine cracks opened up under a sharp blow: these gradually widened, to change into a small blue band after the water, which had percolated down from the melting glacier surface, had frozen again. As a rule, the blue bands cut the primary banding at an obtuse angle or else they are perpendicular to it (cf. Figs. 6 and 7). Especially instructive in this respect is the course of blue bands in the 130 m. long cross-tunnel Q100, in the middle of which occurs a more horizontally positioned lenticular blue band. Its particular form can be explained as follows:
Imagine that where the movement of the cap divides (i.e. at the boundary between movement in northerly and southerly directions), at a point where, by definition, only vertical movement can take place, there arises a vertical fissure under the influence of horizontal tensile stresses. After filling with water and under the influence of hydrostatic pressure this fissure gradually assumes the typical shape, which is schematically indicated at the right hand side of Fig. 3. The blue band caused by the freezing of the water-filled crevasse will be deformed according to the laws of creep movement and in the course of time take on the shape indicated by the stages of development “a,” “b” and “c”: that is to say, it will be drawn out horizontally in the two opposite directions of movement (north and south). Measurement now showed that at the present time the division of movement in the cross-tunnel Q100 lies between the longitudinal tunnel and crevasse S2. In fact, a horizontally extended blue band of the form theoretically to be expected was discovered and sketched in this zone by an observer who had no knowledge of these kinematic relationships. (Fig. 7, middle.) In contrast to the bubble-filled and rather finely crystalline ice between the blue bands, the blue band itself consists predominantly of very coarse-grained ice, as clear as pure water. The magnitude of the crystals in different zones was estimated, the average size being between 5 and 12 cm. long. This unusual size of crystal may be due primarily to the slow process of freezing. Crystallographic examinations are planned by Professor A. Renaud. Fig. 10 (p. 581) is a photograph of a finer-grained blue band, the structure being shown up by hoar which had formed upon it.
III. Measurements of Movement and Deformation
Considered from a purely practical point of view, the overall arrangement of the network of observations and the position of the observation-tunnels were so contrived that in the course of time, the spatial movement in the interior and on the surface of the ice cap could be assessed, so as to arrive at the true velocity vectors in magnitude and direction, and to establish their periodic variation. Up to the present, however, this aim could be only partially achieved, for the surface measurements are not yet sufficiently far advanced. The following results are therefore concerned almost exclusively with the measurements carried out during the period 1950–54 in the interior of the system of tunnels.Reference Perutz 5 , Reference Haefeli and Kasser 6
1. Longitudinal Tunnel (East—West)
Fig. 5a (p. 575) illustrates first the horizontal components Δy of the southerly displacement of the tunnel axis, i.e. the bending of the once straight axis at different dates (2–9) during the period of construction, 1950–54. From this, there arises on the one hand the immobility of the two ends of the tunnel, which are frozen hard onto the rock, and on the other hand, the strong local increase in movement in the region of crevasse 1 (the zone of north—south tension). The greatest horizontal velocity was found to be at point hm. 1.1, with about 33 cm. ayear. In Fig. 5b , the variation with time of the southerly displacement at single points is shown, from which can be seen a notable steadiness of the average speed of movement. The measurements during the years 1950–52 reveal but indistinctly a certain yearly rhythm of velocity in the form of a slowing-up in winter. Fig. 5c shows the vertical movements Δz of the roof and base of the tunnel; these, however, are shown on a scale ten times smaller than that of the horizontal displacements Δy. The true direction and magnitude of the displacement of the tunnel-axis in the vertical plane yz is represented in Fig. 5d by the mean annual velocity during the period 1950–53 for different points in the longitudinal tunnel. From this it follows, as was to be expected, that these vectors are steeper than the rock surface (cf. Fig. 3). The third component of movement in the x-direction is established with the aid of longitudinal measurements in the tunnel L. In the main, only qualitative results can be obtained about it. The slope of the firn surface in longitudinal section, clearly discernable in Fig. 2, in conjunction with the course of the rock-contour, brings about a displacement to the east between the two ends of the tunnel which are firmly anchored to the rock: this reveals a zone of tension at hm. 1.5 and a zone of compression at hm. 0.5.
With regard to the deformation of the tunnel cross-sections, which were measured at regular intervals of time, the following general picture was built up: Whereas the width of the tunnel remained nearly unchanged, the clear height diminished during three years from 2.5 to 2.15 m., i.e. about 12 cms. a year, while the thickness of ice above amounted to roughly 30 m. (hm. 1.2–1.4). Accordingly (as in Fig. 5d ) the vertical displacement of the top was 12 cm. greater than that of the bottom, at most about 25 cm. as opposed to 13 cm. per year. The vertical displacement of the tunnel axis was taken as the average of these two displacements.
In order to arrive more accurately at the state of stress from the deformations of the cross-section, an extension of the tunnel, 6 m. long and of circular cross-section, 2.9 m. in diameter, was cut out at hm. 1.30, i.e. at a point where the covering ice was about 30 m. thick. Fig. 8 (p. 579) shows the deformations of the circular profile observed during the course of two years. While the horizontal diameter of the profile remained almost unchanged, the vertical diameter underwent a reduction of 20.5 per cent in 687 days, or at a rate of 0.03 per cent per day. For the mean diameter during this period, this corresponds to a reduction of 0.0333 per cent per day. From the type of deformation one can deduce the ratio of the horizontal side pressure to the pressure from above (cf. Sect. V.).

Fig. 8. Circular profile K1 in the longitudinal tunnel at hm. 1.24—hm. 1.30. Diagram showing change of cross-section from February 1951 to January 1953. The section was below 30 m. of ice, layering was approximately horizontal. O = measured points. The table shows total variations in diameters in cm. D4–8 is vertical diameter, D2–6 is horizontal diameter
2. Cross-tunnels (North—South)
The system of cross-tunnels arranged perpendicularly to the longitudinal tunnel was only extended towards the end of the period of construction, 1950–54, sufficiently for the control of the ice over an adequate number of years. The short side tunnel Q120 was completed at the beginning of 1953, the longer one, Q100, which lies in the centre of the cap, being finished in the middle of 1954.
In a tunnel running along the division of northerly and southerly movement, only vertical and no horizontal displacements would be experienced. It therefore became a matter of great interest to localize this division of movement within the cap. Amongst other things, the already mentioned cross-tunnels served for this purpose: variations in their length were precisely measured with the aid of dial gauges and measuring tapes.
(a) Cross-tunnel Q120
The rates of horizontal displacement (mm. per day) are given in Fig. 6, as the results of the measurements of length in the cross-tunnel Q120 for various lengths of time. These clearly indicate an uninterrupted stretching in the length of this 40 m. long tunnel. So as to measure individual sections of the tunnel separately, and to deduce the influence of the cracks, the whole length of tunnel was subdivided into five stretches, and moreover, for the sake of checking, the overall measurement of the whole stretch 1–P1 was taken with the dial gauge at 1. Since the continuity of length alterations could be observed directly with the aid of the dial gauges, and since reliable results were obtained over short periods, it was possible, with this system of measurement, to ascertain the position of the division of movement O within a short time. Here, the peg P1 in the roof of the main tunnel, whose absolute creep rate vy is known, formed the necessary starting point from which, by aid of the measurement of alterations in length of the cross tunnel Q120, it was possible to arrive at absolute horizontal velocities.
Whereas a preliminary measurement A over a short time revealed a pronounced differentiation, i.e. a smaller rate of extension in the middle section of the tunnel than at the ends, the longer measuring time B produced a very even rate of extension of 3.7 mm. a day. Since the length of the whole measured section was 42.25 metres,Footnote * a horizontal rate of straiui is arrived at of
Surprisingly, all the measurements concurred in showing that the main tunnel is situated in the immediate vicinity of the division of movement, whose position is subject to certain periodic oscillations. The division of movement of the cross-tunnel Q120 may lie somewhat further south than the highest point of the rock base. Since, however, that part of the ice cap lying on the north side of the rock saddle possesses a significantly larger mass than the southern part (cf. Fig. 3), it is easily understood that in these exceptional circumstances part of the ice mass on the southern side of the water shed will be drawn over the higher rock saddle to the north.
The comparison of the stretching in the cross-tunnel with the stretching of the corresponding length on the fire surface is particularly interesting. For this purpose, measuring points were marked with pegs vertically above identical points in the tunnel, and observations were started in 1954. From an initial set of such observations taken over a short time, the following comparison can be made, taking, as an example, the cross-tunnel Q120 with reference to a measured length of about 40 m. lying in the region of the division of movement
It should be noted here that probably a substantial part of the measured length-alteration at the surface has taken place in the top-most layer of firn and snow, together with tilting of the measuring rod.
(b) Cross-tunnel Q100
This observation gallery, which completes the system of tunnels in the shape of a cross and so, in combination with the longitudinal tunnel and the surface network, permits more complete observation of the ice cap, was only completed in July 1954 ; there are therefore no measurements available over a sufficient length of time.
The sector of the tunnel lying to the south of the longitudinal tunnel was dug first, on the one hand to establish the exact position of the bergschrund and on the other to provide an exit (window) on to the Jungfrau firn (November 1953). Due to the comparatively high vertical speed of the wall of the bergschrund on the valley side, the section of tunnel on the south side of this cleft soon disappeared into the depths and had to be abandoned. During the short period of observation from 12 December 1953 to 5 January 1954, the following vertical speeds v z were measured for the points 1–6 in Fig. 3:
Table I. Vertical speeds for cross-tunnel Q 100
Points on ice cap, southern section. Measuring period 12 December 1953 to 5 January 1954. y=Distance from axis of longitudinal tunnel

The fact that the highest vertical speed was observed at Point 4, can be explained by a rotating movement of the ice masses on the valley side of the bergschrund. The function of the rock base as a slipping surface presupposes the reaching of the point of pressure melting.Reference Haefeli and Kasser6
(c) Movement relationships and observation of balance in the division of movement
If one imagines a prismatic section, as in Fig. 9a (p. 579), consisting of many horizontal ice layers, independent of one another and free to slip without friction on the base, then the rectangular cross-section would gradually be contorted by the influence of its own weight into the trapezium A′B′C′D′Footnote * . If section a corresponds to the annual accumulation, then the following equation results, with cross-stretching prevented in planes perpendicular to the section shown:


Fig. 9. Diagram to show the relation between accumulation and the profile of motion. In a) with unlimited slipping on the bed, in b) with no slipping

Fig. 10. Surface of a crevasse wall (south wall of crevasse S1 at hm. 0.7) after deposition of hoar frost (very slightly enlarged). The grain boundaries on the plane ice surface are rendered visible because of the differing orientation and intensity of the deposited hoar, which in turn depends on the crystal axes and the crystallographic nature of the underlying ice. The black lines correspond to a lack of deposit, and the white lines to a maximal deposit, of hoar frost in the boundary region between two crystals
Where:
-
a=Annual accumulation (height of ice added)
-
H=Height of the ice block, that is to say depth of the ice cap.
-
v m =Mean extension of half of the block per year (horizontally in the x direction).
-
ϵ m =Mean strain of the block per year (horizontally).
If the ice block consists of a homogeneous column, frozen on to the rock bed, the boundary conditions for the deformation are considerably more complicated (Fig. 9b), but the above equation remains valid without alteration.
For an average rate of strain ϵ m = 0.0083 per cent × 365 = 3.03 per cent per year and H = 50 m., an accumulation a of about 1.50 m. of ice is necessary to maintain a stationary state. It is further to be realized that, theoretically, there is a possibility of extrusion flow, while in actual fact a series of other influences come into play which confuse the picture and render assessment difficult. The equation (1), formulated as a condition of continuity for the stationary position in the symmetrical axis of an ice cap—can be put into words thus: The uniform deformation of the column of ice at the division of movement takes place in such a way that the product of the mean horizontal strain (ϵ m ) and the ice depth H remains constant, and equal to the yearly accumulation of ice a.
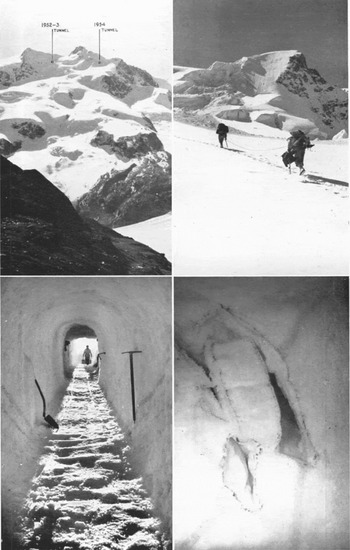
The ice tunnel at the Silbersattel
Above left: Monte Rosa showing the locations of both the 195–53 tunnel and the 1954 tunnel Above right: On the way to the tunnel
Below left: Tunnel interior, showing dip of strata
Below right: Voids disclosed in névé by tunnel excavation
Photographs by B. Wintersteller (Gmunden)
(To be continued)


