


3.1 Introduction
Carbon is a candidate light element in Earth’s core.Reference Jeanloz1–Reference Li, Fei, Holland and Turekian3 The core consists of a liquid outer shell ranging from 2971 to 5210 km in depth and a solid inner sphere with a radius of 1220 km.Reference Dziewonski and Anderson4 Without direct samples, its iron-dominant composition has been inferred from seismological, geochemical, and cosmochemical observations, together with mineral physics constraints from laboratory measurements and theoretical simulations. Both the outer and inner cores are lighter than iron or iron–nickel alloys at relevant pressure–temperature (P–T) values, indicating the presence of one or more elements with smaller atomic numbers than iron.Reference Birch5 Candidates for the light alloying elements of the core include hydrogen (H), carbon (C), oxygen (O), silicon (Si), and sulfur (S).
Earth’s core may be the largest repository for terrestrial carbon. As the fourth most abundant element in the solar photosphere, carbon occurs in carbonaceous chondrites and ordinary chondrites as a major or minor element.Reference Jarosewich6 The silicate Earth is depleted in carbon with respect to CI chondrite by more than two orders of magnitude, and by five- to ten-fold after accounting for evaporative loss to outer space during accretion.Reference McDonough, Holland and Turekian7 Some of the missing carbon in the silicate Earth is likely found in its core, considering the large solubility of carbon in the iron-rich meltReference Dasgupta and Walker8–Reference Wang, Hirama, Nagasaka and Ban-Ya10 and the strong affinity of carbon for iron metal during core–mantle differentiation.Reference Chi, Dasgupta, Duncan and Shimizu11–Reference Tsuno, Grewal and Dasgupta14 Core sequestration can also explain the 13C enrichment in silicate Earth relative to Mars, Vesta, and chondrites.Reference Wood, Li and Shahar15 Cosmochemical and geochemical considerations suggest that the core may contain as much as 1 wt.% (5 at.%) carbon.Reference Wood, Li and Shahar15 A lower estimate of 0.2 wt.% carbon in the core is derived by assuming that carbon depletion follows the volatility trend.Reference McDonough, Holland and Turekian7 More details are found in Chapter 2. A core containing 1 wt.% carbon would exceed the combined budget of known carbon in the atmosphere, hydrosphere, biosphere, crust, and mantle by one order of magnitude (Figure 3.1). Even with the lowest estimate of 0.1 wt.% carbon, the core would still account for more than half of Earth’s total carbon budget.

Figure 3.1 Pie diagrams showing the relative sizes of Earth’s carbon reservoirs for two end-member models. The concentrations of carbon are assumed to be 0.2 wt.%, 20 ppm, and 165 ppm in the crust, depleted mantle, and enriched mantle, respectively.Reference Dasgupta, Hazen, Jones and Baross16 With 100 ppm in the atmosphere, biosphere, and hydrosphere,Reference Dasgupta, Hazen, Jones and Baross16 the total carbon in these reservoirs is negligible and hence not shown.
Constraining the carbon budget of the core is crucial for identifying Earth’s building blocks and reconstructing its accretion history. In this chapter, we review constraints on the carbon content of the core from the phase relation, density, and sound velocities of iron–carbon alloys and compare carbon with other light elements in terms of their ability to match the physical properties of the core. We will also provide a brief discussion of how carbon may have redistributed among various Earth reservoirs through geological time.
3.2 Constraints on Carbon versus Other Light Elements in Earth’s Core
3.2.1 Constraints from Phase Relations of Iron–Light Element Systems
Carbon as a core component has attracted special attention through the proposal of a carbide inner core.Reference Wood9 Based on long extrapolations of equation of state (EoS) data available at the time, Fe3C with 6.67 wt.% C was predicted to be the first phase to crystallize from an Fe–S–C liquid to form the inner core, even for carbon contents below 1 wt.%.
Testing the model of a carbide inner core requires knowledge of the phase relations at core pressures. As an initial step, the simplified Fe–C binary system has been investigated through experiments and thermodynamic modeling (Figure 3.2). At 1 bar, the system has a eutectic point between iron and Fe3C at 4.1 wt.% carbon.Reference Chipman17 At pressures above 10 GPa, the eutectic point lies between iron and Fe7C3 with 8.41 wt.% carbon,Reference Nakajima, Takahashi, Suzuki and Funakoshi18 hence Fe7C3 is expected to solidify from any composition on the carbon-rich side of the eutectic point at core pressures.
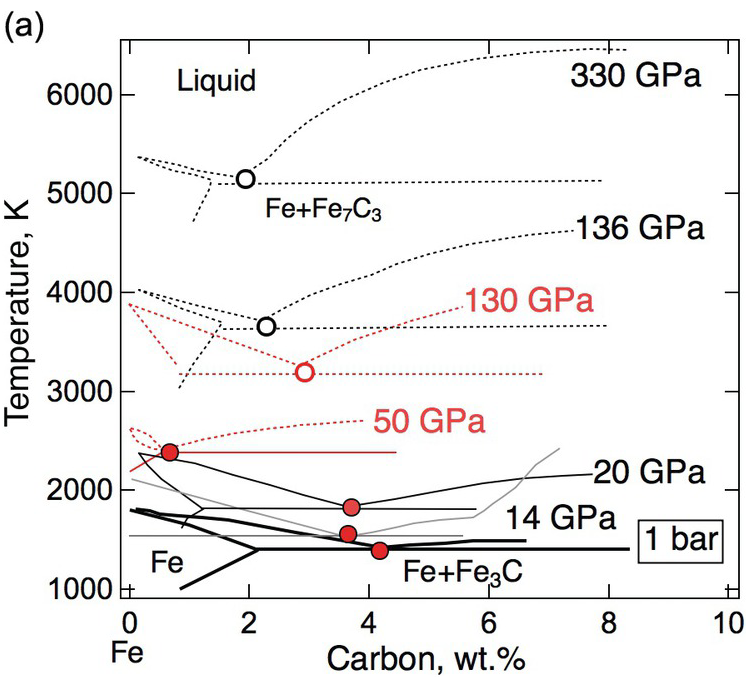
(a) Schematic phase diagram of the Fe–C binary system near the iron end member. 1 bar: thick black solid line,Reference Chipman17 14 GPa: gray solid line,Reference Nakajima, Takahashi, Suzuki and Funakoshi18 50 GPa and 130 GPa: red solid or dotted lines,Reference Lord, Walter, Dasgupta, Walker and Clark20 20 GPa, 136 GPa, and 330 GPa: thick black solid or dotted lines.Reference Fei and Brosh22 Solid traces and filled circles are based on experimental measurements. Dotted traces and open circles are based on calculations and/or extrapolations.
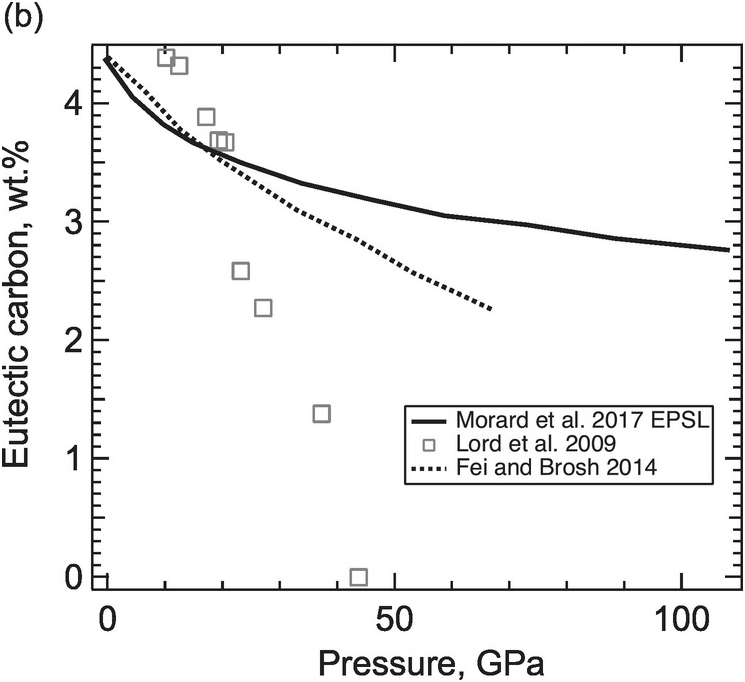
(b) Carbon content of the Fe–C eutectic liquid as a function of pressure.
While some studies support the predicted shift of the eutectic composition toward the iron end member with increasing pressure,Reference Hirayama, Fujii and Kei19, Reference Lord, Walter, Dasgupta, Walker and Clark20 others conclude that the eutectic composition contains 3 ± 1 wt.% carbon between 40 and ~100 GPa in pressureReference Morard21 and ~2 wt.% carbon at the pressure of the inner core boundary (ICB).Reference Fei and Brosh22 If the outer core contains less carbon than the eutectic composition, then a hexagonal close-packed (hcp) Fe incorporating carbon instead of Fe7C3 would be the liquidus phase to form the inner core.
The carbide inner core model can also be tested against the density increase across the ICB. Isochemical freezing of pure Fe or an Fe–light element (Fe–L) alloys produces 1.7% or 2.4% increases in density.Reference Alfè, Gillan and Price23, Reference Luo, Cheng, Chen, Cai and Jing24 These are smaller than the 0.6–0.9 g/cm3 or 4.7–7.1% observed density increases,Reference Shearer and Masters25 suggesting that the inner core contains less of the light elements than the outer core. In the ICB condition, a candidate Fe–L composition must reproduce the observed density contrast. For a simplified Fe–L binary, a match is possible only if the core composition is on the Fe-rich side of the eutectic point. Moreover, the light element contents of the solid and liquid must be sufficiently high and different to match the density contrast. If the eutectic composition is below 1 wt.%, it is unlikely to find a binary Fe–C composition with 5% density contrast between coexisting solid and liquid. It follows that carbon alone is unable to account for the density contrast at the ICB. The presence of sulfur and/or oxygen could help if they partition more strongly into the liquid phase. If the eutectic carbon content is as high as 3 wt.%, then a match by an Fe–C binary composition is possible (Figure 3.2).
Fe–L binary phase relations at 1 bar differ according to the nature of the light element, as is known from the metallurgy literature.Reference Kubaschewski26 The phase relations at pressure and temperature conditions relevant for Earth’s core are drastically different from those at 1 bar (Figure 3.3).
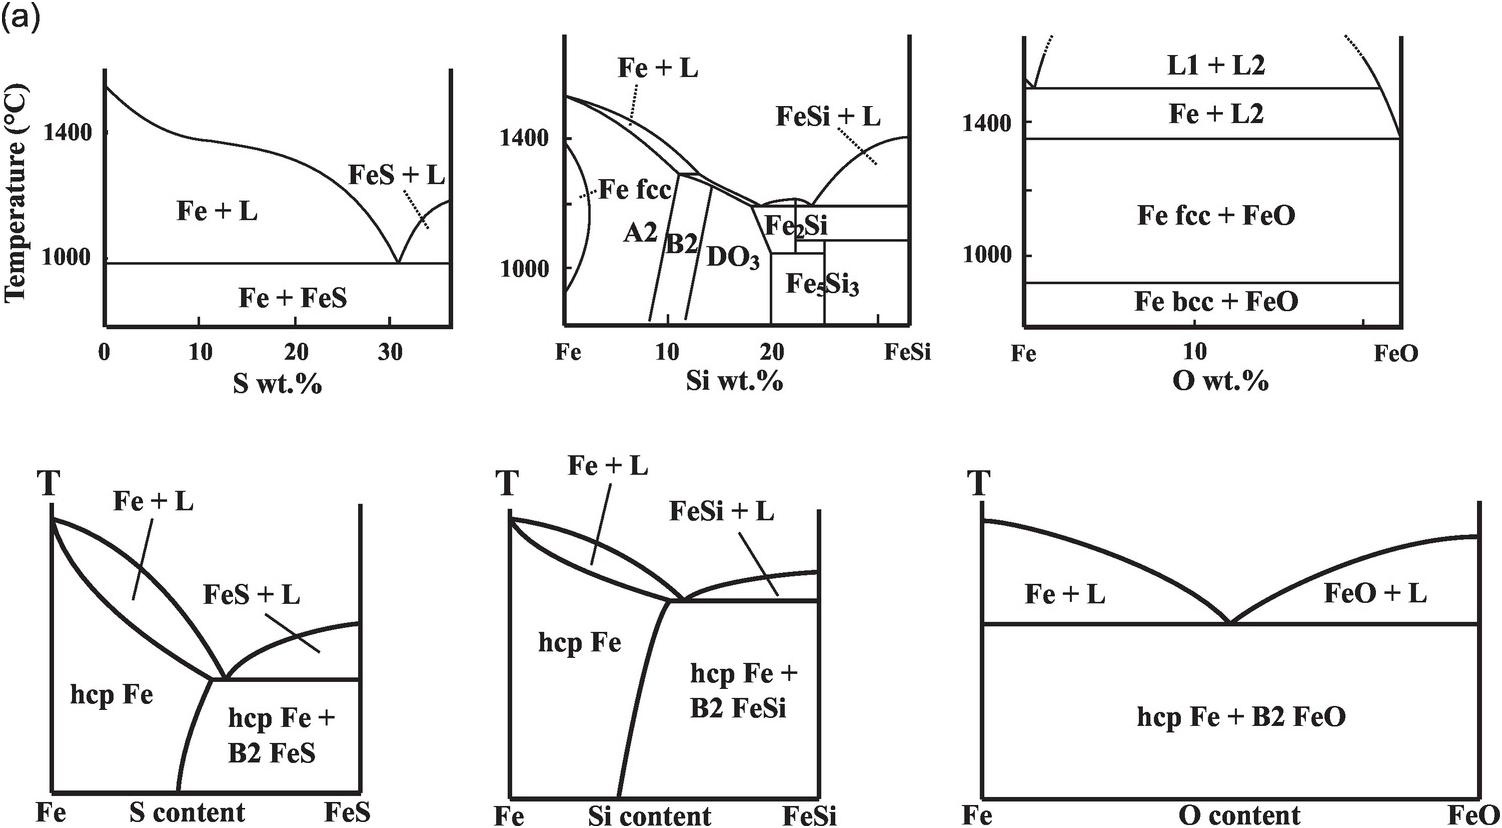
(a) Phase diagrams on the Fe-rich side of Fe–S, Fe–Si, and Fe–O systems at 1 bar (upper) and 330 GPa (lower).Reference Morard, Andrault, Antonangeli and Bouchet27
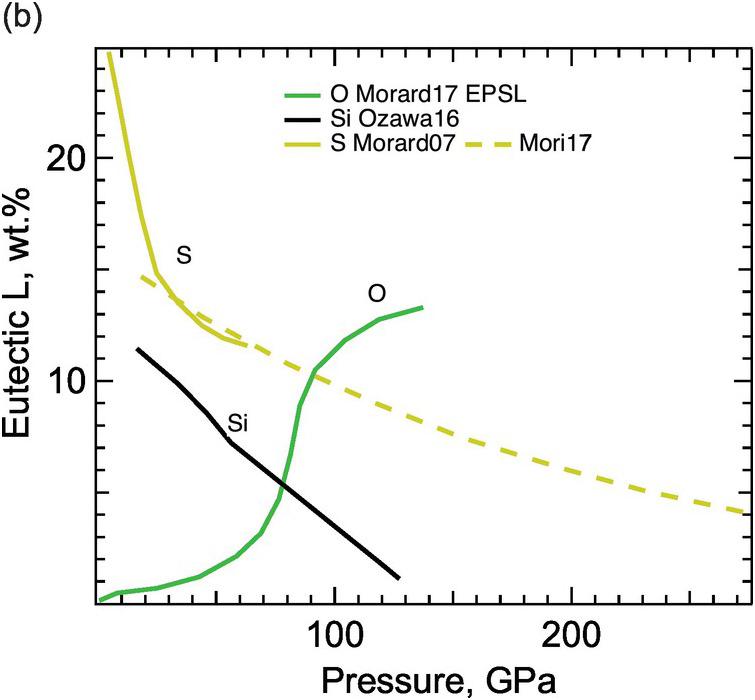
(b) Eutectic composition as a function of pressure.
The Fe–S binary exhibits eutectic behavior between Fe and FeS at 1 bar and the sulfur content of the eutectic decreases with pressure (Figure 3.3). At core pressures, we may expect that a eutectic liquid containing <10 wt.% sulfur coexists with a solid with slightly less sulfur.Reference Alfè, Gillan and Price23, Reference Mori29, Reference Kamada31, Reference Li, Fei, Mao, Hirose and Shieh32 Therefore, sulfur alone cannot explain the density contrast at the ICB. At least 1–2 wt.% sulfur is likely to be present in the liquid core in addition to carbon and may enhance the stability of carbides or Fe–C alloys on the liquidus.Reference Wood9
The Fe–Si binary shows a narrow melting loop and only slight enrichment of silicon in the liquid at pressures up to 120 GPa (Figure 3.3). The eutectic composition contains 25 wt.% silicon at 21 GPa pressureReference Kuwayama and Hirose33 and <10 wt.% silicon at 80 GPa or higher,Reference Fischer34 and falls below 1.5 ± 0.1 wt.% at 127 GPa pressure.Reference Ozawa, Hirose, Yonemitsu and Ohishi30 Such a silicon-poor eutectic composition implies that FeSi may be a candidate for the inner core. Because Si stabilizes the body-centered cubic (bcc) structure, the inner core may be hcp Fe alloyed with Si or a mixture of a Si-rich bcc phase and a Si-poor hcp phase.Reference Belonoshko, Rosengren, Burakovsky, Preston and Johansson35, Reference Lin36 On the other hand, the silicon-poor eutectic composition and the nearly equal partitioning of silicon between solid and liquid iron at the ICB pressureReference Alfè, Gillan and Price23, Reference Morard, Siebert and Badro37 imply that silicon alone cannot explain the ICB density contrast.
While oxygen is a leading candidate for the light element in the liquid outer core, little oxygen is expected to be present in the solid inner core. At 1 bar, the Fe–O binary is characterized by a vast liquid miscibility gap.Reference Kubaschewski26 At core pressures, the Fe–O system is more likely to be a eutectic with nearly pure Fe coexisting with Fe–O liquid (Figure 3.3). The eutectic oxygen content increases with pressure and exceeds 10 wt.% at >100 GPa.Reference Morard21 Given its low solubility in solid Fe, the amount of oxygen in the inner core is probably negligible, but oxygen is the best candidate to explain the density difference between the solid and liquid cores.
3.2.2 Constraints from Densities of Fe–C Alloys and Compounds
The presence of light elements in Earth’s core was initially inferred from comparing the observed density of the core with the measured density of iron under corresponding conditions. The pressure of the core is well constrained by geophysical and seismological data.Reference Dziewonski and Anderson4 The temperature profile of the core is more uncertain and bears at least ±500 K uncertainties.Reference Anzellini, Dewaele, Mezouar, Loubeyre and Morard38 Compared with pure iron or iron–nickel alloys at the core P–T conditions,Reference Dewaele39–Reference Seagle, Campbell, Heinz, Shen and Prakapenka42 the core is lighter than pure iron by 5–8% in the liquid outer shell and by 2–5% in the solid inner sphere.Reference Birch5, Reference Anderson and Isaak43–Reference Komabayashi and Fei45
A viable composition model of the core must account for the density deficits. This is a straightforward and effective test, but requires knowledge of the phase relation and EoS of relevant Fe alloys in solid and liquid states at multi-megabar pressures and temperatures exceeding 4000 K. A wide range of mixtures of iron with C, O, Si, and S have been proposed as possible constituents of the outer core, whereas the solid inner core is most likely an iron alloy or a compound of iron with one of the light elements,Reference Jeanloz1–Reference Li, Fei, Holland and Turekian3 and therefore the test is somewhat simpler for the inner core.
Stimulated by the suggestion that the density of Fe3C should be close to the observed value of the inner core,Reference Wood9 measurements and calculations of the densities and elastic properties of iron carbides have been carried out (Tables 3.1 and 3.2). First-principles simulations coupled with structure search algorithms have been used to predict the iron–carbon alloys that are likely to be stable at Earth’s inner core conditions. The energetically competitive stoichiometry ranges from Fe:C of 3:1 to 1:1 and includes Fe3C, Fe7C3, Fe5C2, Fe2C, and FeC stoichiometry.Reference Bazhanova, Oganov and Gianola46, Reference Weerasinghe, Needs and Pickard47
| Composition (wt.% L) | ρ0 (g cm–3) | K0 (GPa) | K0ʹ | P (GPa) | T (K) | Method | Ref. |
|---|---|---|---|---|---|---|---|
| Density | |||||||
| Fe3C | |||||||
| 7.70(1) | 175(4) | 5.2(3) | 0–73 | 300 | PXD | Reference Scott, Williams and Knittle121 | |
| 7.70(1) | 174(6) | 4.8(8) | 0–30 | 300 | PXD | Reference Li61 | |
| 8.03(1) | 290(13) | 3.76(18) | 0–187 | 300 | PXD | Reference Sata50 | |
| 7.67 | 167 | 6.7 | 0–35 | 300 | PXD | Reference Ono and Mibe49 | |
| fm Fe3Ca | 7.68(1) | 192(3) | 4.5(1) | 0–31 | 300–1473 | PXD | Reference Litasov63 |
| pm Fe3C | 161(2) | 5.9(2) | 0–50 | 300 | SXD | Reference Prescher62 | |
| pm Fe7C3 | 7.68(1) | 201(12) | 8.0(1.4) | 4–158 | 300 | SXD | Reference Chen64 |
| nm Fe7C3 | 7.75(2) | 307(6) | 3.2(1) | 7–167 | 300 | SXD | Reference Chen64 |
| fm Fe7C3 | 7.62(1) | 186(5) | 6.9(2.2) | 0–7 | 300 | PXD | Reference Liu, Li and Ikuta70 |
| Nonlinear Fe7C3 | 7.59(2) | 166(13) | 4.9(1.1) | 7–20 | 300 | PXD | |
| pm Fe7C3 | 7.68(2) | 196(9) | 4.9(2) | 20–66 | 300 | PXD | |
| fm Fe7C3 | 7.61(1) | 201(2) | 4 (fixed) | 0–18 | PXD | ||
| pm Fe7C3b | 7.70(2) | 253(7) | 3.6(2) | 18–72 | 300–1973 | PXD | Reference Nakajima41 |
| V0 (m/s) | V = a0 + a1•ρ | ||||||
| VP | a0 | a1 | |||||
| Fe bcc | 5800 | Reference Mao89 | |||||
| Fe3C | 5330–5140 | Reference Dodd, Saunders, Cankurtaran, James and Acet122 | |||||
| 5890 | –3990 | 1290 | 0–50 | 300 | NRIXS | Reference Gao55 | |
| 6103(413) | –8671 | 1900 | 0–68 | 300 | HERIX | Reference Fiquet, Badro, Gregoryanz, Fei and Occelli123 | |
| –1138 | 9823 | 60–153 | 300 | NRIXS | Reference Chen54 | ||
| Fe7C3 | 2160 | 660 | 70–154 | 300 | NRIXS | Reference Chen69 | |
| VS | |||||||
| Fe bcc | 3000 | Reference Mao89 | |||||
| Fe3C | 3010–3030 | Reference Dodd, Saunders, Cankurtaran, James and Acet122 | |||||
| 3050(70) | 1450 | 240 | 0–50 | 300 | NRIXS | Reference Gao55 | |
| 0–50 | 300– 1450 | NRIXS | Reference Gao94 | ||||
| –961 | 4429 | 60–153 | 300 | NRIXS | Reference Chen54 | ||
| Fe7C3 | 843 | 242 | 70–154 | 300 | NRIXS | Reference Chen69 | |
a Θ0 = 490(120) K, γ0 = 2.09(4), q = –0.1(3).
b Θ0 = 920(14) K, γ0 = 2.57(5), q = 2.2(5).
HERIX = high-energy-resolution inelastic X-ray scattering; NRIXS = nuclear resonant inelastic X-ray scattering; PXD = powder X-ray diffraction; SXD = single-crystal X-ray diffraction.
| Composition (%L) | ρ0 (g cm–3) | K0 (GPa) | K0ʹ | P (GPa) | T (K) | Method | Ref. | |
|---|---|---|---|---|---|---|---|---|
| wt.% | at.% | |||||||
| Fe | ||||||||
| 7.02 | 109.7(7) | 4.66(4) | 1811 | Shockwave | Reference Anderson and Ahrens44 | |||
| 5.19(Reference Li, Fei, Holland and Turekian3) | 24.6(6) | 6.65(4) | 50–350 | 7000 | FPMD | Reference Ichikawa, Tschuchiya and Tange82 | ||
| Fe–S | ||||||||
| 10 | 6 | 5.2 | 48.0(2.0) | 4 | 0–6 | 1770 | X-ray absorption | Reference Sanloup124 |
| 10 | 5.5 | 63 | 4.8 | 0–20 | 1773–2123 | Sink–float | Reference Balog, Secco, Rubie and Frost125 | |
| 20 | 12.5 | 4.41 | 35(1) | 4.9 | 0–8 | 1673 | Ultrasonic | Reference Jing96 |
| 27 | 17.4 | 4.07 | 25(1) | 5.3 | 0–8 | 1673 | Ultrasonic | |
| 30 | 19.7 | 0–5.4 | 1573–1673 | Ultrasonic | Reference Nishida126 | |||
| 11.7 | 7 | 6.28 | 83.7 | 4.98 | 150–300 | 4000 | FPMD | Reference Umemoto97 |
| 5.43 | 49.6 | 5.08 | 6000 | |||||
| 16 | 9.8 | 5.72 | 64.4 | 4.94 | 4000 | |||
| 5.06 | 42.9 | 5.02 | 6000 | |||||
| Fe–C | ||||||||
| 0–4 | 0–0.9 | a | 0 | 1523–1823 | Sessile drop | Reference Jimbo and Cramb73 | ||
| 3.5 | 0.8 | 6.91 | 83.9 | 5.9(Reference Poirier2) | 0–4 | 1700 | Ultrasonic | Reference Shimoyama127 |
| 6.91 | 100(Reference Jeanloz1) | 6.2(Reference Jarosewich6) | 1700 | |||||
| 7.02(1.5) | 55.3(2.5) | 5.2(1.5) | 2–7 | 1500 | ||||
| 2.0–4.0 | 0.4–0.9 | 65.0 | 6.0 | 42 | 3000 | X-ray diffraction | Reference Morard66 | |
| 10.9(Reference Dziewonski and Anderson4) | ||||||||
| 12.1(4) | ||||||||
| 5.7 | 1.3 | Similar to Tera10 | 0–5.4 | X-ray absorption | Reference Sanloup, van Westrenen, Dasgupta, Maynard-Casely and Perrillat128 | |||
| Larger | 5.4–7.8 | |||||||
| 3.9 | 16 | 6.51 | 110(Reference Wood9) | 5.1(Reference Li, Fei, Holland and Turekian3) | 7–70 | 2500 | X-ray absorption | Reference Nakajima65 |
| 6.7 | 1.5 | 6.5 | 54(3) | 4 | 0–10 | 1973 | X-ray absorption | Reference Terasaki129 |
| Fe–Si | ||||||||
| 17 | 9.3 | 5.88 | 68(Reference Jeanloz1) | 4 | 0–12 | 1773 | Sink–float | Reference Yu and Secco130 |
| 17 | 6.33 | 75 | 4 | 0–5 | 1650 | X-ray absorption | Reference Sanloup, Fiquet, Gregoryanz, Morard and Mezouar131 | |
| Fe–O | ||||||||
| 22 | 7.5 | 5.45 | 128 | 3.85 | 5000 | Thermo | Reference Komabayashi132 | |
| Fe–H | ||||||||
| 0.8 | 0.01 | 6.2 | 82.4 | 4.79 | 125–200 | 4000 | FPMD | Reference Umemoto and Hirose101 |
| 5.63 | 62.9 | 4.76 | 6000 | |||||
| 1.2 | 0.02 | 5.88 | 73.1 | 5.02 | 4000 | |||
| 5.23 | 53.2 | 4.82 | 6000 | |||||
a ρ = 7.10 – 0.0732x – (8.28 – 0.874x)•10–4•(T – 1823), x = wt.% C, T in K.
FPMD = first-principles molecular dynamics.
3.2.2.1 Fe3C
The natural form of Fe3C (cementite) occurs in iron meteorites and is known as cohenite. The composition of synthetic Fe3C ranges from C deficiency with 4.2 wt.% or 17 at.% C (roughly Fe5C) to C excess with 8.8 wt.% or 31 at.% C (exceeding Fe7C3).Reference Walker, Dasgupta, Li and Buono48 At 1 bar and 300 K, Fe3C has an orthorhombic structure (Figure 3.4). Although metastable at ambient conditions, the crystal structure remains unchanged to 187 GPa at 300 KReference Ono and Mibe49, Reference Sata50 and to 25–70 GPa and 2200–3400 K.Reference Rouquette51 Upon heating at pressures above 145 GPa, Fe3C decomposes into a mixture of solid orthorhombic Fe7C3 and hcp Fe, then melts incongruently above 3400 K.Reference Liu, Lin, Prakapenka, Prescher and Yoshino52 Cemenite is ferromagnetic at ambient conditions and its Curie temperature is sensitive to small deviations from stoichiometry.Reference Walker, Li, Kalkan and Clark53 It undergoes ferromagnetic to paramagnetic transition and spin-pairing transition at high pressures.Reference Chen54–Reference Lin56

Figure 3.4 Atomic-scale structures of crystalline and molten iron carbide alloys. (a) Orthorhombic Fe3C (space group Pnma), (b) hexagonal Fe7C3 (space group P63mc) and (c) orthorhombic Fe7C3 (space group Pbca). In both Fe3C and Fe7C3 polymorphs, the fundamental building blocks are triangular prisms (CFe6). Three such prisms are connected via shared vertices in a triangular arrangement (triads). The triads are stacked up along the c-axes for hexagonal polymorphs and along b-axes for orthorhombic polymorphs of Fe7C3. The carbon atoms are shown as gray spheres and the iron atoms are colored based on the distinct Wyckoff sites.Reference Mookherjee57, Reference Prescher58 (d) A snapshot of a molten iron carbide alloy from molecular dynamics simulations. The computational supercell is shown and has orthogonal axes with x = y = z. The diffusion trajectory of a carbon atom is shown for reference.
The density of Fe3C at ambient conditions is 2.5% smaller than that of fictive hcp iron, corresponding to ~1.4% density reduction for 1 wt.% carbon (i.e. a compositional expansion coefficient αc of 1.4).Reference Roberts, Jones, Calderwood and Jones59 Pressure-induced magnetic transitions lead to abrupt but small reductions in density and/or compressibility.Reference Chen54, Reference Gao55, Reference Mookherjee57, Reference Vočadlo60 The calculated density of Fe3C at the ICB pressure and 300 K is comparable to that of the inner core, but too low when thermal expansion is considered (Figure 3.5). A more appropriate test requires knowledge of the thermoelastic parameters of the non-magnetic phase.

Figure 3.5 Density of Fe–C alloys and compounds as a function of pressure of iron carbides. CMB = core–mantle boundary. Preliminary reerence Earth model (PREM): black crosses;Reference Dziewonski and Anderson4 hcp Fe at 300 K: black solid curve;Reference Mao, Wu, Chen and Shu40 hcp Fe at 5000–7000 K calculated using the Mie–Grüneisen–Debye EoS.Reference Seagle, Campbell, Heinz, Shen and Prakapenka42 Fe3C at 300 K;Reference Ono and Mibe49, Reference Sata50, Reference Li61, Reference Prescher62 Fe3C at 5000–7000 K.Reference Litasov63 Fe7C3 at 300 K;Reference Chen64 Fe7C3 at 5000–7000 K.Reference Nakajima41 Uncertainties are shown as error bars.Reference Chen64 Liquid with Fe84C16 compoisition.Reference Nakajima65 Liquid with Fe88C12 composition.Reference Morard66
3.2.2.2 Fe7C3
The metallurgical form of Fe7C3, known as Eckström–Adcock carbide, adopts a hexagonal structure at 1 bar and 300 K (Figure 3.3). An orthorhombic structure is also observed and may be stabilized with silicon impurities.Reference Das, Chatterjee, Ghosh and Saha-Dasgupta67 Non-stoichiometry is also observed in Fe7C3 and ranges from 8.0 to 10.8 wt.% (29–36 at.%) C, where the C-excess end member exceeds Fe2C stoichiometry.Reference Walker, Dasgupta, Li and Buono48 The crystal structure of Fe7C3 remains stable up to 185 GPa and 5200 K,Reference Liu, Lin, Prakapenka, Prescher and Yoshino52, Reference Raza, Shulumba, Caffrey, Dubrovinsky and Abrikosov68 but it undergoes pressure-induced magnetic transitions.Reference Nakajima, Takahashi, Suzuki and Funakoshi18, Reference Chen69–Reference Mookherjee71 At ambient conditions, the compositional expansion coefficients of h-Fe7C3 (~1.0) is smaller than that of Fe3C (~1.4). The calculated density of the non-magnetic Fe7C3 is broadly consistent with that of the inner core at the relevant pressures and temperatures, thus supporting the carbide inner core model (Figure 3.5).
3.2.2.3 Fe–C Alloy Near the Iron End Member
In the simplified Fe–C model, the inner core may consist of an Fe–C alloy rather than a carbide.Reference Fei and Brosh22 The Fe–C alloy would contain no more than 1 wt.% carbon according to geochemical considerations and the measured solubility of carbon at pressures greater than 40 GPa.Reference Lord, Walter, Dasgupta, Walker and Clark20, Reference Morard21 However, 1.0–2.5 wt.% carbon may not be sufficient to reproduce the density deficit of the inner coreReference Caracas72 and hence would require the presence of other light elements.
3.2.2.4 Liquid Fe–C Alloy
A carbide inner core implies that the liquid outer core contains more carbon than the eutectic composition at relevant pressures (Figure 3.2). Even if the solid inner core is not made of carbides, a substantial amount of carbon may still be present in the liquid outer core, which occupies more than 90% of the core by mass or volume.
At ambient pressure, adding 1.3–2.8% carbon only reduces the density of liquid Fe by ~1% (αc = 0.4–0.8).Reference Jimbo and Cramb73 Experimental measurements of an Fe liquid with 2.8 wt.% carbon suggest an αc of 2–4 at the core–mantle boundary (CMB) pressure of 136 GPa and 3000 K,Reference Morard66 which is in broad agreement with the calculated value of 1.3,Reference Badro, Cote and Brodholt74 considering uncertainty and extrapolation. The larger αc values at core pressures are consistent with Fe–C liquid being less compressible than Fe liquid.Reference Nakajima65 Even with αc = 2–4, 1.8–2.7 wt.% carbon is needed to explain the 5–8% density deficit in the outer core. This is higher than the upper limit from cosmochemical and geochemical considerations; hence, carbon cannot be the sole light element in the outer core.
3.2.2.5 Other Light Elements
All candidate light elements have been shown to reduce the density of solid Fe (Figure 3.6). The fitted compositional expansion coefficients of light elements in solid Fe alloys are comparable to the calculated results for liquid Fe alloys.Reference Badro, Cote and Brodholt74 On the per wt.% basis, carbon may be slightly more efficient than O, Si, and O at reducing the density of iron, and therefore a slightly smaller amount is needed to account for the 5–8% density deficit in the outer core (Table 3.3). Combinations of light element such as that of sulfur and siliconReference Morard75 are found to satisfy the density constraints.
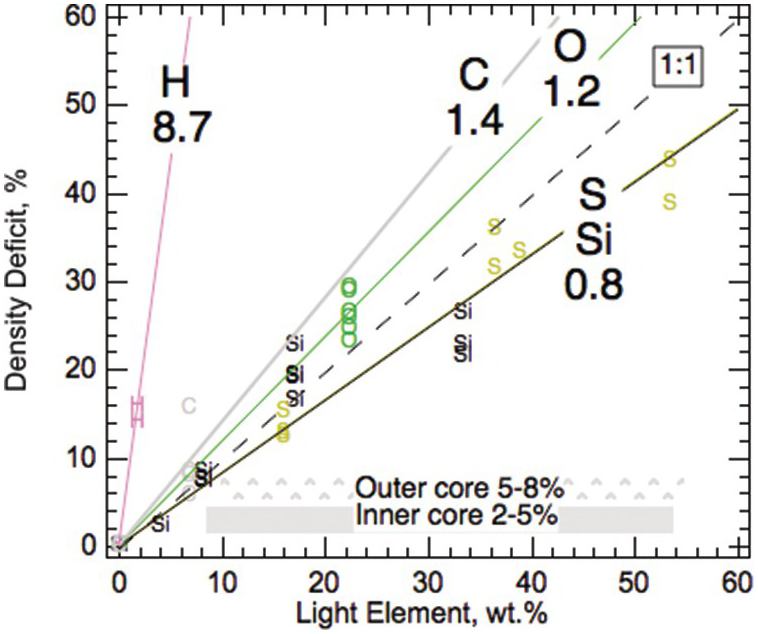
Figure 3.6 Compositional expansion coefficients of light elements in solid iron alloys. The values are derived from fits to solid Fe–L alloys and compounds.Reference Li, Fei, Holland and Turekian3
| Solida | Liquid at CMBb | Liquid at ICBb | LE, wt.%c | LE, wt.%d | |
|---|---|---|---|---|---|
| H | 8.7 | – | – | 0.6 | 0.9 |
| C | 1.4 | 1.3 | 1.3 | 4 | 6 |
| O | 1.2 | 1.1 | 1.0 | 4 | 7 |
| Si | 0.8 | 0.7 | 0.6 | 6 | 10 |
| S | 0.8 | 0.8 | 0.7 | 6 | 10 |
Compositional expansion coefficient is defined as the relative amount of density reduction per wt.% light element.Reference Roberts, Jones, Calderwood and Jones59
a Li and Fei.Reference Li, Fei, Holland and Turekian3
b Badro et al.Reference Badro, Cote and Brodholt74
c Amount of light element needed to account for 5% density deficit in the outer core.
d Amount of light element needed to account for 8% density deficit in the outer core.
LE = light element.
3.2.3 Constraints from Sound Velocities of Fe–C Alloys and Compounds
Comparison between the preliminary reerence earth model (PREM) and iron reveals a prominent mismatch in the shear wave velocity, VS, between the inner core and Fe or Fe–Ni alloys at corresponding pressures and 300 K (Figure 3.7). The discrepancy cannot be explained by the effect of temperature aloneReference Brown and McQueen76–Reference Ohtani78 and has been attributed to partial melting,Reference Singh, Taylor and Montagner79 strong pre-melting effects,Reference Li, Vočadlo, Brodholt and Wood80, Reference Martorell, Brodholt, Wood and Vočadlo81 and/or the presence of light elements.Reference Gao55 In contrast, the compressional wave velocity, VP, in the inner core is broadly consistent with that of hcp Fe (Figure 3.7). In the outer core, the bulk sound velocity may be comparable to or as much as 4% higher than liquid iron at corresponding conditions.Reference Anderson and Isaak43, Reference Ichikawa, Tschuchiya and Tange82 The presence of light elements, therefore, should not significantly affect the VP of iron for this match to hold.
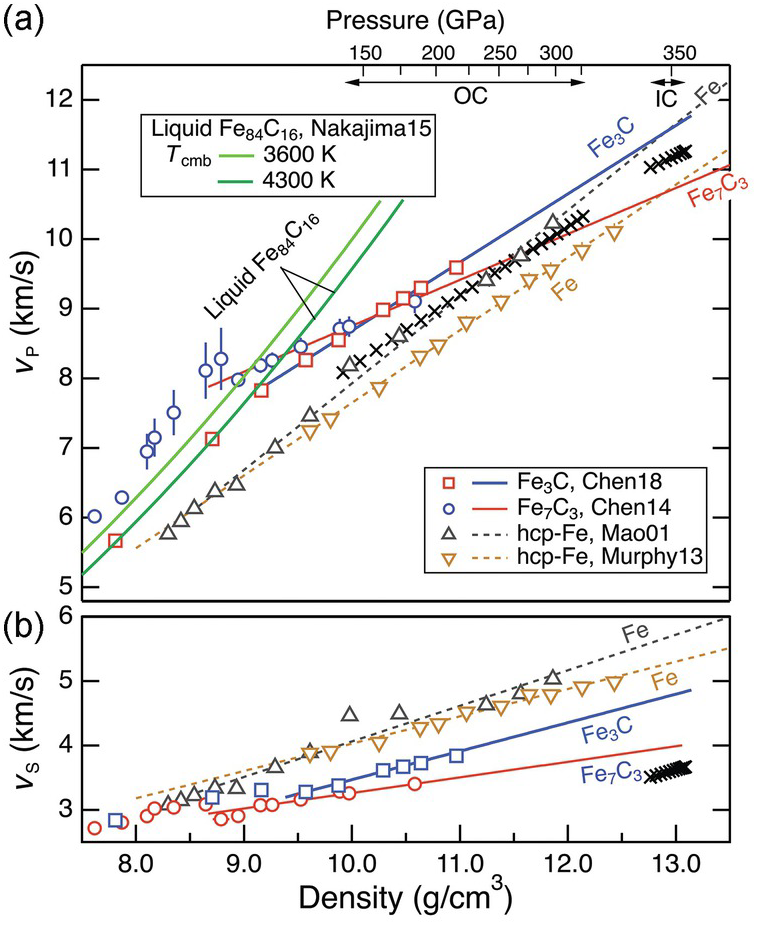
Figure 3.7 Sound velocity of Fe–C alloys and compounds. VP and VS of Fe carbides and liquid Fe–C as a function of density. Data are from Refs. Reference Chen54, Reference Nakajima65, Reference Chen69, Reference Mao89, and Reference Murphy, Jackson and Sturhahn90. The velocities of Fe–Ni alloys (not shown)Reference Lin91 are similar to that of Fe. The top axis denotes the pressure range of the outer core (OC) and inner core (IC) according to the density–pressure relationship in PREM.
The sound velocities in the core increase linearly with density, following Birch’s law (Figure 3.7). The velocity–density relations of solid and liquid Fe are consistent with Birth’s law, but for solid Fe the VP slope at 300 K or along a Hugoniot is steeper than that of the core. For VS, deviation from Birch’s law behavior was predicted by theoryReference Vočadlo, Alfè, Gillan and Price83 and observed at high temperatures,Reference Lin77 although this is not resolved in all studies.Reference Kantor84 A candidate Fe–L alloy must reproduce the velocity gradients in the core.
The speed of sound traversing the inner core is anisotropic by 3–4% in VP and ~1% in VS.Reference Souriau and Poupinet85, Reference Wookey and Helffrich86 The anisotropy in sound speed may reflect convective alignment of anisotropic hcp Fe crystalsReference Mao87 or an Fe–L alloy.Reference Antonangeli88 A candidate inner core phase needs to exhibit large enough elastic anisotropy to match the observations.
3.2.3.1 Fe3C
As a candidate for the inner core phase, Fe3C stands out in terms of its potential to account for the observed anisotropy. If the measured and calculated strong anisotropy in the sound velocity of Fe3C at ambient conditionsReference Gao92, Reference Nikolussi93 is applicable at core conditions, then only a small degree of alignment would be needed for Fe3C to match the observations.
Existing data suggest that Fe3C may provide a good match for the VS in the inner core. At ambient conditions, the VS of Fe3C is similar to that of bcc Fe (Table 3.1). At 300 K, a magnetic transition near 5 GPa leads to a reduction in the VS and its Birch’s law slope so that the extrapolated VS of Fe3C at the inner core pressure is much smaller than that of hcp Fe and closer to the core values.Reference Gao55 The high-spin to low-spin transition near 50 GPa leads to a further decrease in the Birch’s law slope.Reference Chen54 Moreover, at high temperatures, the VS of Fe3C deviates from Birch’s law behavior toward the inner core values; hence, it can potentially explain the anomalously low VS in the inner core without invoking partial melt or strong pre-melting effects.Reference Gao94
A potential match in VP is also consistent with existing data. The range of measured VP of Fe3C at 1 bar and 300 K encompasses that of bcc Fe (Table 3.1). The magnetic transition to the paramagnetic phase of Fe3C results in elastic softening and a shallower Birch’s law slope of VP, whereas the paramagnetic to non-magnetic transition does not seem to produce a visible effect.Reference Chen54 At 300 K and inner core pressures, the extrapolated VP of Fe3C is higher than that of the inner core (Figure 3.7). A close match is possible if VP at high temperature is lowered by a suitable amount as a result of deviation from Birch’s law.
3.2.3.2 Fe7C3
The most compelling support for an Fe7C3 inner core comes from its ability to match the anomalously low VS and high Poisson ratio, in addition to reproducing the density deficit.Reference Prescher58, Reference Chen69 While the ferro- to para-magnetic transition at 7.0–7.5 GPa does not seem to have obvious effect on sound velocities, significant shear softening accompanies the magnetic collapse at 40–50 GPa, resulting in pronounced reductions in VP, VS, and their Birch’s law slopes (Figure 3.7). At pressures relevant to Earth’s inner core, the extrapolated value of VS of Fe7C3 at 300 K is only slightly higher than the observed value. There is likely a good match for VS after considering further reduction at high temperature. It remains to be tested whether Fe7C3 can simultaneously match VS, VP, and anisotropy.
3.2.3.3 Fe–C Alloy Near the Iron End Member
First-principles calculations show that adding 1.0–2.5 wt.% carbon into the hcp Fe crystal structure increases its VP and decreases its VS, and this would help explain the observed anisotropy in compressional wave velocities, although there is a mismatch in shear wave anisotropy.Reference Caracas72
3.2.3.4 Liquid Fe–C Alloy
Adding carbon increases the VP of liquid iron (Table 3.1). For 1 at.% carbon, the average effect is 0.2% at 1 bar. It may increase to an estimated value of 0.8–1.2% at the core conditions, presumably because liquid Fe–C is less compressible than liquid Fe,Reference Nakajima65 or remains at 0.2% at high pressures and high temperatures.Reference Badro, Cote and Brodholt74 In any case, the VP of an Fe–C alloy with <1 wt.% carbon would be consistent with the observed value in the outer core.
3.2.3.5 Other Light Elements
The sound velocities of other Fe–L alloys remain poorly constrained (Figure 3.8 and Table 3.4). The effect of sulfur on the sound velocities is not yet sufficiently understood to allow firm tests of Fe–S models for the core.Reference Morard28, Reference Badro, Cote and Brodholt74, Reference Huang95–Reference Kawaguchi98 Further studies are needed to resolve the disagreements concerning oxygen as a major light element in the core.Reference Badro, Cote and Brodholt74, Reference Huang99 Computations suggest that an Fe–H alloy with 1 wt.% H can reproduce the density and VP of the liquid outer core and therefore could be the primary alloy element, but Fe–H alloys cannot reproduce the VS of the inner core.Reference Caracas100, Reference Umemoto and Hirose101
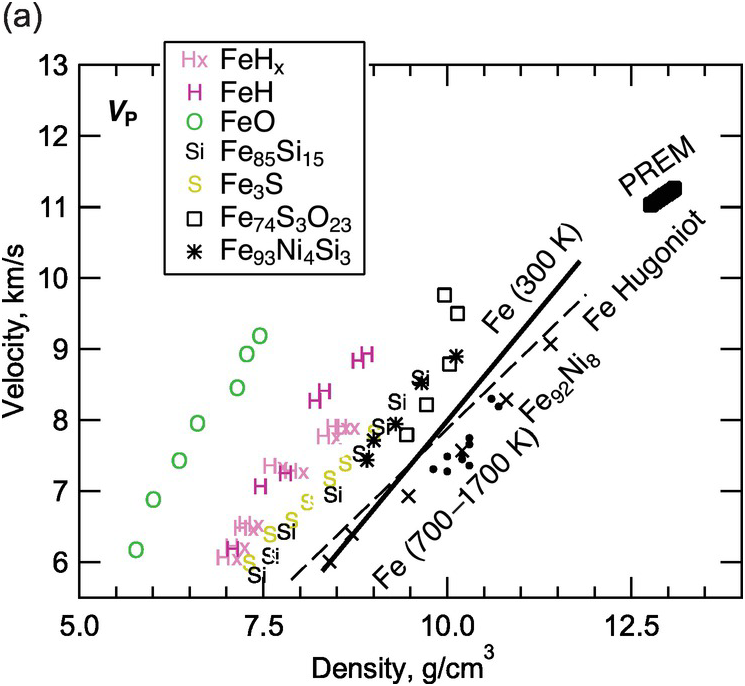
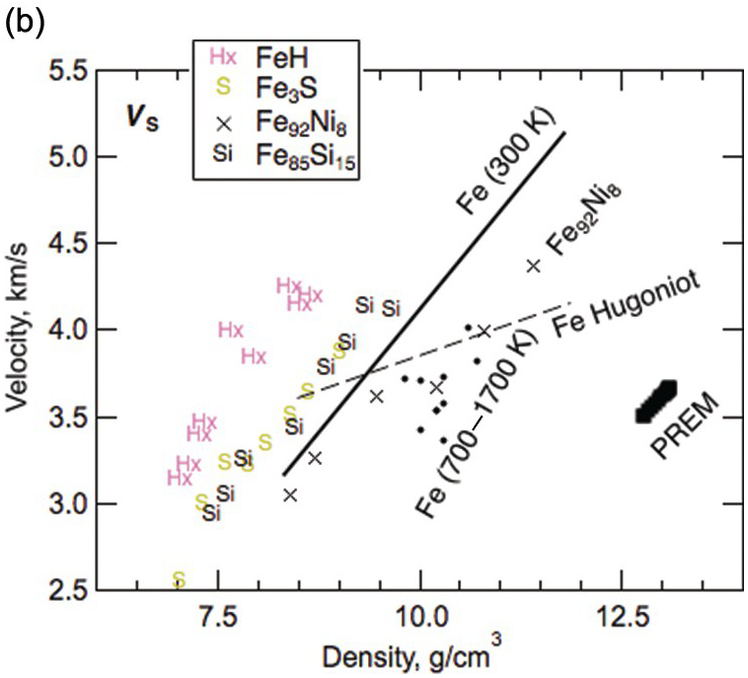
Figure 3.8 Sound velocities of Fe–H, Fe–O, Fe–S, and Fe–Si alloys and compounds. Compressional wave velocity VP (a) and shear-wave velocity VS (b) versus density relations. PREM;Reference Dziewonski and Anderson4 hcp Fe at 300 K: solid line;Reference Mao89 hcp Fe at temperatures between 700 and 1700 K: solid circles;Reference Lin77 Fe from shockwave experiments: dashed line;Reference Brown and McQueen76 Fe92Ni8 at 300 K: crosses;Reference Lin91 Fe3S at 300 K;Reference Lin102 Fe85Si15 at 300 K;Reference Lin91 FeO at 300 K;Reference Badro103 FeHx at 300 K;Reference Mao104 FeH at 300 K;Reference Shibazaki105 Fe74S3O23 from shockwave experiments;Reference Huang106 Fe93Ni4Si3 at 300 K.Reference Antonangeli107
| a | c | P0 (GPa) | T0 (K) | Teut CMB (K) | Xeut CMB (at.%) | dT/dx (K/at.%) | |
|---|---|---|---|---|---|---|---|
| Fe–C | 8.5 | 3.8 | 0 | 1420 | 2990(200) | 11(5) | 110(80) |
| Fe–O | 17 | 3.8 | 0 | 1800 | 3200(200) | 30(3) | 33(11) |
| Fe–18 wt.% Si | 23.6 | 1.89 | 0 | 1600 | – | 4 | – |
| Fe–S | 10.5 | 3 | 21 | 1260 | 2870(200) | 15(5) | 89(56) |
The parameters are fitted to the Simon–Glatzel equation (Tm/Tm0)c = (Pm – Pm0)/a. Data are from Morard et al.Reference Morard75
3.2.4 Constraints from Melting Temperatures of Fe–C Alloys
An independent constraint on the carbon content of the outer core can be obtained from the melting temperatures of iron alloys (Figure 3.8). The outer core is entirely molten, whereas the base of the mantle is mostly solid;Reference McNamara, Garnero and Rost108 hence, the melting temperature of a candidate Fe–C alloy must be lower than the solidus of overlying mantle at the CMB pressure. In addition, as the geotherm is expected to follow an adiabat, which has a smaller dT/dP slope than the melting curve, the temperature at CMB is expected to be 400–900 K lower than its crystallization temperature at the ICB.Reference Anzellini, Dewaele, Mezouar, Loubeyre and Morard38, Reference Komabayashi and Fei45
The solidus temperature at the CMB is estimated at 4100–4200 K for peridotitic composition.Reference Fiquet109 For comparison, core temperature profiles for pure Fe or Fe–Ni alloys would lead to a temperature at the CMB of 5400–5900 K,Reference Anzellini, Dewaele, Mezouar, Loubeyre and Morard38 which clearly exceeds the upper bounds on the mantle side (Figure 3.9); thus, these compositions are incompatible with a molten iron alloy and solid silicate coexisting at the CMB.
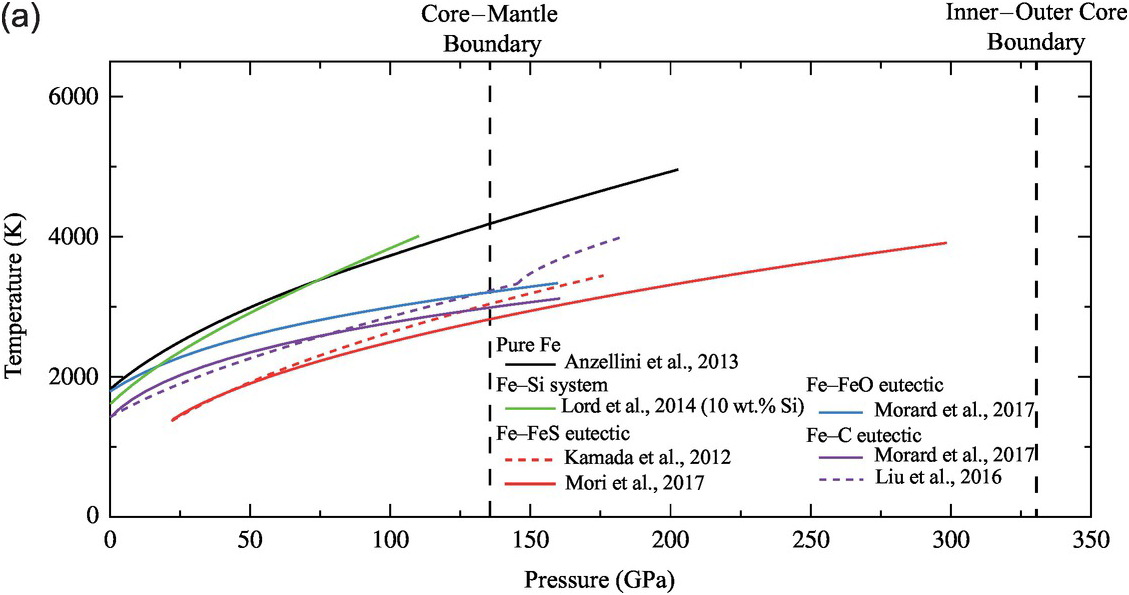
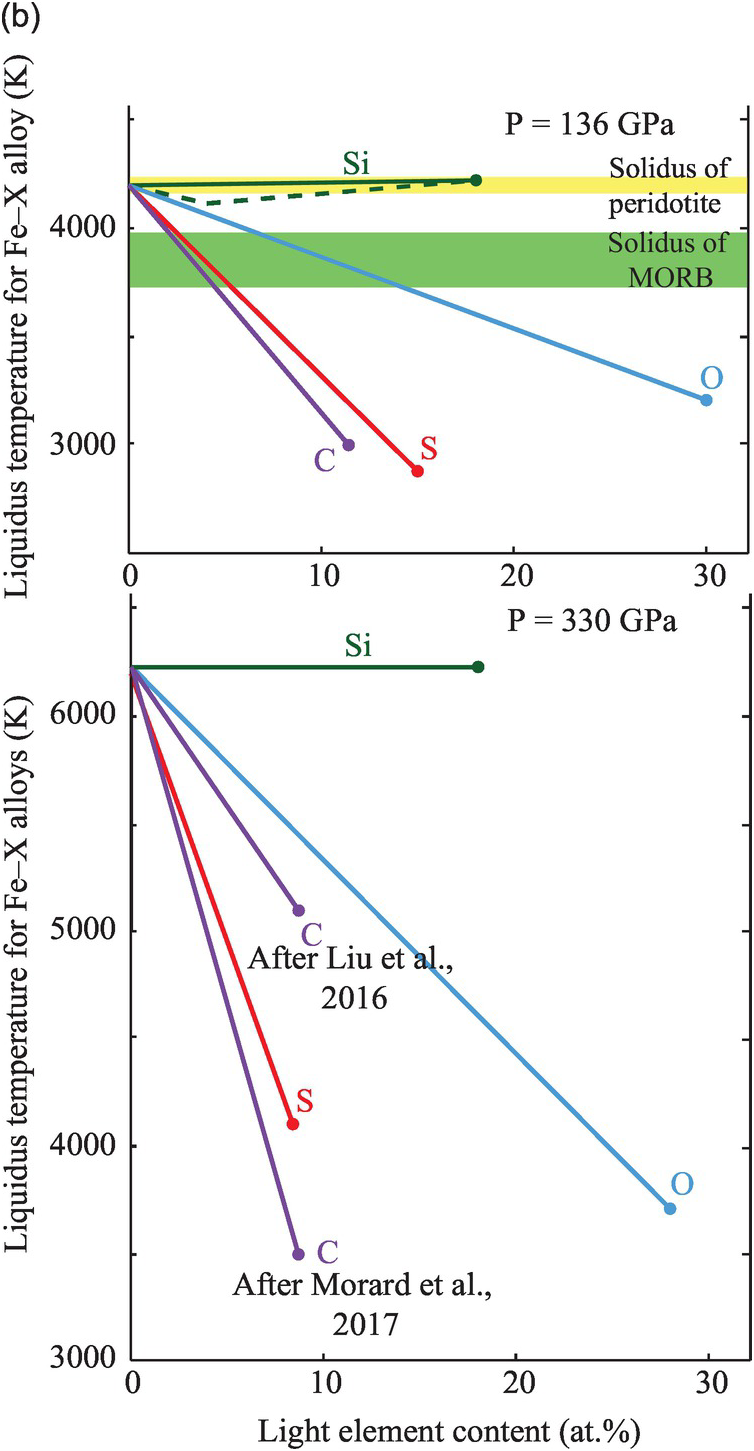
Figure 3.9 Melting temperatures of Fe-rich alloys. (a) Melting curves of pure iron,Reference Anzellini, Dewaele, Mezouar, Loubeyre and Morard38 and Fe–10 wt.% SiReference Lord110 and eutectic melting curves of Fe–Fe3S (dashed line,Reference Kamada31 solid lineReference Mori29), Fe–FeO,Reference Morard21 and Fe–Fe3C (dashed line,Reference Liu, Li, Hrubiak and Smith111 solid lineReference Morard21). The different melting curves are represented over the pressure range at which experiments were performed without any extrapolation. Pressures for the CMB and ICB are indicated by thick vertical dashed lines. (b, top) Liquidus temperatures in Fe–X systems compared with melting temperatures of mantle materials at the CMB (136 GPa), represented as linear interpolations between the melting point of pure FeReference Anzellini, Dewaele, Mezouar, Loubeyre and Morard38 and the eutectic compositions.Reference Morard21 Solidi at CMB pressure for the peridotiticReference Fiquet109 and mid-ocean ridge basalt mantleReference Andrault112 are represented by horizontal bands. (b, bottom) Extrapolated liquidus under ICB pressure for sulfur,Reference Mori29 oxygen,Reference Morard21 silicon,Reference Lord110 and carbon.Reference Morard21, Reference Liu, Lin, Prakapenka, Prescher and Yoshino52
Carbon reduces the melting point of iron. Using linear interpolation between pure Fe and the eutectic liquid, the melting point reduction is estimated at >100 K per at.% carbon at 136 GPa.Reference Morard21 At the ICB pressure, the melting point reduction effect of carbon may be similar to that at the CMBReference Liu, Lin, Prakapenka, Prescher and Yoshino52 or as much as 350 K/at.%.Reference Morard21
Experimentally determined eutectic melting temperatures agree within 150 K for the Fe–S, Fe–Si, and Fe–O systems.Reference Li, Fei, Holland and Turekian3, Reference Morard21, Reference Ozawa, Hirose, Yonemitsu and Ohishi30 Adding 1 at.% C, O, Si, and S to liquid iron reduces its melting point by 100 K for C and S, 50 K for O, and <30 K for Si at the pressure of the CMB (Figure 3.8). To pass the physical state test, a core with a single light element must contain at least 5 at.% S or C, or at least 15 at.% O.Reference Mori29 The melting points of Fe–Si alloys are too high and therefore silicon cannot be the only light element in the outer core. The presence of other light elements such as carbon, oxygen, and/or sulfur are required to lower its crystallization temperature.
Compositions containing two or more lighter elements exhibit more complex behavior. While the alloying effect of oxygen on the eutectic point of the Fe–S system was found to be minor,Reference Terasaki113 shock experiments at 100–200 GPa estimated that the presence of 8 wt.% (2.4 at.%) oxygen and 2 wt.% (1.2 at.%) sulfur would reduce the melting point of iron by 600 K.Reference Huang106, Reference Tsuno and Ohtani114 This is more than twice the combined reductions of oxygen (120 K) and sulfur (120 K), suggesting non-ideal mixing in the ternary system.
3.3 Implications of Carbon as a Major Light Element in the Core
If the inner core consists of Fe7C3 with 8.41 wt.% carbon, the average concentration of carbon in the core would be at least ~0.3 wt.%, implying that the core has nearly one order of magnitude more carbon than the total amount in the surface reservoirs and silicate Earth, and hence it is by far the largest carbon reservoir in Earth (Figure 3.1). The bulk Earth would contain 0.1 wt.% carbon, higher than the estimated 0.03 wt.% for a half-mass condensation temperature of 40 K.Reference McDonough, Holland and Turekian7, Reference Lodders115 This result would question the validity of the volatility trend for highly volatile elements such as carbon.
Recent experiments show that Fe7C3 exhibits the highest electrical resistivity among all Fe–L alloys.Reference Zhang116 As a major element in the core, carbon may influence the thermal transport properties of the core, with implications for the evolution of the geodynamo.
3.4 Carbon in the Core Over Time
Carbon may move across the CMB over geological time if chemical disequilibrium was introduced during Earth’s accretion or subsequent evolution. Earth’s core may have been initially out of equilibrium with the mantle,Reference Rudge, Kleine and Bourdon117 or the silicate Earth may have acquired most of its highly volatile elements through a late veneer.Reference Albarède118 Furthermore, chemical equilibrium at the CMB may have been perturbed as a result of secular cooling or inner core growth, which may have enriched or depleted carbon in the outer core depending on the carbon partitioning between the solid and liquid (Figure 3.2). Experiments suggest that mobility of carbon along grain boundaries may allow its transport over geologically significant length scales of 10 km over the age of Earth.Reference Hayden and Watson119 Facilitated by mantle convection, rapid grain-boundary diffusion may have brought core-derived carbon to Earth’s surface and thus connected the billion-year deep carbon cycle to the near-surface million-year shallow carbon cycle.
Ongoing carbon sequestration by the core may have resulted from subduction of the hydrothermally altered oceanic lithosphere carrying carbonates and organic matter into the deep Earth. While CaCO3 in slabs may have been preserved under reducing lower-mantle conditions, the MgCO3 component could have been destabilized by metallic iron-form diamonds or iron carbides.Reference Dorfman120 Slab-derived Fe–C mixtures are expected to partially melt in the D´´ layer.Reference Liu, Li, Hrubiak and Smith111 The melt may have accumulated near the CMB over time and episodically drained into the core (Figure 3.10).

Figure 3.10 Carbon transport from subducted slabs to Earth’s core. Schematic illustration of slab-derived Fe–C melt bringing carbon from Earth’s surface to the core, modified after Liu et al.Reference Liu, Li, Hrubiak and Smith111 The upper oval-shaped balloon shows elemental carbon or iron carbides (gray) associated with metallic iron (white) in the mantle at depths greater than 250 km. Three rectangular boxes represent Fe–C melts at the base of the mantle (heights are exaggerated): (a) Fe–C melt (yellow) that wets the solid silicate matrix (gray); (b) non-wetting Fe–C melt (yellow) coexisting with a small degree of silicate melt (green) in a solid silicate matrix (gray); and (c) solid phases (yellow–gray) that have become iron rich through reaction with the Fe–C melt. The lower oval-shaped balloon indicates dynamic stirring, which may prevent or slow down the draining of dense Fe–C melts to the core.
3.5 Conclusion
We have evaluated constraints on the carbon budget of Earth’s core by comparing the density, velocity, and elastic anisotropy of Fe–C alloys and compounds at core conditions with seismic observations. Existing data support the model of the inner core consisting of iron carbide Fe7C3, which could solidify from an Fe–C–S liquid core containing up to 1 wt.% carbon. Fe7C3 is unique in its ability to match the anomalous VS and high Poisson ratio of the inner core. Its density and VP are also broadly consistent with the PREM, but need to be further tested against the anisotropy observations. On the contrary, Fe3C seems unstable and too light to match the inner core density. Given the upper limit of 1 wt.% carbon in the core, an Fe–C alloy is unable to generate the observed density deficit in the inner core.
The presence of 1 wt.% carbon in the outer core provides a good match to the VP and is consistent with the coexistence of a molten iron alloy with solid silicate at the CMB. However, 1 wt.% carbon is insufficient to account for the density deficit in the outer core and cannot reproduce the density contrast at the ICB, and therefore other light elements such as H, O, S, or Si must be present in the outer core.
Earth’s core remains potentially by far the largest carbon reservoir of the planet. It may participate in the long-term global carbon cycle through carbon transport across the CMB via grain-boundary diffusion, mantle convection, and sequestering slab-derived Fe–C melts.
The outer core likely contains multiple light elements. At least 1–2 wt.% sulfur is likely to be present in the outer core and would help account for its density deficit and the core’s largely molten state. Oxygen may be required in the liquid outer core to explain the density contrast at the ICB, although the amount of oxygen remains uncertain. Silicon does not help explain the density contrast across the ICB or the coexistence of the liquid core with the overlying solid mantle. Existing data are insufficient to resolve the competing models of core composition because of limited data coverage in the relevant pressure–temperature–composition space and uncertainties in experimental measurements and theoretical simulations. Future studies should focus on expanding the experimental data range and investigating complex systems that contain more than one light element.
3.6 Limits to Knowledge and Unknowns
Earth’s core is potentially by far the largest carbon reservoir of the planet. To assess the role of the core in Earth’s deep carbon cycle, we need to test the hypothesis of iron carbide as the dominant component of the solid inner core and quantify the carbon content of the liquid outer core. In the past decade, research in deep carbon has significantly improved our knowledge of the physical properties and melting behavior of carbon-bearing iron alloys at the extreme pressure and temperature conditions in the deep Earth. Limits to our knowledge mainly stem from incomplete data coverage for the relevant pressures, temperatures, and compositions. For simplified compositions, the properties of liquid iron or iron alloys are still limited to relatively low pressures and temperatures far below the relevant ranges of the core. Investigations of complex iron alloys containing nickel and two or more light elements have only covered small subsets of the entire plausible pressure–temperature–composition space. Effects of temperature on the magnetic transitions and elasticities of solid iron alloys remain poorly constrained. Direct measurements of the densities and velocities of solids at inner core pressures are not yet available.
Acknowledgments
The authors thanks Rajdeep Dasgupta, James Badro, an anonymous reviewer, and Dave Walker for providing critical comments and constructive suggestions. JL acknowledges NSF EAR-1763189, NSF AST-1344133, and Sloan Foundation Deep Carbon Observatory Grant G-2017-9954. BC acknowledges NSF EAR‐1555388 and NSF EAR‐1565708. MM acknowledges XSEDE resources, NSF EAR-1634422, and NSF EAR-1753125.
Questions for the Classroom
1 How do researchers infer the presence of volatile elements such as carbon in Earth’s liquid outer core?
2 As a candidate for the principal light element in Earth’s core, what are the strongest arguments for and against carbon?
3 What is the plausible range of carbon content in Earth’s core, and how do we know this?
4 Why was an iron carbide proposed as a candidate for the dominant component of Earth’s solid inner core? How can we test this hypothesis?
5 Why is the knowledge of the eutectic composition of binary systems Fe–X, where X is an element lighter than iron such as hydrogen, carbon, oxygen, silicon, or sulfur, important for constraining Earth’s core composition?
6 How do pressure and temperature affect magnetism in iron-rich alloys?
7 What are “spin-pairing” or “high-spin to low-spin” transitions in iron-rich alloys?
8 How is the elasticity of an iron alloy affected by pressure-induced magnetic transition?
9 How do light elements such as carbon affect the thermodynamic stability of iron–nickel alloys?


 Open access