


1. Introduction
Spreading of non-Newtonian liquids on surfaces is of widespread interest in many fabrication, coating and printing applications (Derby Reference Derby2010; Mackay Reference Mackay2018; Lohse Reference Lohse2022). Among them are the extrusion-based three-dimensional (3-D) printing techniques, where digitally designed objects are built via line-by-line and then layer-by-layer deposition of ink through a nozzle. A diverse range of materials can be used in 3-D printing for various manufacturing purposes, from soft tissues and synthetic bones in biomedical applications (Placone & Engler Reference Placone and Engler2018) to food pastes (Zhu et al. Reference Zhu, Stieger, van der Goot and Schutyser2019), energy materials (Tagliaferri, Panagiotopoulos & Mattevi Reference Tagliaferri, Panagiotopoulos and Mattevi2021) and ceramics (Faes et al. Reference Faes, Valkenaers, Vogeler, Vleugels and Ferraris2015). These materials, depending on the application, are printed as single filament or monolayer (e.g. for conductive circuit printing; Postiglione et al. Reference Postiglione, Natale, Griffini, Levi and Turri2015; Zhang et al. Reference Zhang, Chi, Li, Gao, Du, Guo and Wei2016; Gnanasekaran et al. Reference Gnanasekaran, Heijmans, Van Bennekom, Woldhuis, Wijnia, De With and Friedrich2017; Valino et al. Reference Valino, Dizon, Espera, Chen, Messman and Advincula2019) or, more commonly, with multilayer printing (Lewis Reference Lewis2006; Ngo et al. Reference Ngo, Kashani, Imbalzano, Nguyen and Hui2018). The characteristics of the single-line depositions can influence directly the product quality for single-filament printing, and can also affect the overall quality of multilayer printing via setting up the first-layer deposition. Hence understanding the underlying physics of deposition of a single line of inks and the effects of rheological properties is essential to improve the design of extrusion-based 3-D printers or to design new inks based on the rheology of complex fluids (Ewoldt & Saengow Reference Ewoldt and Saengow2021). We will address the deposition of a single filament of viscoplastic (or yield stress) fluids. Such materials are neither solids nor liquids. When the external stress is below the yield stress, the material behaves effectively like an elastic solid, but when the stress exceeds the yield stress, the material deforms plastically and flows like a viscous liquid (Barnes Reference Barnes1999; Coussot Reference Coussot2014; Balmforth, Frigaard & Ovarlez Reference Balmforth, Frigaard and Ovarlez2014; Bonn et al. Reference Bonn, Denn, Berthier, Divoux and Manneville2017). Viscoplasticity is a common feature of many industrial fluids, such as waxy oil and cosmetic and dairy products. Furthermore, viscoplastic fluids represent a large group of polymeric inks used in 3-D printing (Lewis Reference Lewis2006; O'Bryan et al. Reference O'Bryan, Bhattacharjee, Niemi, Balachandar, Baldwin, Ellison, Taylor, Sawyer and Angelini2017), where, depending on the application, the values of the ink's yield stress varies (M'barki, Bocquet & Stevenson Reference M'barki, Bocquet and Stevenson2017; Paxton et al. Reference Paxton, Smolan, Böck, Melchels, Groll and Jungst2017; Siqueira et al. Reference Siqueira, Kokkinis, Libanori, Hausmann, Gladman, Neels, Tingaut, Zimmermann, Lewis and Studart2017; Eom et al. Reference Eom, Kim, Yang, Son and Chae2019; Kiyotake et al. Reference Kiyotake, Douglas, Thomas, Nimmo and Detamore2019; del Mazo-Barbara & Ginebra Reference del Mazo-Barbara and Ginebra2021; Siacor et al. Reference Siacor, Chen, Zhao, Han, Valino, Taboada, Caldona and Advincula2021). While many inks feature a relatively large yield stress of hundreds of pascals, many others are much softer, with yield stress in tens of pascals. Examples of the latter category can be found in conductive inks and energy materials used in direct writing (Zhang et al. Reference Zhang, Chi, Li, Gao, Du, Guo and Wei2016; Tagliaferri et al. Reference Tagliaferri, Panagiotopoulos and Mattevi2021), bioprinting hydrogels (Rodell, Kaminski & Burdick Reference Rodell, Kaminski and Burdick2013; Mouser et al. Reference Mouser, Melchels, Visser, Dhert, Gawlitta and Malda2016; Wilson et al. Reference Wilson, Cross, Peak and Gaharwar2017), kaolin-based materials (Sun et al. Reference Sun, Yang, Cheng, Peng, Huang and Chen2018), colloidal inks (Eom et al. Reference Eom, Kim, Yang, Son and Chae2019) and cellulose suspension (Jiang et al. Reference Jiang, Joshua, Ding, Wang, Feng, Mao, Xu and Sui2020). The main focus of the present work is to study the spreading of such soft viscoplastic inks, where the values of yield stress are comparable with the driving spreading stresses.
Spreading and deposition of viscoplastic fluids share similarities and also present different characteristics in comparison to Newtonian fluids (Bonn et al. Reference Bonn, Eggers, Indekeu, Meunier and Rolley2009). Like Newtonian (and viscoelastic) fluids, viscoplastic fluids (if soft enough) spread due to surface tension and gravity, on time scales associated with the apparent viscosity. The most distinctive trait of viscoplastic spreading, however, might manifest in the final shape. Theoretically, a Newtonian free-surface flow on a fully wetting surface spreads (due to gravity or surface tension) until it is finally completely flat (Tanner Reference Tanner1979; Tuck & Schwartz Reference Tuck and Schwartz1990; Backholm et al. Reference Backholm, Benzaquen, Salez, Raphaël and Dalnoki-Veress2014; Bergemann, Juel & Heil Reference Bergemann, Juel and Heil2018; Jalaal, Seyfert & Snoeijer Reference Jalaal, Seyfert and Snoeijer2019c). In contrast, in the same situation, a viscoplastic fluid eventually stops at a finite time, when the stress everywhere inside the material falls below the yield stress. Hence, contrary to a Newtonian liquid, a viscoplastic liquid reaches a characteristic final shape (Dubash et al. Reference Dubash, Balmforth, Slim and Cochard2009; Liu et al. Reference Liu, Balmforth, Hormozi and Hewitt2016; Jalaal, Stoeber & Balmforth Reference Jalaal, Stoeber and Balmforth2021) on a fully wetting surface. Finding the final shape for spreading viscoplastic filaments is indeed the main objective of this study. Note that in practice, it might be difficult to distinguish the deposition behaviour of a viscoplastic fluid from a highly viscous Newtonian fluid or a viscoelastic liquid with long characteristic elastic time scales. Moreover, the final shape of the complex fluid could be affected by other factors such as time-dependent material properties like thixotropy (Uppal, Craster & Matar Reference Uppal, Craster and Matar2017; Oishi, Thompson & Martins Reference Oishi, Thompson and Martins2019b; Sen, Morales & Ewoldt Reference Sen, Morales and Ewoldt2021) and solidification (Tavakoli, Davis & Kavehpour Reference Tavakoli, Davis and Kavehpour2014; Jalaal et al. Reference Jalaal, Seyfert, Stoeber and Balmforth2018; Koldeweij et al. Reference Koldeweij, Kant, Harth, de Ruiter, Gelderblom, Snoeijer, Lohse and van Limbeek2021).
The present study relates to a number of previous research lines in the literature. One is the gravity-driven spreading and large-scale 3-D printing of yield stress materials, in particular concrete (Roussel & Coussot Reference Roussel and Coussot2005; Flatt, Larosa & Roussel Reference Flatt, Larosa and Roussel2006; Ancey Reference Ancey2007; Liu et al. Reference Liu, Balmforth, Hormozi and Hewitt2016; Gosselin et al. Reference Gosselin, Duballet, Roux, Gaudillière, Dirrenberger and Morel2016; Buswell et al. Reference Buswell, De Silva, Jones and Dirrenberger2018; Garg et al. Reference Garg, Bergemann, Smith, Heil and Juel2021; Valette et al. Reference Valette, Pereira, Riber, Sardo, Larcher and Hachem2021). The major differences between the present study and these works are the characteristic length scales and the driving mechanisms. While gravity is the main force of spreading in large-scale 3-D printers, surface tension is the dominant factor at a small scale or when gravity is absent (Brutin et al. Reference Brutin, Zhu, Rahli, Xie, Liu and Tadrist2009; Diana et al. Reference Diana, Castillo, Brutin and Steinberg2012; D'Angelo et al. Reference D'Angelo, Kuthe, van Nieuwland, Ederveen Janssen, Voigtmann and Jalaal2022). This changes the underlying physics, where the competition of yield stress and capillary forces determines the final shape of the liquid. We refer to the phenomenon of capillary-driven yield stress fluids as plastocapillarity. Also related to the present study are the previous investigations on the impact and spreading of viscoplastic droplets on dry and wet surfaces (Luu & Forterre Reference Luu and Forterre2009; German & Bertola Reference German and Bertola2010; Saïdi, Martin & Magnin Reference Saïdi, Martin and Magnin2010; Blackwell et al. Reference Blackwell, Deetjen, Gaudio and Ewoldt2015; Jalaal, Balmforth & Stoeber Reference Jalaal, Balmforth and Stoeber2015; Oishi, Thompson & Martins Reference Oishi, Thompson and Martins2019a; Oishi et al. Reference Oishi, Thompson and Martins2019b; Martouzet et al. Reference Martouzet, Jørgensen, Pelet, Biance and Barentin2021; Sen et al. Reference Sen, Morales and Ewoldt2021), where, depending on the regime parameters, different factors such as inertia, elasticity, gravity, thixotropy and surface tension can determine the dynamics of the droplets. In the present work, we will focus on a different geometry (filaments) on a small scale, and a regime and type of material where surface tension and yield stress effects dominate.
To address the problem, we will use experimental and theoretical tools. The paper is organized as follows. Section 2 presents the experimental details, including the set-up and the used fluids. Section 3 provides the results, a simple scaling law, and a more detailed description of the empirical observations based on viscoplastic lubrication theory. Section 4 concludes the results and presents future perspectives.
2. Experiments
2.1. Set-up
The experimental set-up is a ‘simplified 3-D printer’ (see figure 1). The fluid was injected, using a syringe pump, at a constant rate  $Q$ through a hydrophobic nozzle with inner diameter 0.912 mm. The substrate was a glass plate, pre-wetted with a thin layer of the same fluid at constant height $h_{\infty } \approx 40\ \mathrm {\mu }{\rm m}$. The pre-wetting layer not only simulates the condition of a fully wetted surface but also allows us to avoid any complexity due to the (triple) contact line (Oron, Davis & Bankoff Reference Oron, Davis and Bankoff1997; Craster & Matar Reference Craster and Matar2009; Jalaal et al. Reference Jalaal, Stoeber and Balmforth2021; Martouzet et al. Reference Martouzet, Jørgensen, Pelet, Biance and Barentin2021). Pre-wetting was done just before the experiments to minimize evaporation effects. The distance between the nozzle and the surface of the pre-wetted film was fixed at $350\pm 10\ \mathrm {\mu }{\rm m}$. Changing this distance by $75\unicode{x2013}400\ \mathrm {\mu }{\rm m}$ did not change the results. The substrate was placed on a linear motor (Thorlabs LTS300/M). When the flow is established through the nozzle, the linear motor moves (constant velocity $U=10\ {\rm mm}\ {\rm s}^{-1}$ and initial acceleration $50\ {\rm mm}\ {\rm s}^{-2}$) and a viscoplastic line begins to form on the surface. The substrate motion continued until a line of length $80\pm 2\ {\rm mm}$ was obtained. Note that the short delays between the pump's function and the substrate's motion disturb the filament's shape at the beginning and end ( ${\sim }5\ {\rm mm}$ on each side). We perform the measurements far from these areas. Also, measurements were performed 20 s after the deposition to ensure that the final equilibrium shape was obtained. As the line is printed, it travels under a lens of an optical coherence tomography (OCT) scanner to obtain the shape of the interface. OCT is a non-invasive optical technique that uses low-coherence interferometry to obtain depth scans (Fercher et al. Reference Fercher, Drexler, Hitzenberger and Lasser2003). A series of these depth scans is then used to form a cross-sectional image. The technique has been used to study evaporating droplets (Edwards et al. Reference Edwards, Atkinson, Cheung, Liang, Fairhurst and Ouali2018), flow inside channels (Daneshi et al. Reference Daneshi, Pourzahedi, Martinez and Grecov2019), and spreading and solidification of droplets of complex fluids (Jalaal et al. Reference Jalaal, Seyfert, Stoeber and Balmforth2018). The current experimental set-up did not allow for an accurate measurement of dynamic of spreading. Nonetheless, using OCT provides many advantages for our system. In the set-up, the flat pre-wetted film, unlike the curved surface of the printed line, forms high-intensity patterns of vertical lines. This is due to the over-saturation of the reflected light on a flat surface. Hence, by detecting the edge of these patterns (vertical dashed white lines in figure 1), we were able to obtain easily the width of the filament with accuracy ${O}(10\ \mathrm {\mu }{\rm m}$). Furthermore, by adding microparticles ( $3\ \mathrm {\mu }{\rm m}$ polystyrene from microparticles GmbH) to the fluid, we were able to roughly inspect the flow inside the printed lines and ensure that the flow along the length of the filament ( $z$-direction in figure 1) was negligible, and therefore the spreading was mainly across the width ( $x$–
$x$– $y$ plane in figure 1). Experiments were repeated at least 10 times for each data point (total of $\sim$300 experiments). All measurements were performed at steady state when the filaments had reached their final shape. For each experiment, the OCT scans were performed for four cross-sections of the line, and the values were averaged.
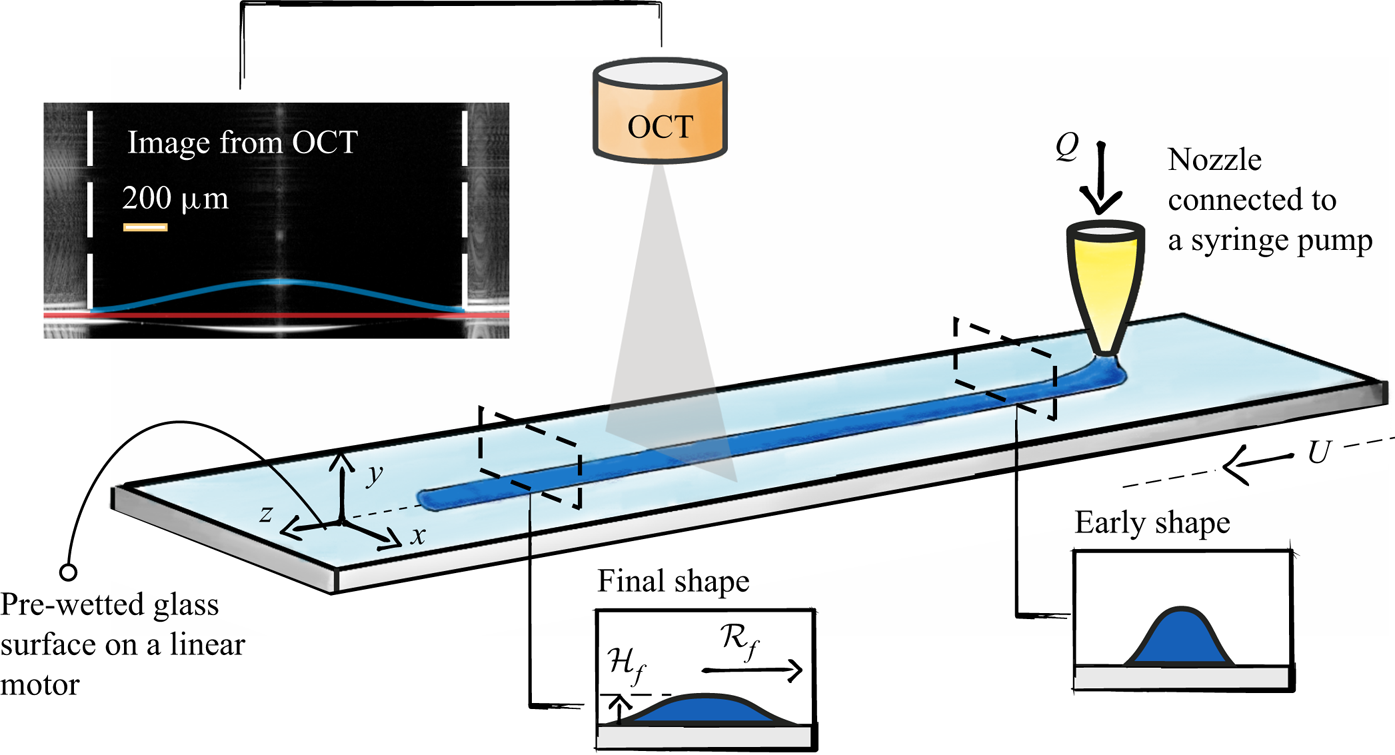
Figure 1. Experimental set-up for the investigation of printing a single line of viscoplastic fluids. The shown dimensions in the schematic are not to scale. A filament of a yield stress (viscoplastic) fluid is printed on a moving pre-wetted substrate. After extrusion from the nozzle, the filament spreads on the surface until it reaches a final width. We denote the final half-width of the filament as  $\mathcal {R}_f$. An optical coherence tomography (OCT) scanner is used to measure the final width of the filaments. An example of the OCT image is shown in the top-left of this figure, where blue and red lines highlight the interface of the filament and the substrate. The dashed vertical lines show the edge of the filament, where the surface becomes flat.
2.2. Fluids
We used a mixture of Milli-Q water and a commercial hair gel at five different concentrations. The final materials are basically aqueous mixtures of Carbopol that are pH-neutralized with triethanolamine (Dinkgreve et al. Reference Dinkgreve, Paredes, Denn and Bonn2016). The samples were centrifuged before the experiments to remove bubbles. An Anton Paar MCR 302 rheometer with a rough cone-and-plate configuration ( $2^{\circ }$ angle) was used to characterize the rheological properties of the liquids. For each sample, we obtained the steady-state flow curves as well as viscoelastic response in an oscillatory shear test. Figure 2 shows an example of measurements for one of the samples. Similar to what has been reported previously (Kim et al. Reference Kim, Song, Lee and Park2003; Dinkgreve et al. Reference Dinkgreve, Paredes, Denn and Bonn2016; Jalaal et al. Reference Jalaal, Schaarsberg, Visser and Lohse2019b), the fluids show a Herschel–Bulkley-type behaviour where the viscosities drop with the shear rate, and at low shear rates, the stress values converge to the yield stress. We therefore characterize the material properties by fitting the following equations to the flow curves (see figure 2a):
 \begin{equation} \tau - \tau_0 = K \dot{\gamma}^n, \end{equation}
where  $\tau _0$ is the yield stress, $K$ is the consistency index, and
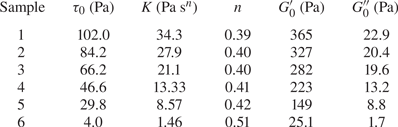
  $n$ is the shear index. The fitting values for six samples are listed in table 1. Oscillatory tests reveal the elastic-dominated behaviour at low strains/stresses with almost constant elastic and loss moduli. We quantified these values by averaging the values of $G^{\prime }$ and $G^{\prime \prime }$ at a small strain region, when $\gamma <1$ (see table 1). At large deformations, when stress exceeds the yield stress, the values of $G^{\prime }$ and $G^{\prime \prime }$ drop significantly, and the material behaves mostly like a viscous fluid with weak elasticity (see also Donley et al. Reference Donley, Singh, Shetty and Rogers2020).
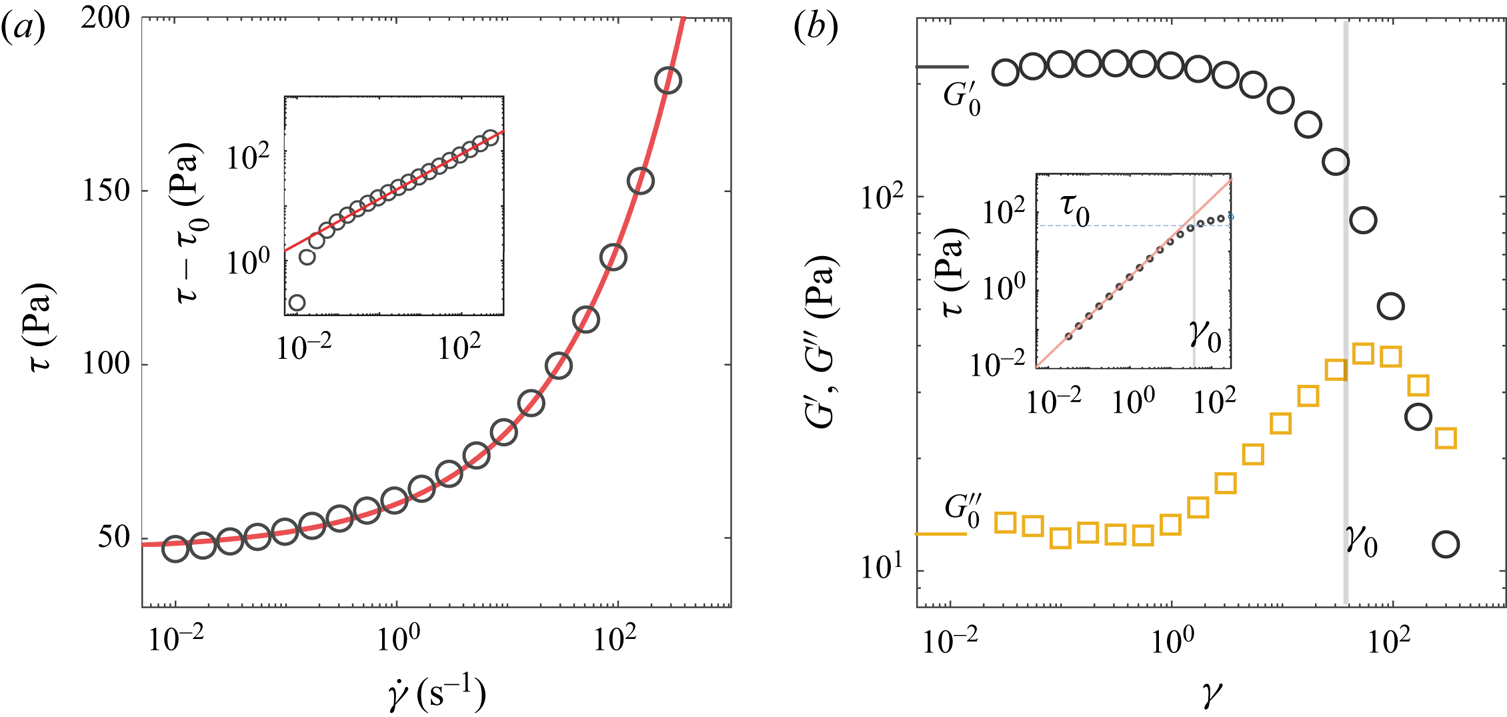
Figure 2. (a) Flow curve (shear stress versus shear rate) for sample 4 (see table 1). The inset shows the viscous stress ( $\tau -\tau _0$) versus the shear rate. The symbols are the measurements, and the red lines are the corresponding Herschel–Bulkley fits. (b) Storage modulus ( $G^{\prime }$, circles) and loss modulus ( $G^{\prime \prime }$, squares) for sample 3 as a function of strain. The vertical grey line shows the critical strain at which stress is equal to the yield stress (from the Herschel–Bulkley fit). The inset shows the variation of shear stress versus the strain. The red line is a linear fit with the slope $G^{\prime }_0 \approx 223$. The normal lines highlight the critical strain and the yield stress.
Table 1. Values of yield stress  $\tau _0$, consistency index $K$, shear index $n$, small strain elastic modulus $G^{\prime }_0$ and loss modulus $G^{\prime \prime }_0$.
The densities of the fluids ( $\rho$) are almost the same as for water (Jalaal et al. Reference Jalaal, Schaarsberg, Visser and Lohse2019b). Like other yield stress fluids, the surface tension of the materials ( $\sigma$) is hard to measure. Previous attempts in the literature (Jørgensen et al. Reference Jørgensen, Le Merrer, Delanoë-Ayari and Barentin2015) mostly report slightly smaller values than the surface tension of water. We therefore use $\sigma = 0.072\ {\rm N}\ {\rm m}^{-1}$ in our calculations, but one should take this value likely as an upper bound.
3. Analysis
The experimental results for the final half-width of the filament  $\mathcal {R}_f$, for different flow rates $\mathcal {Q}$ and yield stresses $\tau _0$, are shown in figure 3(a). As the yield stress increases, the filaments spread less, hence the values of $\mathcal {R}_f$ reduce. Meanwhile, for a given yield stress value, a larger flow rate results in a larger deposited volume of the filament and therefore larger $\mathcal {R}_f$. The latter is more pronounced when the yield stress is small. When the value of yield stress is large, the filament is less affected by the surface tension, after the extrusion from the nozzle. Therefore, the final half-width of the filament approaches the radius of the nozzle (shown by the horizontal dashed line).
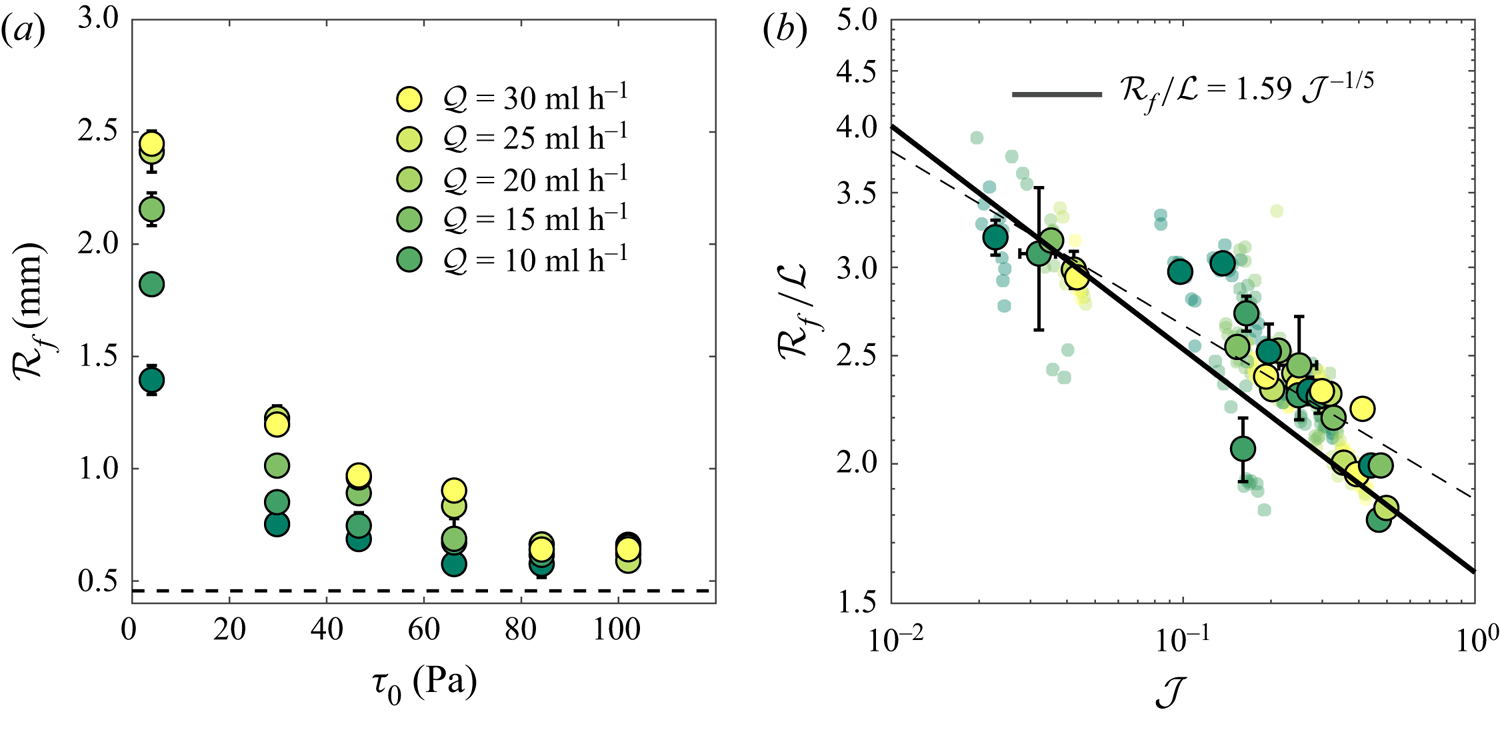
Figure 3. (a) Dimensional final half-width of the printed line for different flow rates and yield stress values. The dashed line shows the radius of the nozzle ( $\approx$0.46 mm). (b) Dimensionless half-width of the lines as a function of the plastocapillary number $\mathcal {J}$. The experimental repetitions data are plotted as small transparent points, and the large circles are the average values with standard deviations as the error bars. Equation (3.3) is plotted as the solid line. The dashed line is a power-law fit through the experiments, $\mathcal {R}_f / \mathcal {L} = 1.859\mathcal {J}^{-0.156}.$
The experimental conditions were selected such that the filaments’ cross-sectional features are small compared to the capillary length scale  $l_c =(\sigma /\rho g)^{1/2}$. We define the characteristic length scale of the filament as $\mathcal {L} = \sqrt {A}$, where $A(Q,U)$ is the cross-sectional area of the filament obtained by processed OCT images. Depending on the fluid and $Q$, the values of $\mathcal {L}$ vary between 0.2 mm and 0.9 mm. The filaments were deposited at relatively low flow rates, $Q = 10\unicode{x2013}30 \ {\rm ml}\ {\rm h}^{-1}$. Given the high apparent viscosity of the liquids and small characteristic length scales of the filaments, the inertial effects are negligible. To this end, one could define a Reynolds number for a Herschel–Bulkley fluid (Jalaal, Kemper & Lohse Reference Jalaal, Kemper and Lohse2019a) as $Re = \rho U^2 /(K(U/\mathcal {L})^n + \tau _0)$, which compares the inertial and (apparent) viscous forces, and also a Weber number $We = \rho U^2 \mathcal {L}/\sigma$, which compares inertial and capillary forces. For the experimental parameters here, $Re \sim We \sim {O}(10^{-4})$, showing the negligible inertial effects. Additionally, the small size of the filaments suggests that the gravitational effects are also relatively small in comparison with the surface tension effects. The latter could be seen in small values of the Bond number ( $Bo=\rho g \mathcal {L}^2/\sigma$, with, $0.01< Bo<0.13$), which compares the pressure due to the gravitational acceleration ( $g$) to capillary pressures. The importance of elastic effects is less obvious, given the large nonlinear variation of viscoelastic properties of the liquid under different strains (see figure 2b). An estimation for the elastic time scale can be made as $\lambda \approx (K/G^{\prime })^{1/n}$ (Bird, Armstrong & Hassager Reference Bird, Armstrong and Hassager1987; Luu & Forterre Reference Luu and Forterre2009). For $G^{\prime }$ at the critical strain $\gamma _0$, when stress is close to the yield stress, we measure $\lambda \approx 0.1\unicode{x2013}1$ s. In our experimental set-up, it takes 7–12 s for filaments to spread fully on the surface. Hence the elastic time scales are smaller than the experimental time scales, suggesting that the elastic effects might be small. Note that such a rough comparison of time scales does not necessarily show that elasticity has no effect on the dynamics and final shape of the filament. We will discuss this further in § 4. However, a rough comparison of relaxation time scales and the experimental time scales suggests that, at least to a first approximation, the elastic effects are small for the range of experimental conditions here. Hence the final width of the filament is a function of the yield stress $\tau _0$, surface tension coefficient $\sigma$, and the flow rate $Q$. The latter, in our set-up, determines mainly the volume of the line ( ${\sim }A$). Therefore, the final width can be found to be a function of a single dimensionless group, namely the plastocapillary number
 \begin{equation} \mathcal{J} = \frac{\tau_0 \mathcal{L}} {\sigma}. \end{equation}
 This number determines the yield stress ratio to the characteristic capillarity pressure. As the plastocapillary number increases, the plasticity effects become more pronounced compared to the capillary pressure, hence one can expect a line with a smaller width. In the context of 3-D printers, for a millimetric filament with surface tension close to that of water, the capillary pressure is  ${O}(10\ {\rm Pa})$, meaning that inks with yield stress ${O}(10\ {\rm Pa})$ or smaller are soft enough to spread easily on the surface. If $\mathcal {J} \gg 1$, then one could expect a very stiff filament that sustains its shape after extruding from the nozzle. This means that $\mathcal {R}_f/\mathcal {L} \rightarrow 1/\sqrt {{\rm \pi} }$ when $\mathcal {J}\rightarrow \infty$.
Figure 3(b) shows the normalized value of the final half-width of filaments ( $\mathcal {R}_f/\mathcal {L}$) versus the plastocapillary number for all collected experimental data. The normalized data suggest a power-law relationship between $\mathcal {R}_f/\mathcal {L}$ and $\mathcal {J}$. We attempt to find this relationship in the following.
3.1. Scaling law
Consider a viscoplastic filament that is spreading under capillary actions and comes to a halt due to the yield stress. The final shape of such a filament could be approximated by balancing the forces acting on the filament (Jalaal et al. Reference Jalaal, Stoeber and Balmforth2021). In this case, the driving force ( $F_{\sigma }$) is due to the capillary action, and the resisting force is due to the yield stress ( $F_{\tau _0}$), acting mainly on the base of the filament. These forces can be estimated as
 \begin{equation} F_{\sigma} = \sigma \kappa \mathcal{H}_f b \quad \mathrm{and} \quad F_{\tau_0} = \tau_0 \mathcal{R}_f b, \end{equation}
where  $\mathcal {H}_f$ is the final height of the filament, $\kappa \approx \mathcal {H}_f/\mathcal {R}_f^2$ is a characteristic curvature, and $b$ is the length of the filament. The cross-sectional area of the filament could be estimated as $A =\mathcal {L}^2\sim \mathcal {H}_f\mathcal {R}_f$. Using this, and balancing the forces in (3.2a,b), we arrive at
 \begin{equation} \mathcal{R}_f / \mathcal{L} = \varOmega \mathcal{J}^{{-}1/5}, \end{equation}
where  $\varOmega$ is a prefactor. Equation (3.3) reveals a relatively weak power-law relationship between the normalized half-width of the filament and the plastocapillary number; as the plastic effects become larger, the filament spreads less. Generally, the values of prefactor $\varOmega$ can be a function of gravity, pre-wetted film thickness, elasticity, etc. However, for the range of experimental parameters presented here, $\varOmega$ can be estimated as a constant, representing the limit of pure plastocapillarity. In the following, we present a thin-film approximation of the present problem, in which we also aim to find the value of $\varOmega$.
3.2. Thin-film approximation
We apply a lubrication theory for a shallow and inertialess flow of Bingham viscoplastic fluids (shear index  $n=1$) without gravity effects. Following the previous analyses of viscoplastic lubrication theory (Balmforth Reference Balmforth2019), and after scaling the length by $\mathcal {L}$, velocity by $\sigma /\mu$, and time by $\mathcal {L}\mu /\sigma$, we arrive at the following dimensionless depth-integrated evolution equation:
 \begin{equation} h_t=
\frac{1}{6} \left[- h_{xxx} Y^2 \left(3h - Y
\right) \right]_x, \quad \mathrm{with}\ Y =
\mathrm{max}\left(0, h - \mathcal{J} / |
h_{xxx}|\right),
\end{equation}
\begin{equation} h_t=
\frac{1}{6} \left[- h_{xxx} Y^2 \left(3h - Y
\right) \right]_x, \quad \mathrm{with}\ Y =
\mathrm{max}\left(0, h - \mathcal{J} / |
h_{xxx}|\right),
\end{equation}
where  $h(x,t)$ is the height of the filament, and subscripts denote partial derivatives. In (3.4), $Y(x,t)$ is the yield surface, corresponding to the position in which the stress is equal to the yield stress. When $\mathcal {J} = 0$, we have $Y=h$ and hence (3.4) reduces to the well-known thin-film equation for Newtonian fluids (Oron et al. Reference Oron, Davis and Bankoff1997; Craster & Matar Reference Craster and Matar2009). Equation (3.4) represents the planar (two-dimensional) version of the viscoplastic lubrication theory for droplet spreading (Jalaal et al. Reference Jalaal, Stoeber and Balmforth2021). Note that the dynamics of the thin film spreading likely differs for Herschel–Bulkley fluids where $n\neq 1$; however, the final shape should still be well approximated in the limit studied here.
To explore the dynamics of filament spreading, we solve (3.4) using a finite difference method. In our solution, the length of the domain is large enough such that the filament never arrives at the boundaries. The initial shape of the filament was  $h(x,t=0) = \max (0,1-x^2)^3 + h_{\infty }$ (Jalaal et al. Reference Jalaal, Stoeber and Balmforth2021). The first and second derivatives of the initial condition are zero at $x=1$ where it connects the interface of the filament to a pre-wetted film of thickness $h_{\infty }$ and has a height of almost unity at the centre with zero derivatives. Note that the pre-wetted film removes a genuine triple contact line and the complexities due to stress singularity (Bonn et al. Reference Bonn, Eggers, Indekeu, Meunier and Rolley2009; Snoeijer & Andreotti Reference Snoeijer and Andreotti2013). Figure 4(a) shows the numerical solutions of the thin-film equation for $\mathcal {J}=0.02$. The filament yields fully under surface tension forces at $t=0$, and spreads on the surface. Later in the process, the influence of yield stress becomes more evident as the surface tension forces decrease. The filament eventually stops deforming when stress inside the filament falls below the yield stress ( $Y \rightarrow 0$). The variations of half-width $\mathcal {R}(t)$ and maximum height $\mathcal {H}(t)$ of spreading filaments for different plastocapillary numbers are shown in figure 4(d,e), respectively. In the beginning of the spreading, the dynamics follows the Newtonian spreading (Tanner Reference Tanner1979), for which $\mathcal {R}(t) \sim t^{1/7}$ and $\mathcal {H}(t) \sim t^{-1/7}$, but eventually the curves deviate from the Newtonian limit and approach a constant value that corresponds to the final half-width and height of the filaments. The larger the value of the plastocapillary number, the sooner the filaments approach a final shape. Also, similar to what has been presented in the experiments, the filaments spread less as the value of the plastocapillary number increases.
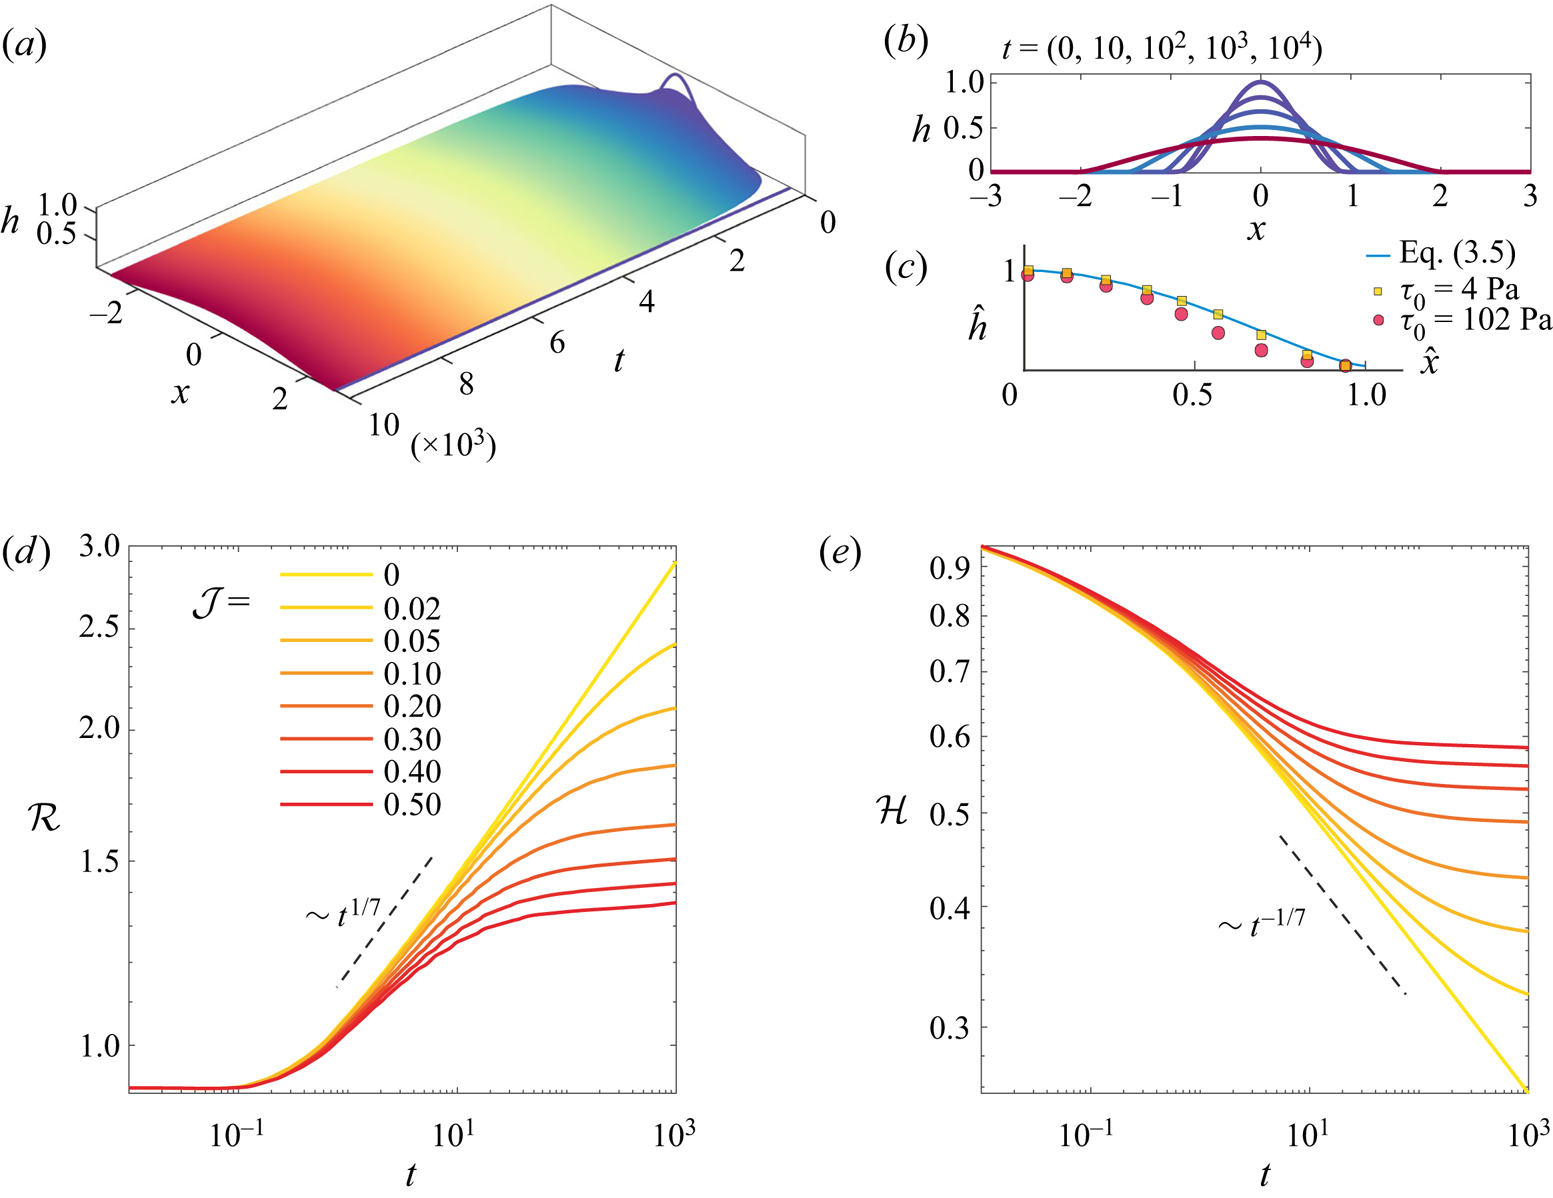
Figure 4. (a) Finite difference solution of (3.4). The 3-D dimensional plot is a quasi-representation of a line printing with  $\mathcal {J}=0.02$ at $t=10^4$. The solid black line notes the final half-width. (b) The cross-section of the line at five different times. (c) Comparison of the theoretical final shape (where $\hat {h}=h/\mathcal {H}_f$ and $\hat {x}=x/\mathcal {R}_f$) with two experimental examples of samples 1 and 6 at $Q=10\ {\rm ml}\ {\rm h}^{-1}$, where the width and height are normalized with the theoretical prediction. The variations of (d) half-width ( $\mathcal {R}$) and (e) maximum height ( $\mathcal {H}$) of the filament are shown as functions of time for different values of $\mathcal {J}$. The dashed black lines show the scaling laws for Newtonian ( $\mathcal {J}=0$) limits.
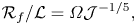
To compare the theoretical results of the final shapes with the experiments, we use the asymptotic limit of (3.4) for  $Y \rightarrow 0$, at which the flow is ceased. Hence in dimensional form, we have $\sigma h\,h_{xxx} = \tau _0$. It is more convenient to re-scale the equation at this limit with final height and half-width, i.e. $\hat {h}=h/\mathcal {H}_f$ and $\hat {x}=x/\mathcal {R}_f$. Hence
 \begin{equation} \hat{h} \, \hat{h}_{\hat{x} \hat{x} \hat{x}} = \varLambda, \quad \mathrm{where} \ \varLambda = \tau_0\mathcal{R}_f^3 / \sigma \mathcal{H}_f^2. \end{equation}
 The equation above governs the final shape of the filament with constant cross-sectional area  $A = 2 \mathcal {H}_f \mathcal {R}_f \mathcal {I}$, where $\mathcal {I} = \int _0^1 \hat {h} \,\mathrm {d}\kern0.06em \hat {x}$ is a priori unknown. From the definitions of $\varLambda$ and $A$, we find the same relationship as in (3.3), with $\varOmega = (\varLambda / \mathcal {I}^2)^{1/5}$. We solve (3.5) as a boundary value problem (cf. the recent work on droplet spreading for the details of numerical method and boundary conditions, Jalaal et al. Reference Jalaal, Stoeber and Balmforth2021) to find the final shape of the filament and $\varLambda \approx 3.53$ and $\mathcal {I} \approx 0.58$, and therefore $\varOmega \approx 1.59$. Figure 4(c) compares the obtained theoretical shape with two examples of experimental data with smallest and largest yield stress. While theory predicts the shape of the fluid with small yield stresses very well (red line versus the OCT image), such agreement is less pronounced for the fluid with a higher yield stress. A comparison of (3.3) with the obtained $\varOmega$ from the asymptotic analysis above is shown in figure 3(b). While the theoretical prediction works fine for small values of $\mathcal {J}$, the comparison suffers from discrepancies at higher values. Fitting the data with a power-law function results in $\mathcal {R}_f / \mathcal {L} = 1.859 \mathcal {J}^{-0.156}$, showing the theory underpredict the prefactor and overpredict the magnitude of the power law by about 15 % and 28 %, respectively. The difference between theory and experiments could be due to both theoretical and experimental limitations. We will discuss these limitations in the next section and provide suggestions for future work.
4. Conclusion and discussion
We have studied experimentally and theoretically the printing mechanism of a single filament of a complex fluid with viscoplastic rheology. The study was focused on the plastocapillarity regime, where surface tension is the driving mechanism and yield stress is the resisting one. The experimental set-up offers a simple configuration to study several fundamental aspects of 3-D printing of complex fluids. Additionally, optical coherence tomography (OCT) provides the opportunity to measure easily and accurately the geometrical features of the filaments, and potentially gives insight into the flow inside the filament. Our primary interest was the final width of the filaments. Theoretically, we solved the viscoplastic lubrication equations governing the cross-sectional spreading of the filaments. We also found a simple scaling law for the final half-width of the filament,  $\mathcal {R}_f/\mathcal {L} = 1.59 \mathcal {J}^{-1/5}$, where the prefactor was obtained via an asymptotic analysis. Given the complexity of the problem, and the limitations of the model, the comparison between the experimental and theoretical results shows some discrepancy (see figure 3). In experiments, the explicit effects of the pre-wetted film are not yet fully clear. It is expected that a finite thickness of the film affects the spreading (Blackwell et al. Reference Blackwell, Deetjen, Gaudio and Ewoldt2015; Sen, Morales & Ewoldt Reference Sen, Morales and Ewoldt2020) and possibly slightly increases the final width of the filament (Jalaal et al. Reference Jalaal, Stoeber and Balmforth2021). For the present study, we fixed the values of the pre-wetted film at the thinnest thickness available for our experimental conditions. This allowed us to focus on our main goal, finding the final width of the filament in a capillary-driven regime. One extension of the present work could be a systematic study on the effect of the pre-wetted film thickness on the spreading and final shape of the filament. The experiments were also performed on normal glass surfaces. For droplet spreading on solid surfaces, it has been shown that ‘apparent slip’ could change the dynamics and equilibrium shape of droplets (Jalaal et al. Reference Jalaal, Balmforth and Stoeber2015; Martouzet et al. Reference Martouzet, Jørgensen, Pelet, Biance and Barentin2021). Like the pre-wetted film, the ‘slippery’ condition of the substrate could result in a larger final width. Hence these might explain the underprediction of the theory in figure 3(b). Therefore, another extension of the work could then be to study systematically the spreading of filaments on rough or chemically treated surfaces to investigate the effect of ‘slip’. The theory presented here ignores the elastic effects. In practice, however, materials feature viscoelastic properties below and above the yield stress. Given that viscoelastic properties can influence the spreading and the final shape of the filament, further investigation is required. A possible extension of our work includes mathematical models with elasto-viscoplastic (EVP) characteristics (Saramito Reference Saramito2007; de Souza Mendes Reference de Souza Mendes2011; Dimitriou & McKinley Reference Dimitriou and McKinley2014; Saramito & Wachs Reference Saramito and Wachs2017). Such models could potentially be implemented in thin-film limit or numerical simulations that solve for two phases with moving boundaries (Izbassarov & Tammisola Reference Izbassarov and Tammisola2020; Sanjay, Lohse & Jalaal Reference Sanjay, Lohse and Jalaal2021). Using EVP models, one should be able to study explicitly different elastic effects. Also note that the presented theory assumes that the cross-sections of the filaments have a large aspect ratio (they are shallow). While this is valid for most of the experimental parameters, for the largest yield stress, this aspect ratio is around 6. The theory could be improved in non-asymptotic fashion, by retaining the full surface curvature or using numerical simulations to go beyond the lubrication limit.
Our work has direct applications in the coating and 3-D printing industries, where spreading and printing filaments of viscoplastic fluids play a key role. However, by studying a single filament of soft yield stress materials, we have not addressed a number of relevant questions in the broad context of 3-D printing. Further extensions of the present study include the spreading and welding (coalescence) of multiple filaments next to each other (Colanges et al., personal communication 2023; Kern, Sæter & Carlson Reference Kern, Sæter and Carlson2022) or on top of each other. Additionally, the regime of very large plastocapillary numbers still requires more investigation, where the deformations due to surface tension are much smaller and localized. Such investigations are required to fully address the printability of ink in relationship to rheology and fluid mechanics of 3-D printing. Moreover, a more systematic study of the flow of viscoplastic fluids near the nozzle, its effects on the filament shapes, printing on dry surfaces when contact angle dynamics plays an important role, and printing more complicated line geometries like corners (Friedrich & Begley Reference Friedrich and Begley2020) are still required. Finally, the present study focuses mostly on the final state of the filaments. More systematic experimental and theoretical studies on the spreading of filaments with complex rheology are yet to be done to reveal the dynamics of spreading. This is of great importance when the material itself features rheological properties such as shear-thinning, elasticity, aging and thixotropy (Chen et al. Reference Chen, Wang, Yang, Liao, Zhu, Zhao, Shen, Lu and Qu2018; Corker et al. Reference Corker, Ng, Poole and García-Tuñón2019; Sen et al. Reference Sen, Morales and Ewoldt2021, Reference Sen, Morales and Ewoldt2020), factors that were not studied in the present work.
The OCT easily furnishes cross-sectional images of the filament at small scales and the points it merges to the pre-wetted film. Further improvement of the system can result in simultaneous measurement of the dynamics of the spreading, rheological features of the fluid, and the flow field inside the filaments (Manukyan et al. Reference Manukyan, Sauer, Roisman, Baldwin, Fairhurst, Liang, Venzmer and Tropea2013; Trantum et al. Reference Trantum, Baglia, Eagleton, Mernaugh and Haselton2014; Edwards et al. Reference Edwards, Atkinson, Cheung, Liang, Fairhurst and Ouali2018; Jalaal et al. Reference Jalaal, Seyfert, Stoeber and Balmforth2018).
Acknowledgements
We are grateful to N.J. Balmforth for helping with the viscoplastic lubrication theory. We would like to thank N. Schramma, U. Sen, C. Seyfert, V. Sanjay and D. Giesen for useful discussions.
Declaration of interests
The authors report no conflict of interest.


 Open access