Introduction
Ice and snow cover not only prevents gas exchange, but also insulates water bodies from the thermodynamic effect of the atmosphere. Observational data and simulation results show that solar radiation becomes the main source of energy in ice-covered lakes in late winter (Reference HutchinsonHutchinson, 1957; Reference Jakkila, Leppäranta, Kawamura, Shirasawa and SalonenJakkila and others, 2009). The thickness and stratigraphy of snow-ice cover, as well as its optical properties, define the light regime in lakes under frozen conditions (Reference ArstArst and others, 2008). Usually, in lakes with stable ice cover, two main layers are distinguished: congelation and white ice (Reference Leppäranta and KosloffLeppäranta and Kosloff, 2000). Congelation ice forms in early winter and contains a small number of air bubbles. After snowfall, slush forms at the bottom of the snow layer. The slush freezes from the top and gradually transforms into white ice. Thus, sometimes there are four layers: snow, white ice, slush and congelation ice (Reference AshtonAshton, 2011). Each of these layers may include sub-layers with different densities, crystal size and content of air bubbles and other impurities (Reference Leppäranta and KosloffLeppäranta and Kosloff, 2000; Reference Petrov, Terzhevik, Palshin, Zdorovennov and ZdorovennovaPetrov and others, 2005). The optical properties of these layers are different and change over time, especially during spring melting.
The values of irradiance beneath the ice depend on the surface reflectance (albedo) and transparency of the snow-ice sheet. The albedo depends on the surface condition, solar elevation angle and weather (Reference Pirazzini, Vihma, Granskog and ChengPirazzini and others, 2006). In winter, albedo ranges from 0.6–0.8 (old snow) to 0.92–0.97 (fresh snow). During intensive spring melting it decreases sharply to 0.1–0.3 (wet surface of ice) (Reference Petrov, Terzhevik, Palshin, Zdorovennov and ZdorovennovaPetrov and others, 2005; Reference Arst, Erm, Leppäranta and ReinartArst and others, 2006; Reference Jakkila, Leppäranta, Kawamura, Shirasawa and SalonenJakkila and others, 2009; Reference Lei, Leppäranta, Erm, Jaatinen and ParnLei and others, 2011). The transparency of the snow-ice sheet is determined by its thickness and stratigraphy. The snow has the least transparency while the clear congelation ice has the greatest clarity. The light attenuation depth (e-folding depth) varies within the range 0.1–1 m in ice and 0.05–0.1m in snow (Reference ArstArst and others, 2008; Reference Leppäranta, Terzhevik and ShirasawaLeppäranta and others, 2010). The limits known to date are quite broad and require clarification. Attenuation of solar radiation can be defined on the basis of experiments with samples of lake ice and snow, and from numerical simulations (Reference Petrov, Terzhevik, Palshin, Zdorovennov and ZdorovennovaPetrov and others, 2005; Reference Lei, Leppäranta, Erm, Jaatinen and ParnLei and others, 2011). The optical properties of the snow and ice during intense melting have been studied insufficiently because of the difficulty of carrying out in situ measurements on weakened ice. Therefore, the accumulation of a large variety of observational data on the optical properties of snow and ice during melting is necessary for the parameterization of radiative transfer within the snow-ice sheet.
The main goal of our study is to investigate optical properties of the snow-ice sheet in Vendyurskoe lake, northwestern Russia, on the basis of long-term field observations (1995–2012). The objectives are (1) to explore the changes in albedo and transmissivity during spring, and (2) to investigate the effect of thickness and stratigraphy of the snow-ice sheet on attenuation of irradiance.
Study Site
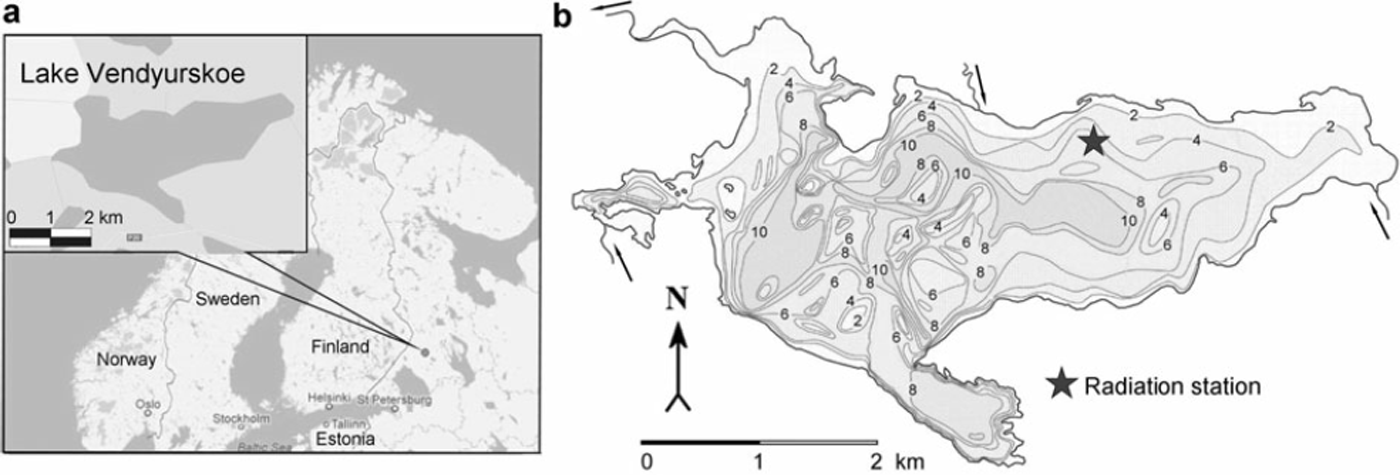
The study was conducted on Vendyurskoe lake, located in Karelia, northwestern Russia (Fig. 1). Vendyurskoe lake (62°10′ N, 33°10′ E) is a mesotrophic polymictic small shallow lake of glacial origin (surface area 10.4 km2, volume 54.8 x10⁶m3, maximum and average depths 13.4 and 5.3 m, respectively). Cluster and factor analyses were used to identify whether it can be considered a typical Karelian lake. The typification was based on the morphometric characteristics: surface area F(km2), length L (km), mean width BAVER (km), elongation factor K EF = L/BAVER, mean depth HAVER (m), maximum depth HMAX (m) and lake bed shape factor KSF= HAVER/HMAX. It was shown that Vendyurskoe lake is a typical representative of a large class of shallow Karelian lakes of glacial origin (30% of lakes) (Reference PotakhinPotakhin, 2008; Reference TerzhevikTerzhevik and others, 2010). Therefore the results of this study can be regarded as characteristic of such lakes with a mesotrophic or eutrophic status.

Fig. 1. (a) Map showing location of Vendyurskoe lake. (b) Bathymetry map of Vendyurskoe lake and location of the radiation station.
Ice and Snow Thickness Measurements
Daily measurements of ice and snow thickness and the description of their structure were carried out annually in April at the radiation station during field campaigns (Fig. 1b). On the first day, a block of ice was sawn from the ice sheet, and the thicknesses of total ice, white ice, slush and congelation ice were measured with a ruler. On the following days, ice thickness was measured in the hole with a ruler.
Measurements of ice and snow thickness and the description of their structure were carried out annually in April not only at the radiation station, but at more than 20 stations located in the central part of the lake. In addition, ice measurements were carried out in November–December 1995, 1998, 2002, in February 1998, 1999, 2002 and in March 1996, 1999, 2002, but analysis of this extensive dataset is not considered in the present study and will be undertaken in future.
Measurements of Irradiance Above and Below the Ice
Field irradiance measurements above and below the ice were carried out at the radiation station annually in April during 1–2 weeks with a time-step of 1–5 min. The down-welling and upwelling planar irradiances at the surface were measured with star-shaped pyranometers (Theodor Friderich & Co, Meteorologische Gerate und Systeme, Germany). The downwelling planar irradiance beneath the ice was registered with an M-80m universal pyranometer produced in Russia. This device was built into the foam with positive buoyancy and placed under ice at a distance of 1.5–2 m from the hole. All pyranometers were inter-calibrated under different weather conditions before the start of measurements. Further description of the devices is given by Reference Leppäranta, Terzhevik and ShirasawaLeppäranta and others (2010).
The value of albedo is calculated as a ratio of down-welling (Ed) and upwelling (Eu) global irradiances at the surface (0),

The light transmissivity of the snow-ice sheet is defined as

where Ed(z) is the downwelling planar irradiance beneath the ice.
The four-layer approach (snow, white ice, slush and congelation ice) is used to define the transmissivity as
where h and kare the thickness and attenuation coefficient, with subscripts S, WI, Sl and CI for snow, white ice, slush and congelation ice, respectively. The iterative method of best approximation (quasi-Newton method) is used to solve Eqn (3).
Irradiance beneath the ice is calculated as
Results and Discussion
Ice and snow thickness
The ice thickness at the radiation station in mid-April in different years was 0.4–0.8 m, with congelation ice thickness 0.25–0.57 m, white ice 0.10–0.27 m and slush 0–0.16 m.
Solar radiation and albedo
According to the measurements in mid-April 1995–2012, the daily maxima of downwelling and upwelling planar irradiance at the ice surface were 500–800 and 200–500Wm–2, respectively. The downwelling irradiance beneath the ice rapidly increased from 2–50 Wm–2 in mid-April to 120–190 Wm–2 at the end of April.
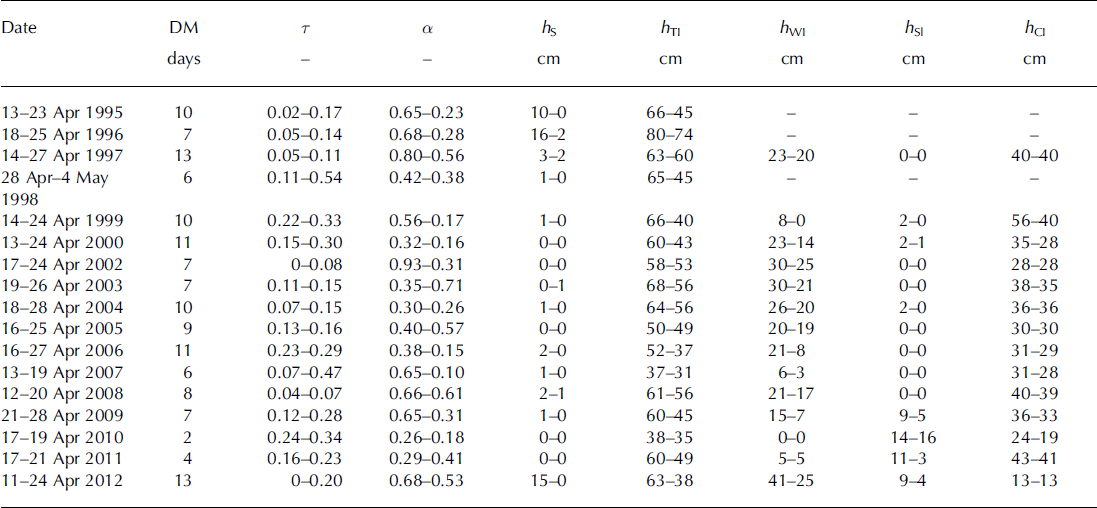
Before the start of intensive melting, the albedo was high (0.8–0.95). As melting progressed, the surface albedo decreased rapidly (Table 1). The albedo varied widely in mid-April depending on surface conditions. The data for all years of irradiance measurements at the radiation station were summarized, and the following estimates of albedo for different surface conditions were obtained: 0.8±0.15 for fresh snow, 0.6 ±0.2 for old snow, 0.35 ±0.1 for white ice and 0.2 ± 0.1 for wet congelation ice. Light transmissivity of the snow-ice sheet gradually increased from 0 to 0.15–0.3 due to reduction in thickness and change of stratigraphy of the snow-ice sheet as well as a decrease in albedo. Maximum light transmissivity of the snow-ice sheet was registered in April 1998 (0.54) and 2007 (0.47). Our estimates of albedo and light transmissivity are in good agreement with the results of measurements on other lakes (Reference BolsengaBolsenga, 1969; Reference Arst, Erm, Leppäranta and ReinartArst and others, 2006; Reference Jakkila, Leppäranta, Kawamura, Shirasawa and SalonenJakkila and others, 2009; Reference Lei, Leppäranta, Erm, Jaatinen and ParnLei and others, 2011).
Table 1. Date and duration of measurements, DM, transmissivity, r, and albedo, ä , averaged from 08:00 to 19:00, thickness of snow, hS, total ice, h TI, white ice, h WI, slush, h Sl, and congelation ice, h CI, at radiation station on the first and last day of measurements in different years. Dashes: measurements were not carried out

Attenuation of irradiance in snow-ice sheet
The average values of attenuation coefficients for the snow (18.8 m−1), white ice (6 m−1), slush (3.5 m−1) and congelation ice (2.1 m−1) were obtained on the basis of measurements of irradiance and ice thickness at the radiation station in April 1997 and 1999–2010 using a four-layer approach (Eqns (2) and (3)).
The obtained coefficients were verified by observational data on the irradiance and ice thickness at the radiation station in April 2011 and 2012, which were not used in their definition. Irradiance beneath the ice was calculated with Eqn (4). In addition, we used a three-layer approach (Reference Petrov, Terzhevik, Palshin, Zdorovennov and ZdorovennovaPetrov and others, 2005), and the following attenuation coefficients were determined on the basis of field experiments with ice blocks carried out on Vendyurskoe lake in April 2003 and 2004: 11.6 m−1 for snow, 6.9 m−1 for white ice and 2.2 m−1 for congelation ice.
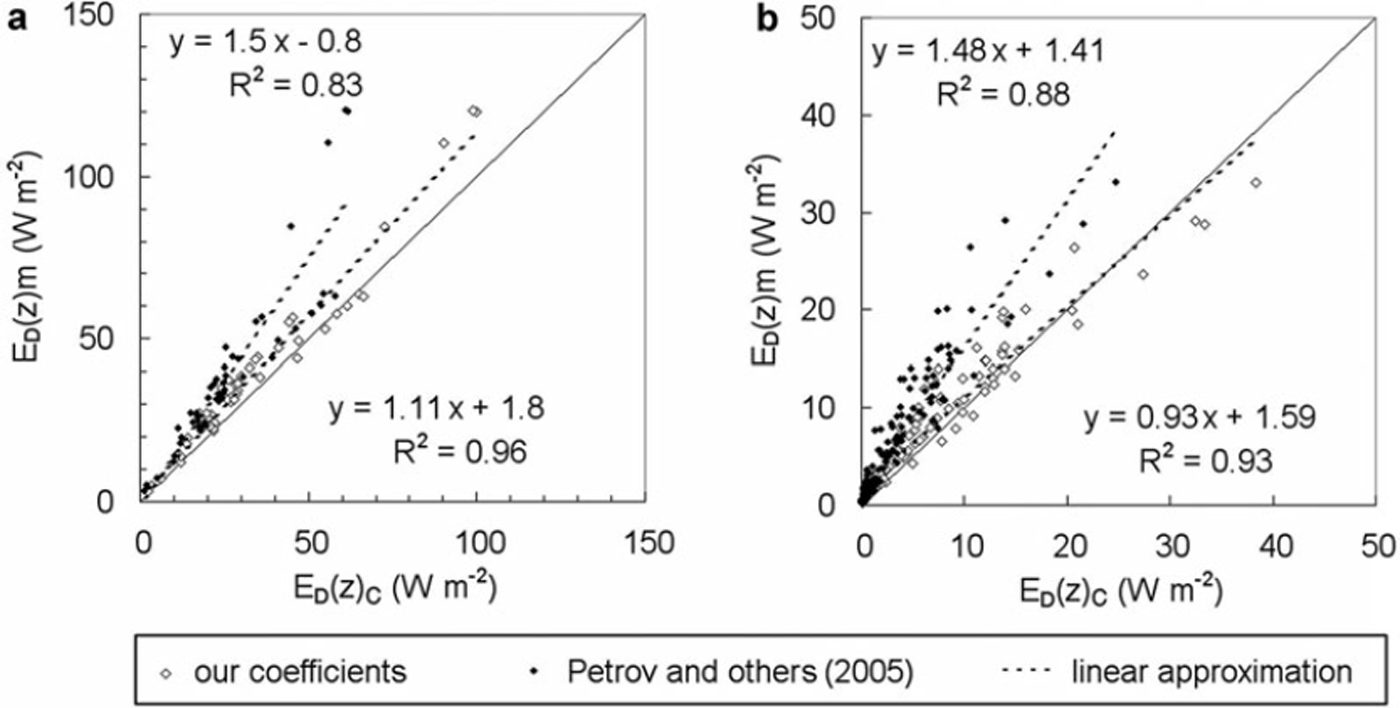
Figure 2 shows a comparison of measured and calculated values of irradiance beneath the ice for two periods: 18–21 April 2011 (Fig. 2a) and 11–24 April 2012 (Fig. 2b). Snow was absent in mid-April 2011. During 17–21 April 2011, the total ice thickness decreased from 0.6 m to 0.49 m, the thickness of congelation ice decreased from 0.43 m to 0.41 m, the thickness of white ice remained mainly constant at ∼0.05 m, and the thickness of slush layers decreased from 0.11 m to 0.03 m. During 11–24 April 2012, the snow thickness decreased from 15 cm to 0, the thickness of congelation ice remained constant at ∼0.13 m, the thickness of white ice decreased from 0.41 m to 0.25 m, and slush thickness decreased from 0.09 m to 0.04 m. The discrepancy between values calculated using our coefficients and measured values is not more than 15%, while the coefficients obtained by Reference Petrov, Terzhevik, Palshin, Zdorovennov and ZdorovennovaPetrov and other (2005) revealed 25%. In both cases, the calculated values of irradiance beneath the ice are lower than the measured values. This can be explained by deviations of the attenuation coefficients from the established average values due to the changing internal snow and ice structure during intensive melting.

Fig. 2. Calculated downwelling planar irradiance, ED(z)c, vs measured downwelling planar irradiance, ED(z)m, beneath the ice. (a) 17–21 April 2011; (b) 11–24 April 2012.
Temporal change of attenuation coefficients due to melting was observed in April 2003 and 2004 (Reference Petrov, Terzhevik, Palshin, Zdorovennov and ZdorovennovaPetrov and others, 2005). The attenuation coefficient decreased from 15 m−1 for dry snow to 10m−1 for wet snow (density 420– 480 kgm−3) as the snowflakes stayed fused, grew and became transparent during melting. The attenuation coefficient for white ice reduced from 6–8 m−1 to 3–4 m−1 (values close to slush) because rounded grains of ice (diameter 1–3 mm) and water were formed on the surface of white ice as a result of melting. The internal structure of congelation ice during melting also changed. For example, the thickness of congelation ice decreased from 0.5 m to 0.4 m during 19–24 April 1999. Simultaneously, its internal structure changed: air bubbles and vertical channels were formed (diameter 1–3mm, height 5–20mm). The size and number of vertical channels increased over time. This eventually led to a rise of scattering and absorption of irradiance and an increase in the attenuation coefficient from 2.1 m−1 to 2.9 m−1.
The comparison of observed and calculated values of irradiance beneath the ice shows that the calculated coefficients adequately describe attenuation of the down-welling irradiance by snow-and-ice cover and can be used on lakes where no such measurements have been performed.
Our estimates of the attenuation coefficients are in good agreement with the results of measurements on other lakes. For example, Reference Lei, Leppäranta, Erm, Jaatinen and ParnLei and others (2011) obtained bulk attenuation coefficients of 11–25 m−1 for snow and 1–5 m−1 for ice on the basis of field measurements in seven Finnish and Estonian lakes in February–April 2009.
Conclusion
The data of irradiance above and below the snow-ice sheet collected in mid-April 1995–2012 on Vendyurskoe lake show a significant variability of albedo (0.9–0.1) and light transmissivity (0 to 0.15–0.3) during intensive spring melting due to changing surface conditions and interior structure of the snow-ice sheet.
The attenuation of downwelling planar irradiance in the snow-ice sheet is determined by its thickness and stratigraphy. Previous research (Reference Petrov, Terzhevik, Palshin, Zdorovennov and ZdorovennovaPetrov and others, 2005) suggests that the penetration of solar radiation through the ice is controlled by its weakening in the three main layers, i.e. white ice, congelation ice and snow. We propose to take slush into account, as the four-layer approach provides sufficiently better simulation results, which are closer to the measured values than those from the former approach. The obtained attenuation coefficients can be used to model the snow-ice sheet heat budget and the radiatively driven under-ice convection, as well as light conditions under ice.
The simulation results, in both cases, underestimate under-ice radiation, probably due to varying attenuation coefficients during melting. Although the coefficients can adequately describe the attenuation of solar radiation in the snow-ice sheet, further investigations are necessary. Future research will be focused on the role of weather conditions in the formation of the snow-ice sheet and its dynamics during spring intensive melting.
Acknowledgements
The present study was supported by the Russian Academy of Sciences, the Russian Fund of Basic Research (project 10-05-91331-DFG in cooperation with the Leibniz Institute of Freshwater Ecology and Inland Fisheries (IGB), Germany, and the University of Helsinki, Finland). We thank Pjotr Boyarinov, Alexander Glinsky, Andrei Mitrokhov, Michail Petrov, Maksim Potakhin, Alexey Tolstikov and Andrei Georgiev for their efforts in collecting observational data, Maria Bogdanova for help with preparing the figures, and two anonymous reviewers for valuable suggestions.


