


Introduction
Low-frequency acoustic emissions are observed from snowpacks before avalanche release (Reference GublerGubler 1977[b], 1979, 1980, Reference SommerfeldSommerfeld 1977, 1980[a]k however, Bowles and Reference St Lawrence and BradleySt Lawrence (1977) reported negative results from a single avalanche. The different results appear to be attributable to different techniques of data analysis and to ambiguities inherent in the observations (Sommerfeld 1932). Because of promising early results, we have continued to work on acoustic emissions from snow in the range 5 to 100 Hz, with a view to increasing the reliability and accuracy of avalanche predictions. Direct relationships between acoustic emissions and slope stability, and clues to the release mechanisms of avalanches have been sought.
The work has shown that acoustic signals have predictive value. It also is evident that there are significant limits to the accuracy and reliability of the predictions. There is no precise method of determining the stability of a snow slope; only if it is possible to see the slope can one tell whether or not the slope has avalanched. This is a severe limitation because of poor visibility during storms. Not all low-stability slopes avalanche, as is evidenced by the fact that many more avalanches are released from artificially triggered slopes than from undisturbed slopes. Explosive control does not give complete evidence on stability. It is thought that explosives can force a marginally stable slope into instability (Reference WilliamsWilliams 1978), or that explosives may not activate an instability under some conditions if the placement is not correct (Reference GublerGubler 1977[a] and [b]). It is widely agreed that a snow slope can change its condition of stability radically, in either direction, in a few hours or days with no visible indication (Perla and Martinelli 1976). These circumstances add to the difficulty of determining the relationships between acoustic emissions and snow-slope stability.
With ambiguities in the stability evaluation and the acoustic data, mistakes are possible on both counts in determining the relationship of levels of acoustic emission and slope stability. When they do not agree, it is possible that either may be in error. When they agree, it is possible that they are both in error. Under these circumstances, considerable judgment must be used in the evaluations. Also, it is necessary to record a large number of events to be sure that the data are real and do not represent random fluctuations. Since avalanches are rare events, it has taken several years to acquire a sufficient amount of data to support the conclusions given here. This paper is not meant to be the final word on the problem but to show, in our best judgment, where the field stands, which applications may be possible, and what further work is indicated.
Acoustic sources in snow
Acoustic emissions in snow are displacement waves which can originate from fractures in the snow or from the frictional sliding of gliding snow or snow creeping around obstacles (Leaird and Plehn in press). We propose the terms type I for the seismic type of signals originating from fractures, and type II for signals due to frictional sliding. As will be seen, the type I signals have been observed, but there is some ambiguity in the observations of type II signals.
The breaking of bonds between ice grains seems to be the main source of acoustic emissions in seasonal snow (St Lawrence and Bradley 1973). The bonds between the chain grains that connect the more rigid clusters are more highly stressed (Gubler 1978[c]). These break, and part of the released energy propagates from the broken bonds as displacement wave packets. The frequency spectra of such events are in the ultrasonic range (St Lawrence and Bradley 1973) and are determined mainly by the speed of fracture propagation in the bond ice, the bond diameter, and the resonance frequencies and dissipation of the intergranular network. At low strain-rates and small strains, ductile creep can occur in the ice network and redistribute the stress at a rate which is high enough to avoid macroscopic stress concentrations. Under these conditions, the bond breaks do not aggregate, but occur independently and generate no significant low-frequency acoustic components. This behavior is typical of ductile rupture and deformation.
If the local strain-rate is increased above about 10−4_s−1, ductile deformation may develop into brittle fracture propagation. In this case, the broken bonds aggregate into cracks with significant stress drops in the fracture planes, and low-frequency components are generated. Their spectra are mainly determined by the ratio of the speed of fracture propagation in snow to the radius of the fractured area (Reference BruneBrune 1970, 1971, Reference DahlenDahlen 1974). As these cracks open, stress and strain-rate concentrations occur at the crack boundaries, locally driving the snow into more brittle behavior. This transition in behavior from stable and viscous to unstable and brittle, which is associated with the formation of cracks, is clearly shown in the work of Reference NaritaNarita (1980). At strain-rates below 10−5 s−1, he observed stable, nonlinear, viscous behavior with the stress increasing with increasing strain-rate and no crack growth. Between 10−5 and l0−4 s−1, there was a transition zone where the strain-rate was relatively independent of stress with stable crack growth. At rates above 10−5 s−1, he observed unstable behavior where the stress decreased with increasing strain-rate and brittle fracture occurred. Singh (unpublished) observed similar behavior with larger samples and of lower density.
In a snowpack with portions under conditions of higher strain-rates, the strain-rate can be decreased and propagation of fractures arrested only by stress redistributions from fracturing planes to more stable parts of the snowpack. This leads to the conclusion that type I acoustic emissions indicate low stability in snowpacks. Ultrasonic emissions at low strain-rates do not indicate instability (Reference St LawrenceSt Lawrence 1980), but may indicate strain softening as an initial process leading to strain-rate concentrations that cause propagating fractures and low-frequency acoustic emissions.
When natural strain-rates are averaged over lengths of 3 m, even under high, fracture-producing loading rates, they are in the range 10−7 s−1 (Reference SommerfeldSommerfeld 1979). Strain softening, acoustic emissions, and fracture cannot occur at these rates. The fact that Reference SommerfeldSommerfeld (1979) observed fractures leads to the conclusion that the strain must be concentrated in regions where the lengths are appreciably smaller than 3 m. Strain-rate concentrations at weak layers, and other inhomogeneities, may initiate ductile rupture and lead to stable or unstable fracture propagation. Locations in the snowpack where these processes start were termed primary fracture volumes by Gubler (1978[b] and [c]).
Fracture sizes (dislocation areas) may be estimated from the frequency spectra of the low-frequency acoustic emissions (Reference BruneBrune 1970, 1971, Reference DahlenDahlen 1974). The signal frequencies in the range 10 to 100 Hz and a velocity of fracture propagation of about half the shear-wave velocity give dislocation radii of 0.1 to 1.0 m. This is consistent with the results of Gubler (1977[a] and [b]), who found signal frequencies of about 30 Hz for dislocations of 1 m caused by small explosive loads. It also agrees with the conclusions of Sommerfeld (1979, 1980[a]).
The origin of type II acoustic emissions is more problematic. They are characterized by an increase in the noise level which extends over a relatively long period of time. He believe that this type of emission results from frictional sliding, either by gliding snow or by differential movement around an obstacle or at a weak surface (Leaird and Plehn in press). However, an alternative hypothesis is that these signals are the cumulation of many low-level type I signals detected over a wide area. The determination of the character and source of this type of signal is difficult, since they generally have no distinct onset and have complicated frequency and phase characteristics.
Experimental Observations
Instrumentation
The basic signals to be detected are low-frequency displacement waves. The displacements are of the order of micrometers, and their direct measurement is impossible without a precise ground reference. The necessary instrumentation would be expensive and difficult to match to snow. The next most direct sensor is an inductive velocity gage with an inertial mass moving in a coil. The induced current is proportional to the velocity of the moving mass, which is suspended on a spring. To achieve good sensitivity, the mass must be relatively large, giving a low resonant frequency and good sensitivity to low frequencies. The resonance peak is usually suppressed with resistance damping.
The first observations of low-frequency acoustic emissions from snow were made using velocity gages resonant at 28 Hz (Geospace HS-1 geophonesFootnote * . These sensors were either mounted on concrete pads in the ground or were floated in the snowpack near avalanche starting zones (McNair and Wolfe 1977, St Lawrence and Bradley 1977, Reference SommerfeldSommerfeld 1977). The velocity gages used for observations reported in the present paper were made with critically damped geophones resonant at 5 Hz (Geospace HS-1) and, more recently, with critically damped geophones resonant at 8 Hz (Geospace GS-30). Although the sensitivity of the original snow-mounted geophones was found to be better, severe problems of resonance forced their abandonment. Gubler (1977[a] and [b]) developed a sensor based on an accelerometer with a mount of plastic foam. For good acoustic coupling the density of the sensor was matched approximately to the snow. These sensors were used for the present study in Switzerland.
For a given displacement amplitude, the output of an inductive device increases with signal frequency, while for a piezoelectric device such as an accelerometer, the output increases with the square of the frequency. Depending on the basic sensitivity of the sensors, there are sensitivity crossovers with respect to a given dislocation amplitude at different frequencies. For the GS-30 geophones and the type of accelerometers used in Switzerland, this crossover is just below 30 Hz. The low-frequency geophones have the additional advantages of a low output impedance and significantly lower cost. Their main disadvantages compared to piezoelectric devices are a significant loss of sensitivity when they are tilted more than 15_ and their relatively large weight and size. Tilting is a serious problem in snow because creep can cause tilting of this magnitude in the course of a few months. Also, it is difficult to orient the sensors acccurately during installation under field conditions. The density-matched mounts embedded in the snow cover proved better in that they select for snow emissions in preference to environmental noise and avoid signal attenuation because of impedance mismatching between the snow and the ground. They can be embedded in the active emission layers, further increasing the signal-to-noise ratio.
To combine the advantages of both types of sensors, a lightweight geophone (Geospace GS-30) was mounted in a foam cylinder similar to that used for the accelerometer sensor. An X100O preamplifier was also mounted in the cylinder as shown in Figure 1. The sensor system has a density of about 200 kg m−3, similar to older or windblown snow.
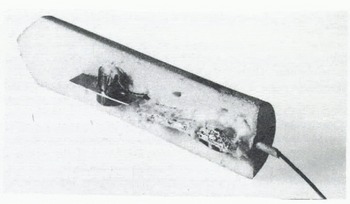
Fig. 1. Cutaway view of a geophone and preamplifier mounted in a foam cylinder.
This sensor was tested for resonances on a shaker table. The response was smooth in the range 5 to 123 Hz, which was the frequency range required in these studies. A peak at 150 Hz corresponded to the specification sheet supplied by the manufacturer, although in the foam mount it was of somewhat lower amplitude than specified. Field testing of this sensor has also shown a clean response and good sensitivity to snow noise, but occasional problems with excessive tilt.
Acoustic emissions from snow are of very low amplitudes. Displacement amplitudes are of the order of 10−7 to 10−6 m with velocities of 10−6 to 10−5 m s−1. The corresponding sensor outputs are 5 to 50 _V for the GS-30 geophone and 1 to 10 nC for the accelerometer sensor. A high level of amplification is necessary to bring the signals up to usable levels. Electronic noise pickup can be a severe problem, and care must be taken with shielding. Previous systems used in Colorado (McNair and Wolfe 1977, Sommerfeld 198Q[a]) have not been satisfactory in this regard, and the preamplifiers were found to have an annoying low-frequency resonance. The circuits shown in Figures 2 and 3 have proved very satisfactory in laboratory and field operation.
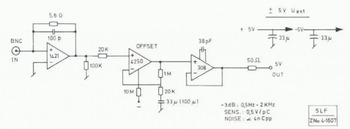
Fig. 2. Circuit diagram of the charge amplifier for accelerometers.
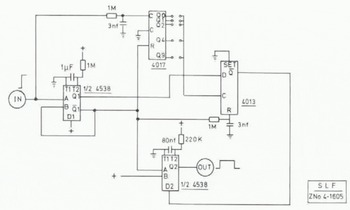
Fig. 3. Circuit diagram of the preamplifier for geophones.
Data analysis and display
Methods of data analysis and display have varied among workers. St Lawrence and Bradley (1977) displayed their data directly on a seismic drum recorder. This method tends to emphasize isolated spikes, which are the low-frequency components of type I signals, whereas the type II signals are of smaller amplitude and are inore persistent.
Sommerfeld (1977, 1980[a]) recorded his signals on analog tape using direct-record circuitry and then analyzed them as (1) root mean square (RMS) amplitudes, (2) counts above a constant level, and (3) with Fourier techniques. Tape recording preserves the original signal shapes and allows different analyses to be run on the same data. However, it is more subject to errors and to mechanical breakdowns because of the more complicated recording system. The direct-record method degrades the analysis of counts above a trigger level to some extent because the absolute voltage level is not very reliable over long periods of time with this technique.
Gubler_s data, obtained between 1977 and 1982, were collected directly as number of counts above a trigger level. This method loses some information concerning the signal shape. However, it has the advantages of reliability, mechanical simplicity, low power consumption for remote applications, and simple data handling and storage for online analyses.
Analyses of RMS amplitudes and event counts have the disadvantage that they are sensitive to such environmental noises as airplanes, road traffic, wind, and natural and artificial seismic signals. However, the signatures of many of these signals are such that they may be differentiated from the type I signals by means of simple pattern recognition. Many of the signals due to environmental noise have large amplitudes or are long trains of waves. The circuit shown in Figure 4 is effective in reducing such signals. Only events that trigger the discriminator less than five times per second are counted. Additionally, direct measurements of ground signals with a ground-mounted seismometer, and of airborne signals with a microphone, help with data interpretation.
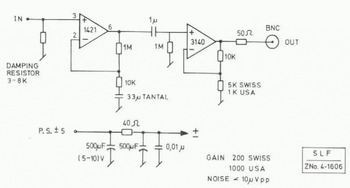
Fig. 4. Circuit for pattern recognition.
Observations and Discussion
Two types of noise originating from the snow have been detected: isolated spikes (type I), and low-level, persistent noise (type II). Type I spikes have been observed at Berthoud Pass in Colorado, Davos in Switzerland, and Bridger Bowl in Montana (Fig.5.). The differences in signal shape are mainly due to the different passbands of the sensing and recording systems.
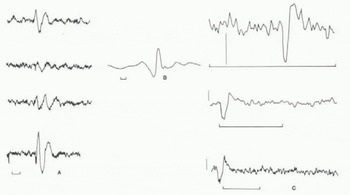
Fig. 5. Type I spikes: A. Berthoud Pass, Colorado, B. Bridger Bowl, Montana, C. Weissfluhjoch/Davos, Switzerland. Horizontal bars represent 200 ms. Vertical bars in C represent 10−3 m s−2.
Observations in Colorado
In a study by Rose (unpublished), the locations of seven events were estimated from data obtained at Berthoud Pass. He also calculated stress drops and dislocation areas, although here his assumptions may be open to criticism. This study shows that type I signals can be detected over the range of a few meters. A greater range may be possible by use of better sensors than were employed in this study. However, it is unlikely that a range of more than 10 m can be achieved for type I signals in daily operation.
The collection and analysis of data at Berthoud Pass have emphasized the presence of type II signals. This type of signal is incoherent but generally remains in a frequency band about 10 Hz wide for tens of hours. This frequency band usually appears in the range 20 to 40 Hz, but it can be between 5 and 100 Hz. The center frequency may slowly shift with time. For dry slab avalanches at Berthoud Pass, the RMS amplitude is very rarely more than three times the usual background noise originating from the environment. This is a very noisy site, and the background noise can vary by about 50%, making it difficult to obtain an unambiguous estimate of the type II noise under all conditions.
Selecting for type I noises, embedding the sensors in the snow, and estimating the environmental noise by using external sensors might help to decrease these ambiguities.
The main evidence that the type II noise originates in the snow at Berthoud Pass is the fact that it correlates well with known slope stability in the immediate vicinity of the sensor. Of the total of 55 cases acquired at this location, there were 43 (78%) correct _predictions_ (the quotation marks are used since all data were analyzed after the events). There were 23 cases of low ambiguity. In these cases the emission levels were unambiguously high or low and the experimental slope was tested in some way. The correlation between the RMS signal level and slope instability was positive in 21 cases (91%). The degradation in the information comes from 27 cases where there was significant ambiguity in the evaluations of slope stability. There were 17 (63%) correct _predictions_ in these cases where the estimate of the slope stability was made from tests on the surrounding avalanche paths. This agrees with the recent results of Judson (in press), who shows that there is very poor correlation among avalanche slopes in the Colorado Rocky Mountains. The remaining S cases were of ambiguous noise levels. Although they gave 100% correct _predictions_, such ambiguous noise levels would be unusable for operational predictions. On the positive side, none of these were associated with major instabilities in the experimental area. The observed slides in the cases of ambiguous acoustic level were all shallow slides on a deep snowpack, and they all occurred at a slope distance of several meters from the sensors.
Some discussion of the two erroneous cases is warranted. Although they were judged to show minimum ambiguity in both acoustic level and stability estimate, some doubt remains because of the difficulties involved in estimating stability. In the first case, the slope gave a high emission rate but was not released under foot testing, which is known to be a weak trigger. The possibility remains that it might have released under ski or explosives control. In the second case, the failure propagated into the experimental area from adjacent explosive control. However, some instruments in the new snow above the acoustic sensors were not disturbed. The cracks ceased to propagate a few meters before entering the sensor area, as is evidenced by the fact that the crown face had begun to thin. Thus, the snow immediately in the sensor area was stable. It is possible that the whole experimental slope was essentially stable, but susceptible to crack propagation from outside, in the manner of Perla_s (1975) cooperative failure.
Two interesting sequences of high noise-noise decrease-avalanche should be discussed. This sequence is also observed in failures of rock in mines (Leighton and Steblay 1977, Hardy and Leighton 1980), but has not been adequately explained. It is possible that these are cases of crack arrest for a period of time in which a metastable equilibrium persists with low stability but no further crack growth, or that this is a manifestation of the Kaiser effect where a stress drop in the fracture area, followed by a stress buildup, does not produce further emissions until the stress level exceeds the previous level (Bradley and St Lawrence 1975).
Observations in Switzerland
The main sources of decreased stability in the Colorado Rocky Mountains probably differ from those in the Alps. For midwinter conditions, wind loading of release zones without simultaneous precipitation is of much less importance in the Alps because the contributing areas and the catchment areas are smaller and the snow is usually of a lower erodibility. Loading occurs mainly during periods of heavy precipitation and may include wind transport during storms. In general, there is more precipitation in the Alps. Most natural avalanching occurs during or immediately after storms, with stability normally increasing much faster after the storms than is the case in the Colorado Front Range. The amount of precipitation is one of the most important factors, while wind transport determines the range of aspects of avalanche occurrence. For spring conditions, including avalanching of gliding snow, solar radiation and temperature are the most important triggering factors.
Field experience and tests with numerical forecasting models (Obled and Good 1980, Buser personal cor.iwunication) show good correlations among avalanche occurrences for a given storm pattern or weather type. The _nearest day_ model searches a library extending back for 20 years for similar situations with respect to weather type and snow-cover development. This model often shows similar patterns of avalanche occurrence for similar days.
Personnel involved in avalanche safety in the Alps have had good success in using test slopes to check stability for certain aspects and height ranges. Reference BonnetBonnet (1980) used seismic methods to show that a high correlation exists among avalanche occurrences in the French Alps. These circumstances indicate that it is much more accurate to estimate the stability of a slope in the Alps from surrounding slopes than it is in the Colorado Front Range. This leads to more reliable data.
Observations in Switzerland for the past five years show an almost perfect correlation between numbers of acoustic events measured in small stress zones and natural avalanching on similar but larger nearby slopes of the same aspect and elevation.
The Swiss site is environmentally quieter. Here, count rates that are up to 100 times larger than the variance of the background noise have often been recorded during unstable periods.
Tests with different threshold levels show that for index measurements in small stress zones the threshold should not be higher than 10−3 m s−2 for sensors based on accelerometers or 5 × 10⁻⁶ m s−1 for velocity gages in the bandwidth 5 to 100 Hz. In addition, the sensors should be placed in or very near the active layers. The sensors should be separated from the ground and the upper snow surface by 0.2 to 0.5 m. This decreases sensitivity to ground noise and noise originating from wind and other surface disturbances.
Measurements made during three seasons from mid-December to the beginning of March yielded the following results. There were 42 days with an increased event rate on at least one sensor and with independent Indications of low stability in the general area. There were 112 days with only background levels of events and no indications of natural avalanche occurrence or gliding. On 16 days, increased event rates were correlated with indications of gliding. Eight days with high event rates were recorded when there were no clear, independent indications of low stability. In seven cases, avalanches started in the immediate sensor area and were clearly predicted by the event rate. During spring 1981, there were many more days with high event rates caused by gliding and one avalanche starting from gliding snow. Days with known high environmental noise, such as that caused by maintenance, ski tourers, and aircraft, were excluded from the data. If dry, loose snow avalanches and shallow slab avalanches are excluded, no case has been observed where natural slab avalanches occurred at the location of the sensor or at corresponding slopes without increased event rates. In a few cases, avalanches were triggered by explosives one or two days after the event rate for the corresponding slope settled to its background level. These events are similar to the two cases from Colorado discussed above. This is an indication that the stability may remain at a low-level steady state with the strength and stress remaining constant without further fracturing or stress redistribution. Such a state would not be expected to produce the type of events which were monitored.
In some cases, ambiguities remain concerning the source of noise although the index indication was correct because wind noise, which was monitored, was not recorded. There were also cases where stability was decreased by solar radiation at low temperatures, with no glide. In one of these cases the slope was ski-tested at the location of the sensor. The slope was found to be stable in the morning and unstable in the early afternoon, in perfect agreement with the event count. In a second case, a nearby slope released naturally in about one hour during which the event rate was high. Further examples are given by Gubler (1977[b], 1979, 1980).
Comparisons and Conclusions
The fact that type 1 noise is detected from widely different areas in Colorado, Montana and Switzerland indicates that the conclusions presented here are of wide application. Type I emissions suggest that there are inhomogenelties in the snow cover and that these cause local stress and strain-rate concentrations, consistent with the observations of Reference SommerfeldSommerfeld (1979) and of Marita (1980). These conclusions also support the concept of primary fracture volumes suggested by Gubler (1978[a]. The frequency spectra of these emissions support the conclusion that these volumes are in the range 10−3 to 1 m3, agreeing with Sommerfeld (1980[b]), Singh (unpublished), and Reference NaritaNarita (1980). These conclusions have important applications in the artificial release of avalanches (Gubler 1978[b]) and, in general, in the understanding of the mechanisms of avalanche release.
There is a clear difference in a comparison of the data on type II emissions from Colorado and Switzerland. The site in Colorado is a rough, rocky slope with a cold snowpack; gliding has never been significant on such slopes (Frutiger and Martinelli 1966). By comparison, the Swiss site is smoother and grass-covered, and the snowpack is usually warmer; gliding is more likely to occur under these conditions, and large glide cracks are occasionally observed here but never on the Colorado site. When the snowpack on the Colorado site becomes wet In the spring, it is known to be very stable and acoustic emissions always drop to a very low level. In contrast, on the Swiss site, full depth slabs starting from gliding snow correlate well with large-amplitude type II emissions. Often the opening and growth of glide cracks can be observed during periods of high, type II emission activity. Furthermore, this type of activity correlates with weather conditions that would be expected to increase gliding (Reference GublerGubler 1979).
Two hypotheses might explain the two types of emissions that have been observed. (1) They may have the same source. In this case the type I emissions would be those few that occur near the sensor, while the type II emissions would be the sum of many such spikes whose distorted signals are detected from a much wider area. (2) The sources of the two types may be different. It seems apparent that the type I spikes are due to limited tension cracking. The type II emissions may be due to relatively rapid shearing between layers; that is, a result of frictional sliding. The fact that the known glide between the snow and the ground gives the highest levels of type II noise lends support to the argument that this type of noise is due to frictional sliding. Furthermore, this second hypothesis is consistent with the results of seismic studies. Reference ScholzScholz (1968) presents evidence that both small rock samples and earthquakes give relatively more low-amplitude signals than brittle fractures. Slow, stable frictional sliding of some sort between layers is thought to be a necessary precursor to snow avalanches (Perla and LaChapelle 1970, Smith and Curtis 1974, Reference McClungMcClung 1979). The resolution of this problem should lead to a better understanding of the mechanisms of avalanche release.
The information gained from studies of acoustic emissions from low-stability snowpacks shows that this is a promising technique for the prediction of wet slab avalanches. It might also be used as an additional source of information in the prediction of large, dry slab avalanches at specific locations. The prediction of small, dry slab avalanches is very difficult and probably not possible under realistic operational conditions. A limitation concerns the restricted range of detection of the signals. In Colorado, Judson (in press) has found very poor correlation among the stabilities of different avalanche paths. This is consistent with the results from Berthoud Pass, as discussed above. It is unknown whether Judson_s results are specific to the Colorado Front Range or are more general. Experience in the Alps suggests that Judson_s results may only be valid for climates with conditions of low precipitation and high winds.
The best combination of data analysis and display is still problematic. The interpretations of data presented here were made by very experienced observers. The fact that interpretation requires a high degree of judgment indicates that the possibility of error is correspondingly high. An effort was made in the present analysis to avoid prior knowledge affecting the noise evaluation, but a procedure of this type is notoriously risky. Better techniques for data analysis and display are necessary if acoustics are to be used in routine prediction of avalanches so that the amount of judgment necessary is reduced.
If a combination of type I and type II emissions is to be monitored, a display of RMS amplitudes with some time-averaging, including a system to reduce environmental noise, would be necessary. This type of monitoring is indicated where creeping or gliding snow is of primary importance. For type I emissions, the event-counting method gives better discrimination between high and low emission periods. Count rates may be two orders of magnitude higher while an RMS system might produce a maximum of a factor of three differences, as discussed above.
In either case, a density-matched sensor in the snow must be used for dry slab prediction. Also, some type of sensor for monitoring environmental noise, both from the air and the ground, would Increase the reliability of the predictions.
A technique that has not yet been tried is that suggested by Reference ScholzScholz (1968). A change of slope of the log of the number of events as a function of amplitude indicates a change in the failure mechanism in rocks. If the two types of noise are from different sources and if the noises are produced from relatively discrete sources, such a technique should prove useful in increasing the reliability of predictions. Leighton (personal communication) has found that even a crude measure of event number versus amplitude is useful in decreasing the ambiguities in predictions of failure of mine walls.


