Introduction
During the past three decades, the retrieval and subsequent analysis of ice cores from the polar regions has revealed much about past climate. Core drillings in Greenland (e.g. GRIP Project Members, 1993) and in the Antarctic (e.g. Reference Ciais, Jouzel, Petit, Lipenkov and WhiteCiais and others, 1994) reached 3000 m and retrieved information on past climatic conditions during the last 100 000 years. Ice-core measurements resolving changes in physical and chemical properties at mm resolution increase the precision of dating events and allow the time-scale to be established with greater accuracy. Furthermore, advanced gas- and isotope-analysis techniques on ice-core samples reveal information on surface conditions at the time the snow precipitated (e.g. Reference Dansgaard, Oeschger, Oeschger and LangwayDansgaard and Oeschger, 1989). The density-depth function contains key information: it is used for mass-balance studies and modelling of the ice sheets and ice shelves. Knowledge of density can also help to reconstruct the accumulation history.
For regions with insignificant melting, Reference PatersonPaterson (1994) summarizes how snow turns into ice in the upper layer of ice sheets which he subdivides into four main sections. In the top layer (here called section I), settling is the dominant densification process until a density of 550 kg m−3 is reached. Below that (section II), recrystallization and deformation are the dominant processes that control the densification. At a density of 730 kg m−3, densification dominated by creep begins (section III). Then the air spaces between grains close off and form air bubbles; this defines the firn-ice transition (density 830 kg m- 3) and the beginning of section IV.
Berkner Island
An ice core, B25 (181 m long), was retrieved 5 km south of the southern summit (Thyssenhöhe, 886 m a.s.l.) of the Berkner Island, Antarctica, ice rise by a British-German expedition in the austral summer of 1994-95 (Reference Mulvaney and OerterMulvaney, 1995; Reference Oerter and OerterOerter, 1995; Reference Jokat and OerterJokat and Oerter, 1997). Berkner Island is located between the Filchner and Ronne Ice Shelves in the Atlantic sector of the Antarctic continent (Fig. 1). The island is about 300 km long and 150 km wide; it has two flat summits that rise up to 886 and 720 m a.s.l. The ice around the highest point of the island is 950-1100 m thick (Reference Hempel, Oerter and OerterHempel and Oerter, 1995). The mean annual snow accumulation at Thyssenhohe (south dome) over the last 20-30 years is 174 mmw.e. (Reference WagenbachWagenbach and others, 1994). Results from analysis of electrical-conductivity-method (ECM) data from core B25 (5 km south of Thyssenhöhe) show a lower accumulation rate of 140 mm we. (average over the last 180 years) which, assuming that this is not a local effect, indicates that the accumulation rate has increased recently (Reference Mulvaney and OerterMulvaney, 1995). The mean annual temperature evaluated from 10 m depth measurements at Thyssenhohe is about −27°C (Reference Oerter and OerterOerter, 1995). Using annual signals and historical volcanic signals, Reference Miners, Peel, Mulvaney and OerterMiners and others (1996) calculated an age for core B25 of 1182 ± 20 years at the bottom of the drillhole.
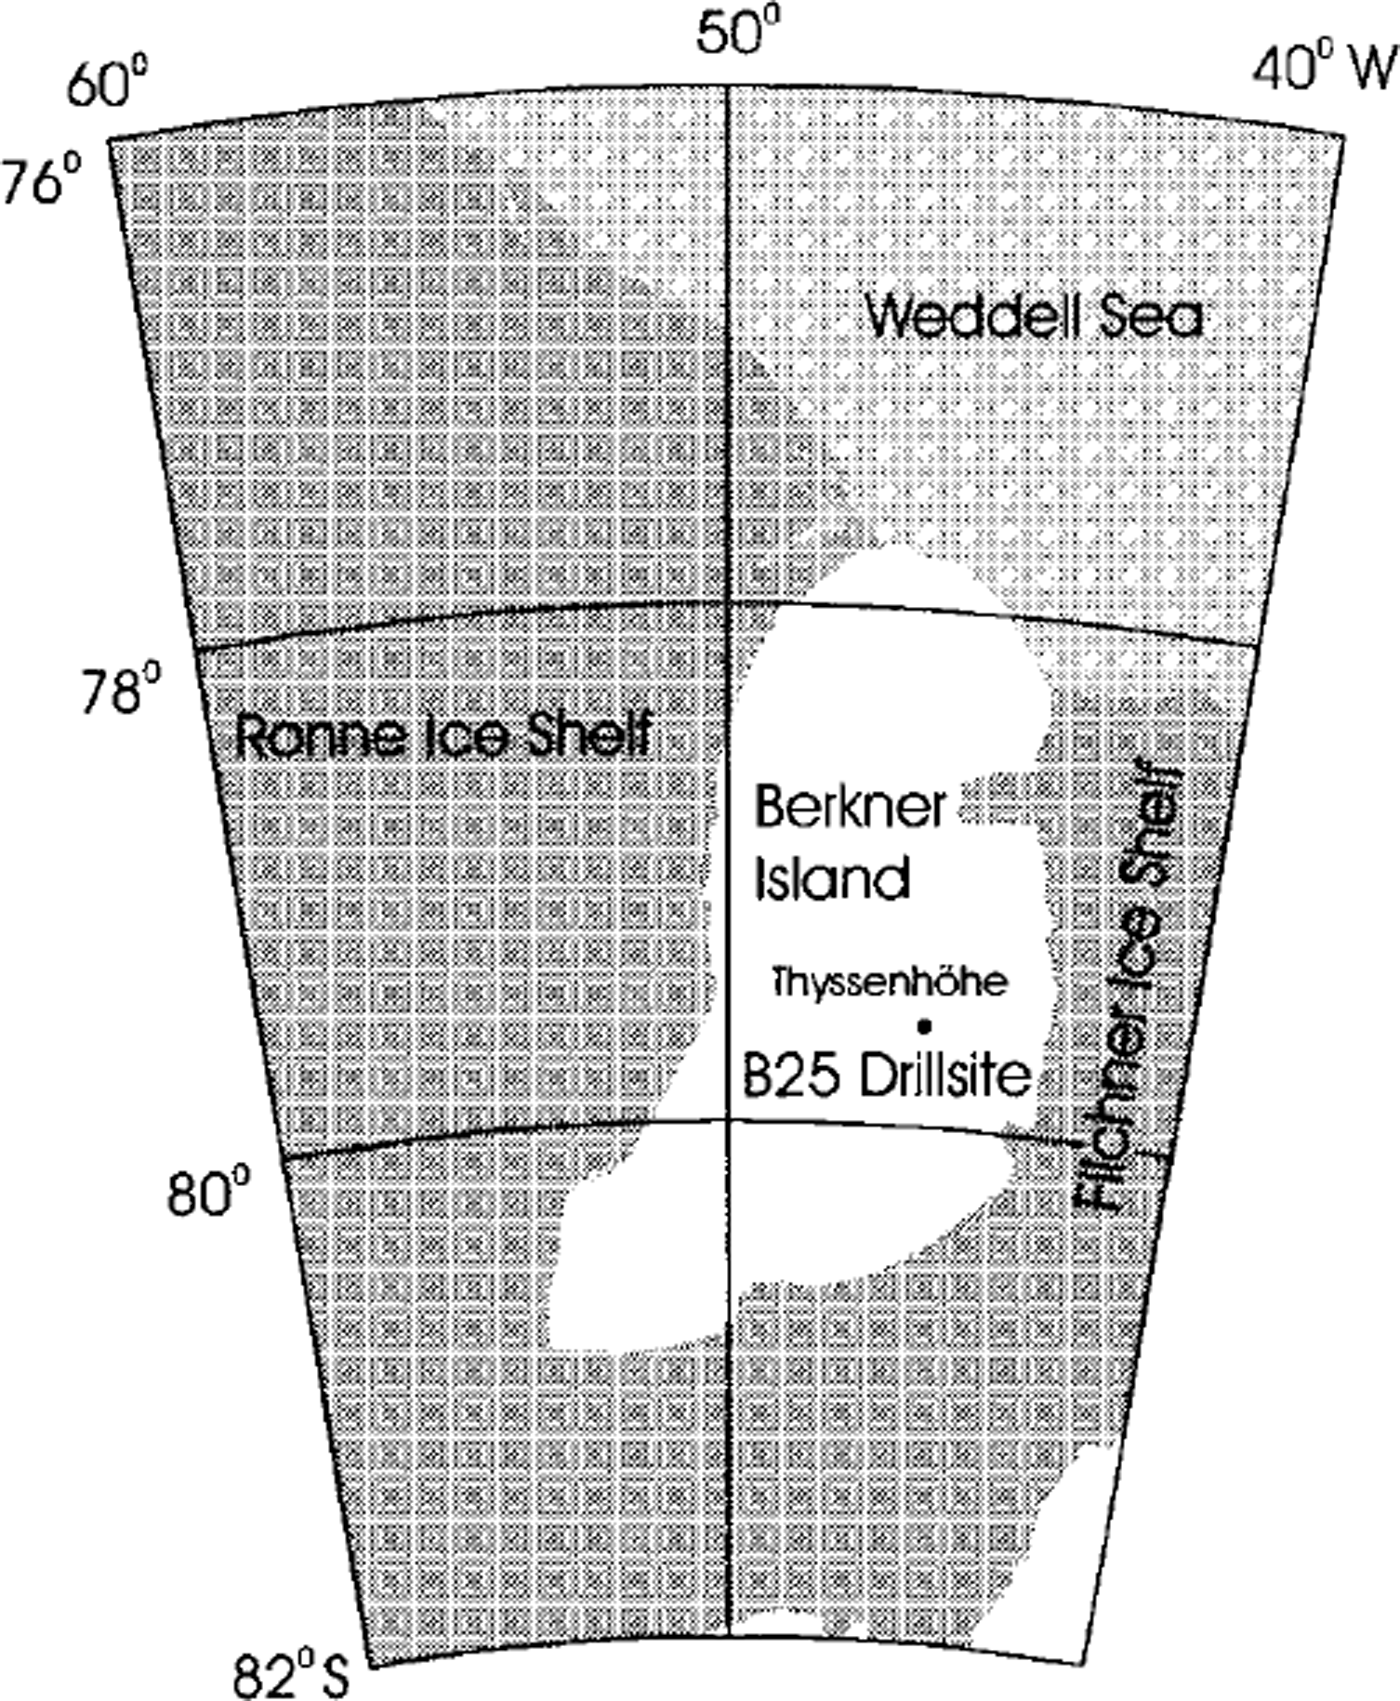
Fig. 1. Map of Berkner Island and surrounds, and drill location.
Unlike the surrounding Filchner-Ronne Ice Shelf, the ice on the summit of Berkner Island is quasi-stationary and shows little lateral movement. The deeper ice in core B25 thus results from local precipitation. Palaeochmatic interpretation of such a core is less complex than for one originating from a relatively fast-moving ice shelf.
As well as density logging, measurements on core B25 included ECM (Reference HammerHammer, 1980) and dielectrical profiling (DEP; Reference Moore and ParenMoore and Paren, 1987). The electrical measurements were performed in the field (Reference Miners, Peel, Mulvaney and OerterMiners and others, 1996). Preliminary results of chemical investigation (Reference Mulvaney and OerterMulvaney and others, 1996; Reference Graf, Minikin, Oerter, Mulvaney, Wagenbach and OerterGraf and others, 1997) indicate that the southern part of Berkner Island is influenced by different wind and weather systems than the northern part and the ice-shelf area west of Berkner Island. Investigation of the texture of a 101 m long ice core (B24), which was drilled 1 m to the side of B25, shows that average crystal size increases with depth from about 1.2 mm2 at 43 m depth to 2.5 mm2 at 88 m depth. As expected, the ,-axis distribution at these depths shows no preferred lateral direction. This supports the assumption that no lateral movement distorts the upper layers of ice near the summit of Berkner Island.
Previous high-resolution density investigations on ice cores with the same set-up as used for this study were performed on cores from Antarctica and Greenland (Reference Minikin, Kipfstuhl and OerterMinikin and Kipfstuhl, 1992; Reference Gerland, Kipfstuhl, Graf, Minikin and OerterGerland and others, 1994; Reference WilhelmsWilhelms, 1996). A similar system was used in 1997-98 during the European Project for Ice Coring in Antarctica (EPICA) pre-site survey in Dronning Maud Land. Data from non-destructive measurements of density were also utilized by radar studies including modelling (Reference Miners, Hildebrand, Gerland, Blindow, Steinhage and WolffMiners and others, 1997) and by ice-mechanical studies for fracture-toughness determination (Reference Gerland, Sammonds, Oerter and OerterGerland and others, 1997).
Method and Instrumentation
The density of the ice core p (kgm−3) at a certain depth was measured using the attenuation of a several mm wide gamma-ray beam when it passes through the ice. The gamma-ray beam interacts with the ice and is attenuated due to the Compton effect (Compton scattering). The density of the ice controls the amount of this attenuation. The process is described by the equation (Lambert-Beer law)
where I is the intensity of the attenuated beam, I0 is the intensity of the beam travelling in air in the absence of ice, d is the diameter of the ice core (here measured manually every 100 mm along the core and interpolated in between) and µ is the mass-attenuation coefficient, which for ice is µice = 0.0085645 m2 kg"1 ± 0.1%, when 137Cs is used as a radiation source (Reference WilhelmsWilhelms, 1996). The density was calculated using the gamma-ray signal in relation to the signal’s intensity in air,
Non-destructive density measurements were made using an automatic logging system (Fig. 2a), which included a Loffel densiometer (Fig. 2b). The densiometer consisted of a gamma-ray source (isotope 137Cs, energy = 661.660 keV) with an activity of 3 Ci and a photomultiplier detector unit. The voltage signal from the Löffel densiometer (proportional to I) was digitized by a multimeter before being stored and processed by a personal computer (PC). The same PC controls a stepping motor that moves a cradle, in which the ice core rests, through the system.
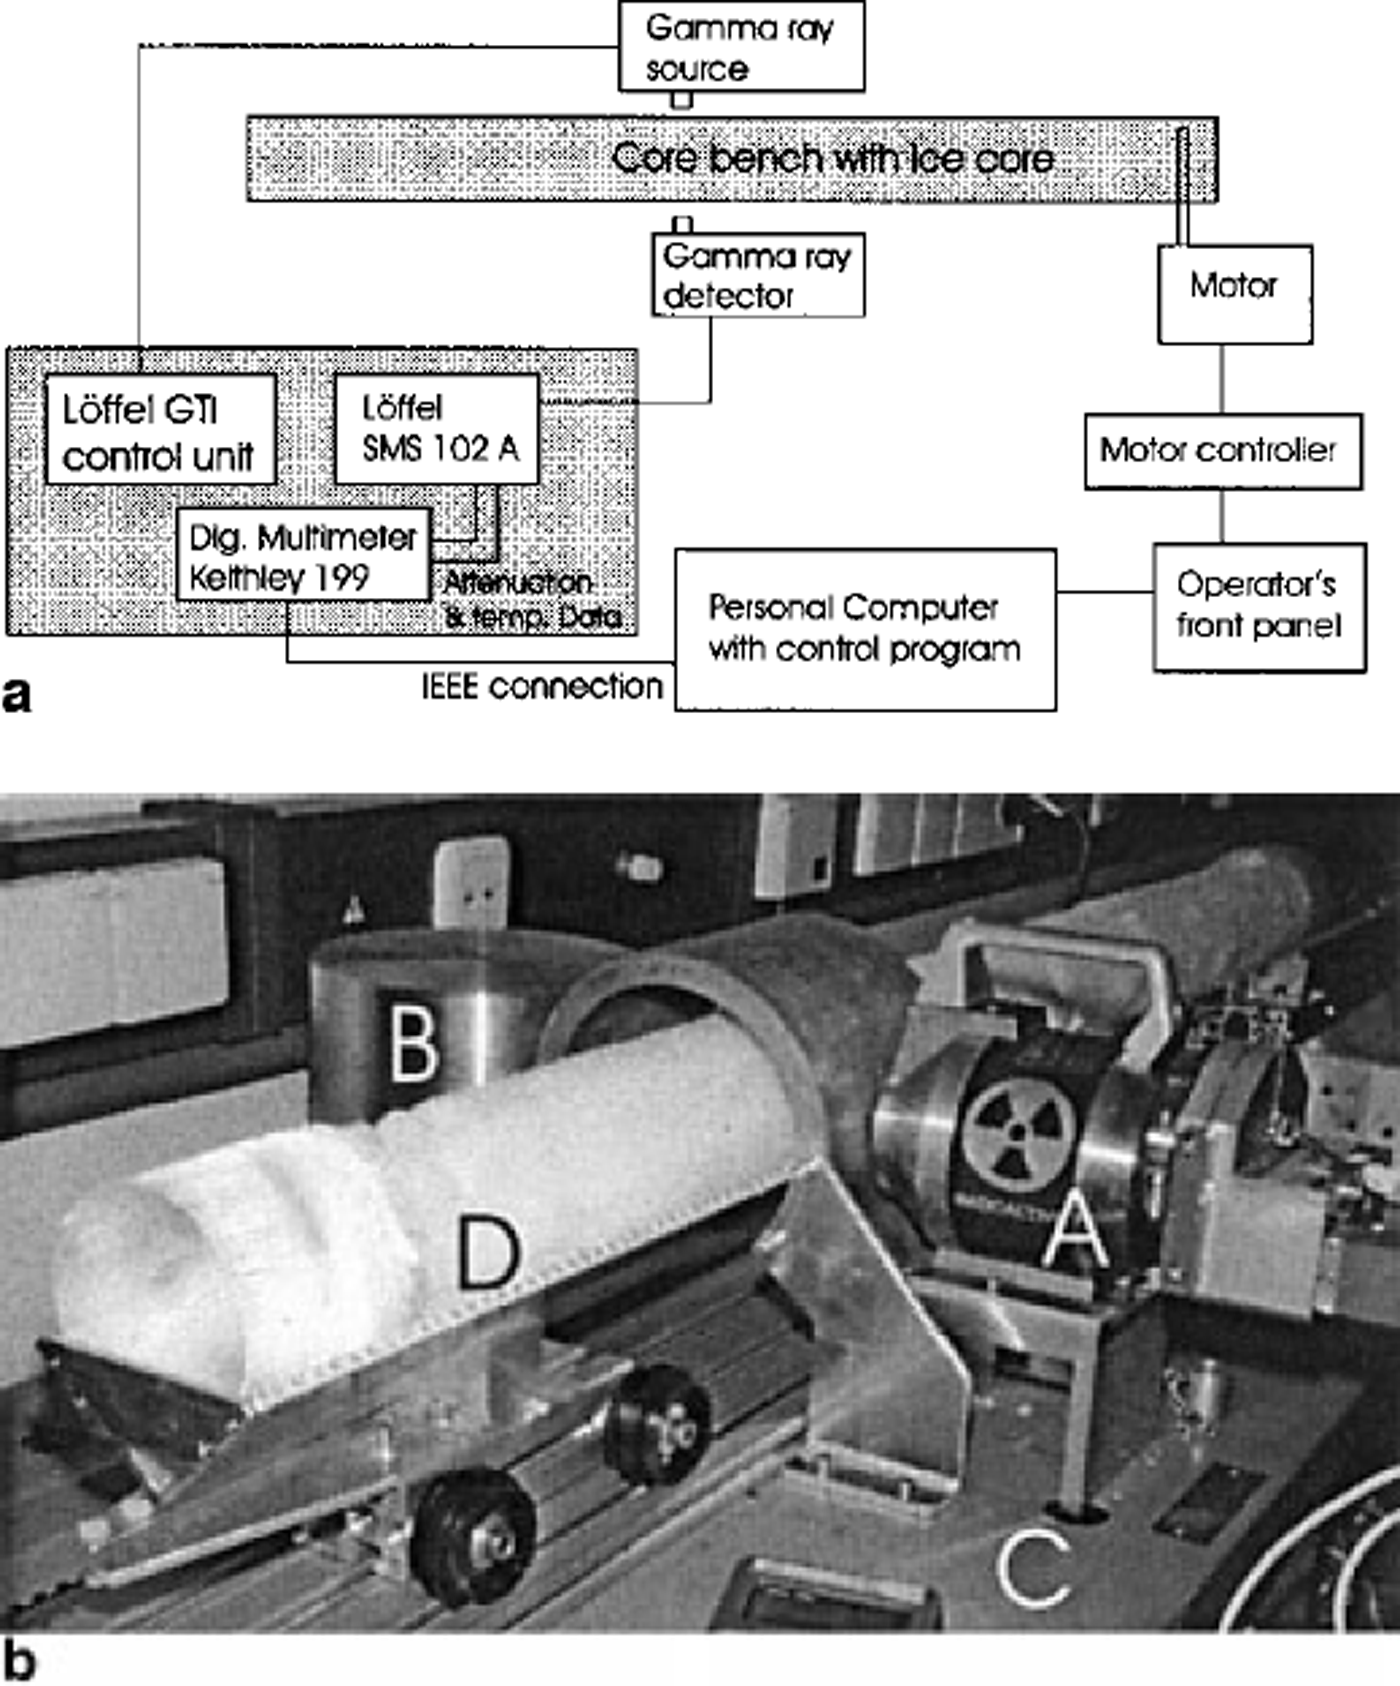
Fig. 2. (a) Sketch of core-bench instrumentation set-up. The elements controlling the gamma-ray beam attenuation measurement are located in the grey box on the left (Löffel densiometer). They are connected with the shutter of the gamma-ray source container and the photomultiplier (gamma-ray detector). The parts controlling the movement of the ice core are at the bottom (PC), on the right (stepping motor) and on the top (core bench with cradle). The data measured are stored on the PC along with the header information, (b) Photograph of core bench showing the densiometer set-up including the gamma-ray source container (A) on the right, the detector housing with photomultiplier and scintillator (B) on the left, and the bench construction (C) below, with core (D) and cradle in the centre of the picture. The cradle is mounted on rolls so that the core can be moved on a track through the set-up.
The accuracy of both the gamma-ray attenuation measurement and the core-diameter measurement influences the total absolute accuracy, which is about 2%. However, the accuracy for relative density changes is better than that. The gamma-ray beam was collimated to a width of 2 mm, using a slot collimator. The vertical spacing of measurements was 3 mm. With a sufficient averaging time, 30 minutes was required to measure a lm long core section. All density measurements on core B25 were performed at an ambient temperature of-20°C in the cold laboratory of the Alfred Wegener Institute (AWI), Bremerhaven, Germany. In addition, each core piece was previously weighed in the field and its bulk density was determined.
Results and Discussion
Due to the good core quality, it was possible to measure density quasi-continuously over almost the whole core, except for two sections at 157 and 170 m core depth. The plot of the entire density profile (Fig. 3) illustrates how density increases with depth on Berkner Island. It also shows that the small-scale density variations, which look in this scale rather like "noise", vary with depth. The different sections of densification, as introduced above, are indicated. The large-scale density changes are summarized as follows: In section I, density increases quite rapidly to an average of 550 kg m−3 at 11m core depth (rate of increase of about 17 kg m−3 m−1). In section II the densification rate decreases from 8.3 to 6.3 kg m−3 m-1, then remains at about this value in the lower part of the section. At 37 m, section III begins where the ice has a density of 730 kg m−3. The densification rate gradually decreases again until it vanishes in section IV at about 100 m depth. Section IV begins at 57 m, where the air spaces between grains close off (firn/ice transition; density = 830 kg m−3).
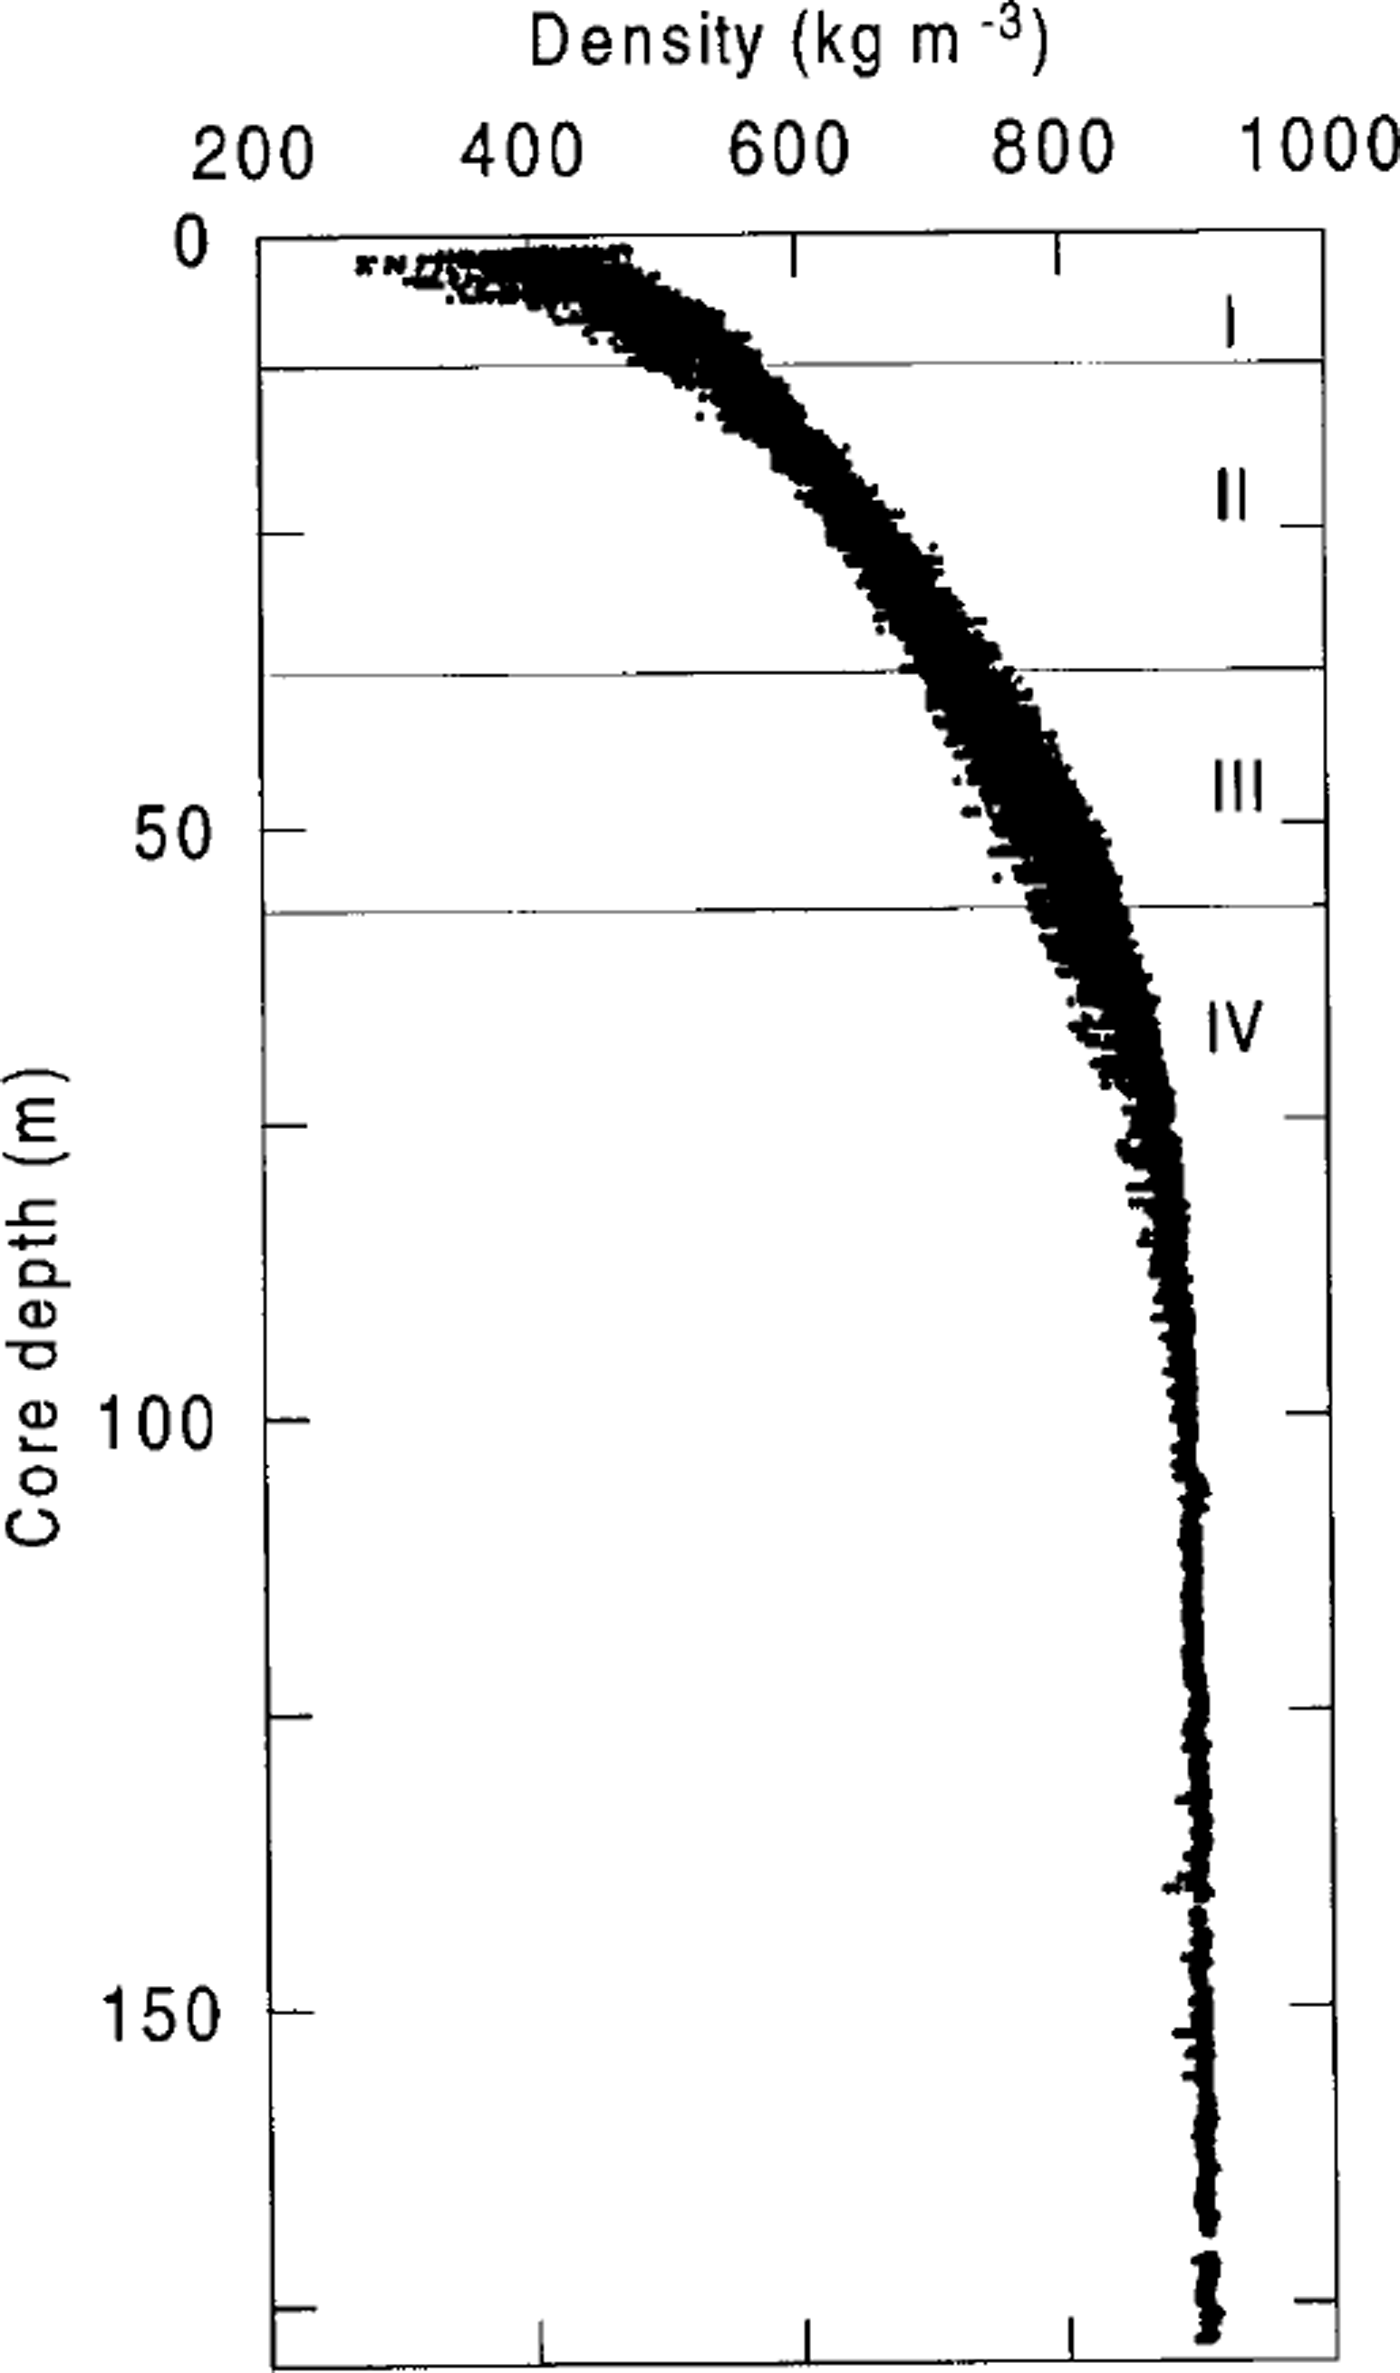
Fig. 3. Density profile of the entire core B25, drilled 5 km south of Thyssenhöhe (southern summit of Berkner Island). The different sections (I-IV) are indicated according to the description in the text.
The small-scale density changes are more variable, as can be seen by examining the width of the curve of Figure 3 over a few annual cycles with 2 m spacing (Fig. 4). A 2 m window is used to span several annual cycles. The density varies within these 2 m windows by up to ±50 kg m−3. The larger density variations near the surface may be partly affected by varying core diameters. Greatest widths of small-scale density cycles can be observed at the top of the core (near-surface section) and at about 50 m core depth (section III). This second peak just below 50 m core depth corresponds with the depth of pore close-off In between, a section of smaller-scale variations is visible at 25 m depth (in section II). From 57 m depth, where section IV begins, downwards, the width of small-scale density cycles decreases continuously with depth.
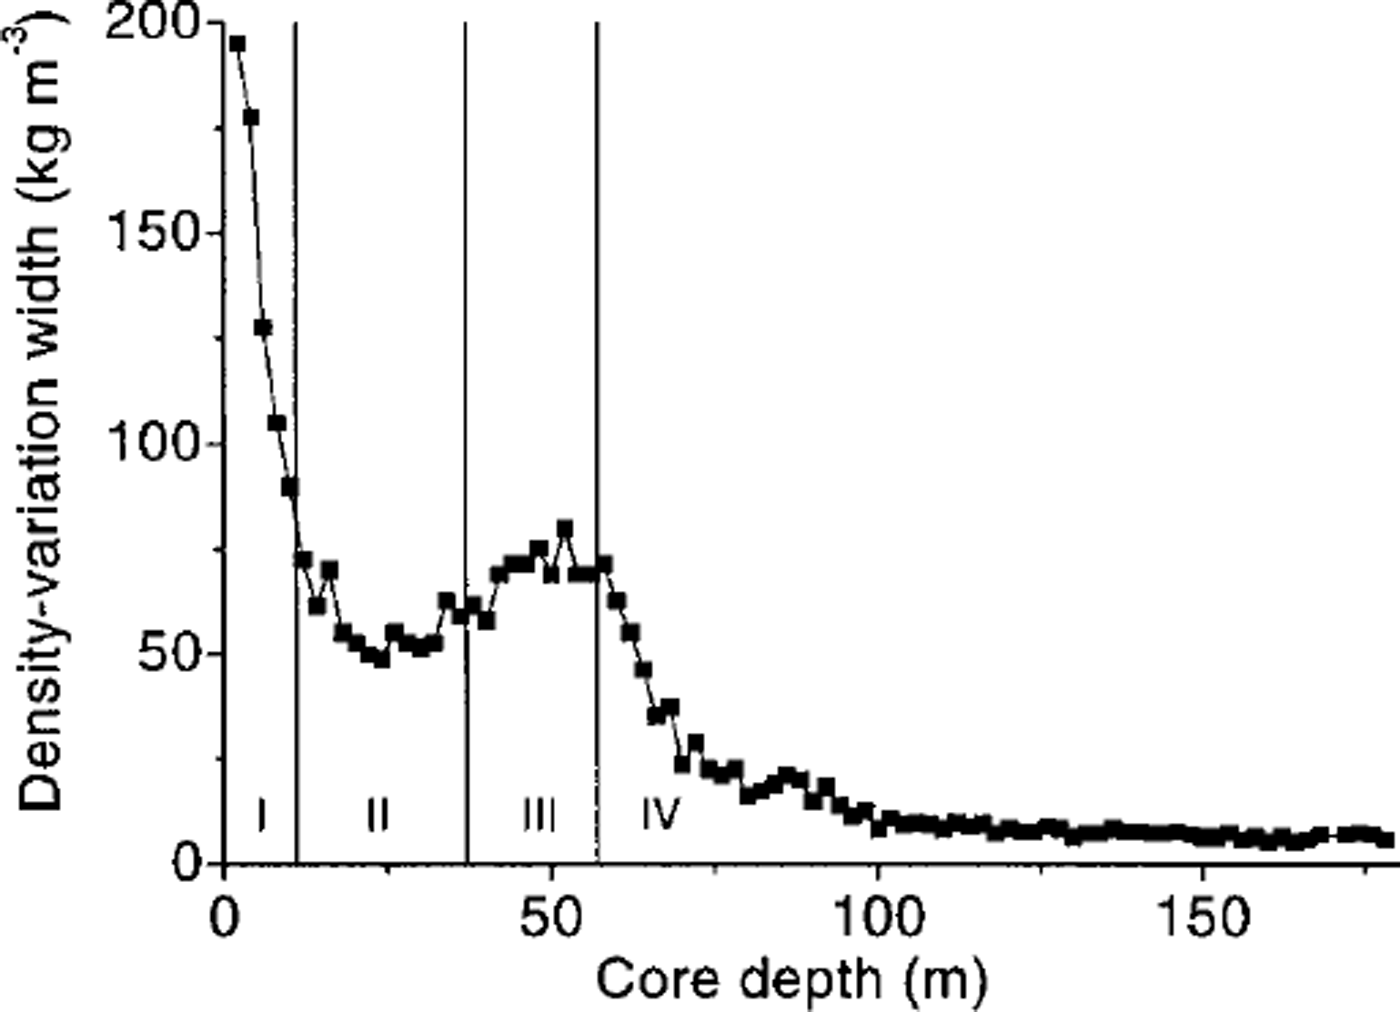
Fig. 4. Density-variation width vs core depth. The curve shows the variation with 2 m spacing. Depth section indications (I-IV) are applied according to the description in the text.
A comparison with EGM data shows that the small-scale density changes are seasonal. High EGM currents are usually associated with firn made up of snow that fell in the summer months, whereas low currents are associated with winter precipitation (e.g. Reference WagenbachWagenbach and others, 1994). In the upper part of the core we found an anticorrelation of EGM and density signals (10 m core depth; Fig. 5a). At greater depths, however, this pattern inverts to a correlation (30 m depth; Fig. 5b). Summer firn density measured in snow pits in the summit area of Berkner Island is lower than winter firn density (Reference Oerter and OerterOerter, 1995; Fig. 6). Similar results are known from surface observations in the interior of Greenland (Shoji and Langway, 1989).
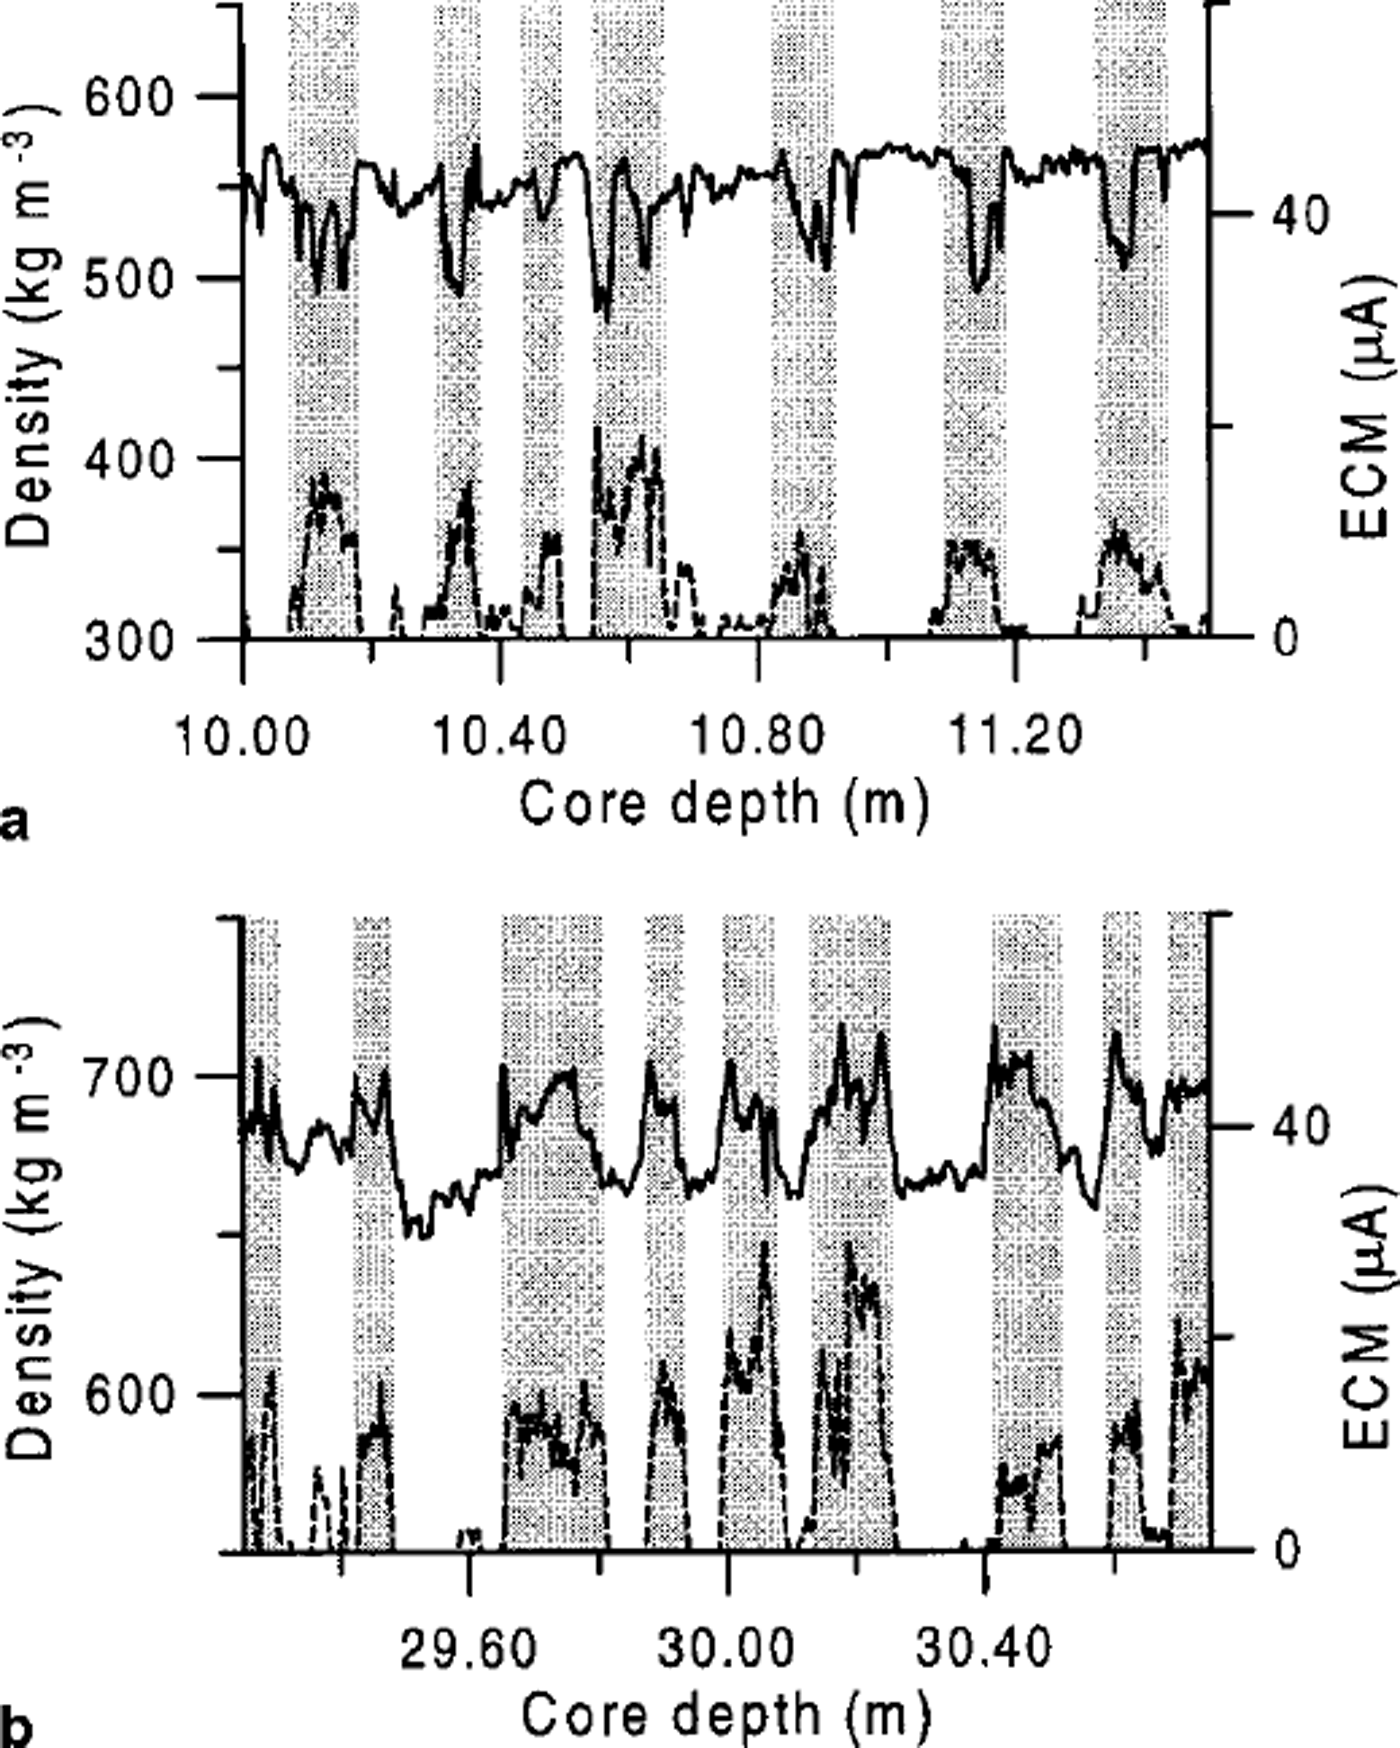
Fig. 5. Two 1.50 m long sections of density variations in high resolution and comparison with ECM data. Depth range is (a) 10-11.50 m, (b) 29.25–30.75 m. Summer layers as found from ECM data are indicated by grey shadings.
A possible explanation for the reversal of the density-variation "sense" is more efficient densification of the summer firn than of the winter firn. At about 25 m depth, where we see the lowest small-scale density variations, the density of both winter and summer firn is about the same. At greater depths, the summer firn becomes denser than the winter firn. However, this relationship cannot be seen over the whole core. Especially in the lower part of the core where the seasonal density variations are small, we found sections in the density log where it was difficult to detect seasonal signals.
A 3 m deep snow pit fromThyssenhohe showed prominent layers of summer (depth) hoar with densities of about 300 kg m−3, and more compact winter snow with densities of about 400 kg m−3 (Fig. 6; see also Reference Oerter and OerterOerter, 1995). Density in the snow pit was measured conventionally by weighing a 0.5 L density tube that was pushed into the snow. The summer/ winter density variations from the snow pit are in accordance with the low densities measured in the summer layers and high densities for winter layers in the shallower part of the B25 core (Fig. 5a). The annual variations appear also in the isotonic results (δ 18O) and for most layers in the electrolytic conductivity measurements on samples taken from the snow pit (Fig. 6).
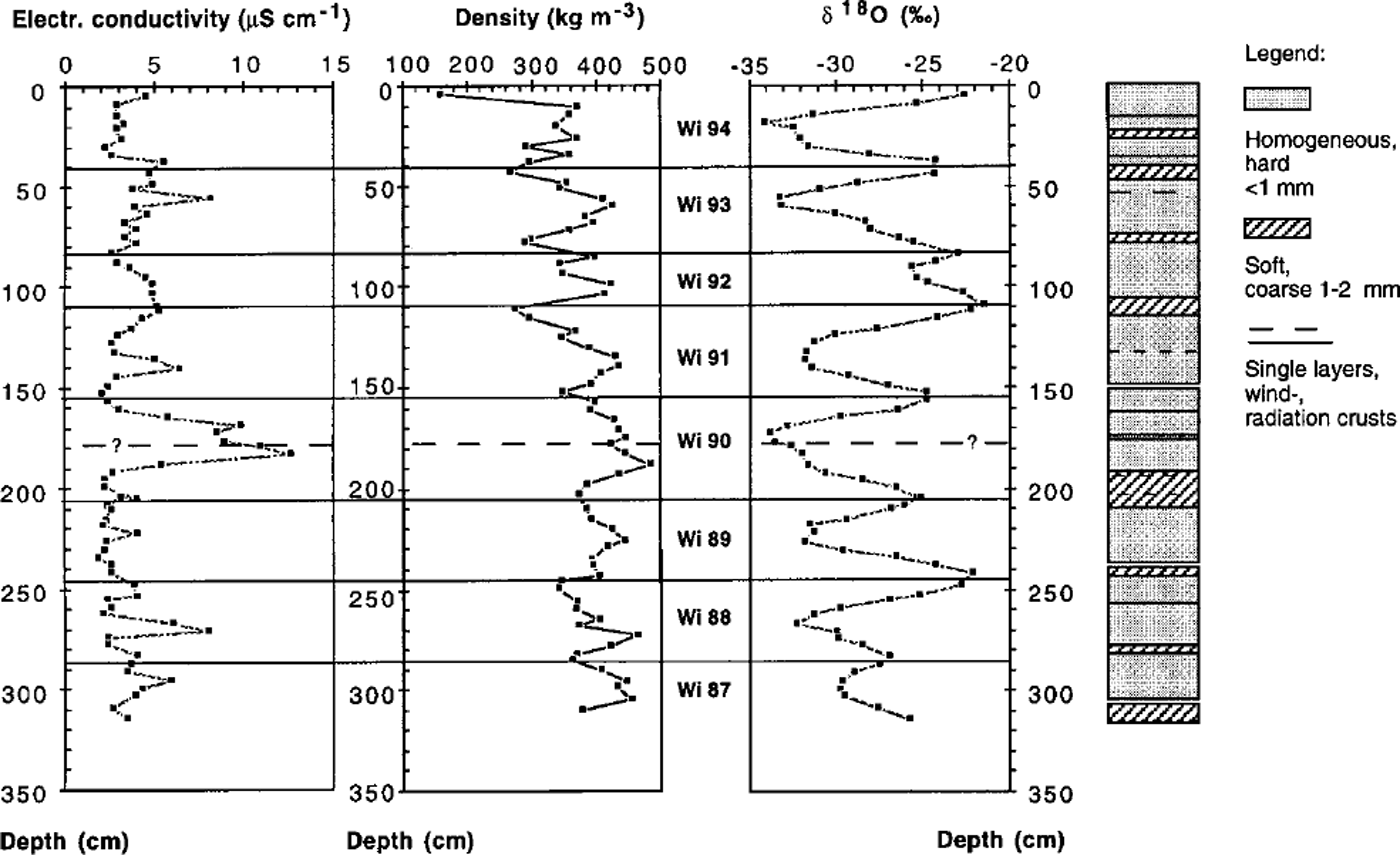
Fig. 6. Measurement results from a snow pit sampled on Thyssenhöhe, January 1995: electrolytic conductivity, density profile and δ 18O content together with the stratigraphy of the clearly recognisable firn layers. The density was determined conventionally by weighing of a defined snow volume. The annual boundaries were drawn using the summer maxima of the δ18O content. The mean snow accumulation for 1988-94 results in 410 mm firn a’1 according to an accumulation rate of 154 ± 36 kg m-2 a-1 w.e. The dashed line at about 1.80 m depth indicates another possible summer horizon, but it was not included in the dating, because the signals in the measurement results are not as prominent as for the other summer layers.
Different snow-densification rates in summer from those in winter might result from differences in texture and therefore also different (integrated) surface sizes of snow crystals. The grains that form the winter layers are composed of roughly spherical crystals (smaller surface), whereas the snow and hoar that forms during summer has a coarser-grained matrix with a platelet-like structure and therefore a larger surface. Such a formation is likely to settle and compact faster and more efficiently than a spherical geometry. Mass exchange by sublimation and diffusion supporting densification could also be more or less increased by different geometries. Exactly how summer layers undergo faster densification than the winter snow crystals needs more detailed evaluation, however.
Conclusions
As a result of high-resolution density measurements on core B25 from Berkner Island (mean annual accumulation 140 mm w.e.), it has been observed that at shallow depths firn formed from winter snow is denser than that formed from summer snow, but that below 25 m depth the summer firn becomes denser than the winter firn. A similar pattern of density variation has been observed in core B15 from the Ronne Ice Shelf (Reference Gerland, Kipfstuhl, Graf, Minikin and OerterGerland and others, 1994), showing 100-250 mm w.e. annual accumulation, and on ice cores taken in northern Greenland, where the mean annual accumulation was 106-152 mm w.e. (Reference FischerFischer and others, 1998). This indicates that density variations are physical in origin (densification process in different types of firn) rather than due to local conditions. It is hypothesized that the inversion of the season-to-density relation is due to the increased densification of the originally lower-density summer snow and hoar.
Acknowledgements
We are grateful to all field participants in the Berkner field Campaign 1994-95, and to the flight and base personnel in Antarctica. We would also like to thank A. Frenzel, F. Valero-Delgado and the late U. Weigel (AWI) for their work in the cold laboratory. The coordinates and elevation data were provided by B. Riedel (TU Braunschweig, Germany). M. Schwager (AWI) and reviewers M. Curran and R. Souchez provided constructive criticism of the manuscript.
This is publication No. 1498 of the Alfred Wegener Institute for Polar and Marine Research.


