

Last year saw global economic growth of 3.8 per cent, the strongest since 2011. In addition, our analysis in the last issue (see Lennard, 2018) showed that this growth had been broad-based, with a very high degree of synchronisation across countries. While it is plausible to expect these two features of the global economy – relatively robust growth and synchronisation – to continue in the short term, there are a number of uncertainties about the outlook, reflected in the fan chart for global GDP growth shown in figure 1, which is drawn to reflect normal business cycle risks and does not include the downside risks associated with any possible escalation of protectionist trade policies.
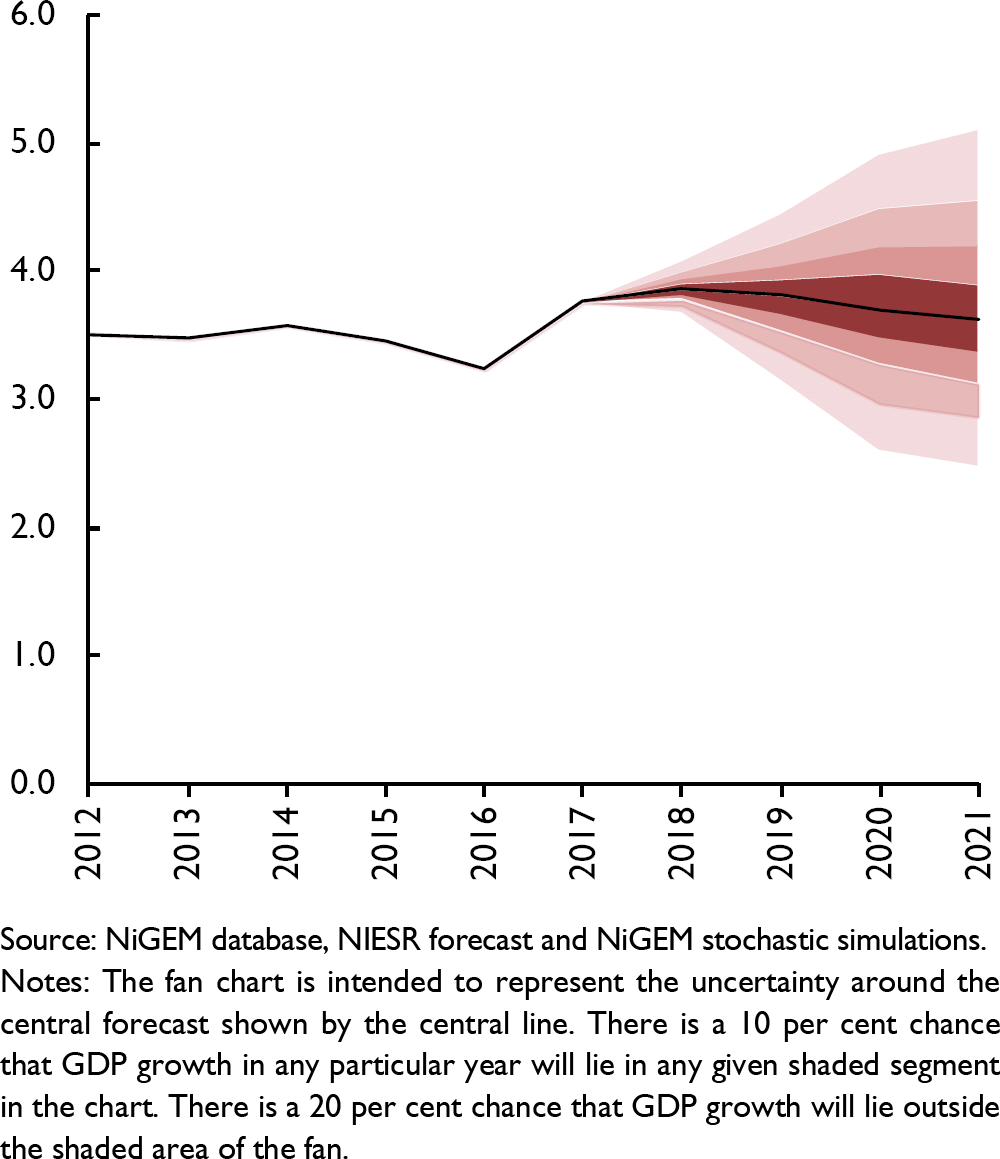
Figure 1. World annual GDP growth fan chart (per cent per annum)
For some advanced economies, GDP growth in the first quarter of the year was weaker than expected, partly related to the adverse weather in the quarter. In addition, the data so far indicate slow export growth as a factor. An immediate issue is whether the first quarter was a ‘soft patch’ or whether it marked something deeper. Initial readings from the second quarter, including PMI surveys which have shown some strengthening in the Euro Area, UK and US and continuing labour market trends that have indicated a tightening rather than a weakening market, suggest the temporary ‘soft patch’ narrative is plausible. The indicators suggest that growth in the second quarter will be stronger than in the first, especially in the US supported by the pro-cyclical fiscal boost.
As a consequence, our overall forecast judgement is little changed from May. The global economy looks set to continue growing this year at a pace slightly below 4 per cent, with a broadly synchronised pattern of growth. We continue to expect that further growth in the advanced economies will lead to more evident pressures on capacity and skills and that these will be reflected in (probably limited) upward pressure on inflation and policy moves towards less accommodative monetary policy. Robust growth in the advanced economies is helping the emerging market economies, especially the commodity producers, and emerging economies as a whole are continuing to expand more rapidly than the advanced economies. But as the forecast horizon extends, a combination of slowing domestic demand growth (partly from demographics: see Aksoy et al., 2017) and slightly higher interest rates in the advanced economies are expected to feed into slower growth in some emerging market economies. In turn, this will contribute to slower overall global growth.
An important factor in the global forecast is the expectation that the pace of growth in China will gradually slow, as the economy makes its transition and investment spending growth plays a less prominent part in determining overall annual growth. The scale of China's contribution to global growth is such that a slowing is also reflected in slightly slower global growth. Reflecting anticipated trends in demographics, productivity and structural factors, our medium-term forecast continues to expect global growth to run at around 3.5 per cent a year.
Two features of the outlook are particularly noteworthy. First, the possible escalation of protectionist trade policies are providing an increased downside risk to the outlook. The announcements by President Trump on 1 March of tariff increases, initially on steel and aluminium imports from a range of countries and effective from 1 June on products from a small number of focused sectors, are unlikely to have a significant negative effect on the global outlook. On 22 March further tariffs on a wider range of Chinese goods prompted retaliation. To date, the scale of the trade under consideration has been limited, with affected total Chinese trade of $50 billion, of which $34 billion was effective from 6 July. The initial actions are included in the baseline forecast. However, the President announced on 11 July a possible wider extension on Chinese trade of up to $200 billion and $500 billion has also been mentioned, which would mark a major change in both the size and breadth of tariff action. Box A provides a simulation of our NiGEM model that considers the effects of various tariff changes (see also Reference Hantzsche and LiadzeHantzsche and Liadze, 2018; Reference Liadze and HaccheLiadze and Hacche, 2017). The possibility of further impositions and retaliations is a risk for the prospects for both world trade and global economic growth. The change in direction of US trade policy is a significant one and has added uncertainty to the trading environment.
Secondly, stronger growth and falling unemployment rates have led to increasing concerns about reduced spare capacity, signs of skills shortages in recruiting and some anticipation of pressure building on wage and price inflation. So far, generally inflation figures have failed to register this build-up in capacity utilisation but there are some signs of rising annual inflation in Germany, France and the US. As we raised in the February Review,Footnote 1 oil prices are now about 60 per cent higher than their low in June 2017. The issue of whether continued growth and tighter labour markets will lead to faster wage growth and eventually higher inflationary pressure and further monetary policy tightening remains a key risk to the profile of growth and inflation in the forecast. The US has led the way in terms of reducing the extent of monetary accommodation, and our expectation remains that this process will spread. Our forecasts include gradual increases in policy rates in the UK and Euro Area over the medium term which are broadly in line with recent market expectations. The forecast does not assume dramatic changes in policy interest rates – rather a general gradual upward path of interest rates.
Recent developments and the baseline forecast
Recent economic developments
The developing data for the first quarter of 2018 have been dominated by indications of slower growth in the advanced economies, particularly in Japan, the Euro Area and the UK (figure 2). While part of this can be explained by one-off factors such as the adverse weather, a potential concern is that it could possibly be an early sign of a broader picture of slower growth. After world trade growth outpaced GDP growth in 2017, export growth surveys have generally pointed to slower growth in early 2018, possibly related to uncertainty following the protectionist rhetoric and tariff actions from the US. These possibly temporary factors in the first quarter have to be balanced against more positive survey readings for growth in the second quarter, especially in the US, and the apparent absence of ‘one-off’ negative factors in the quarter.
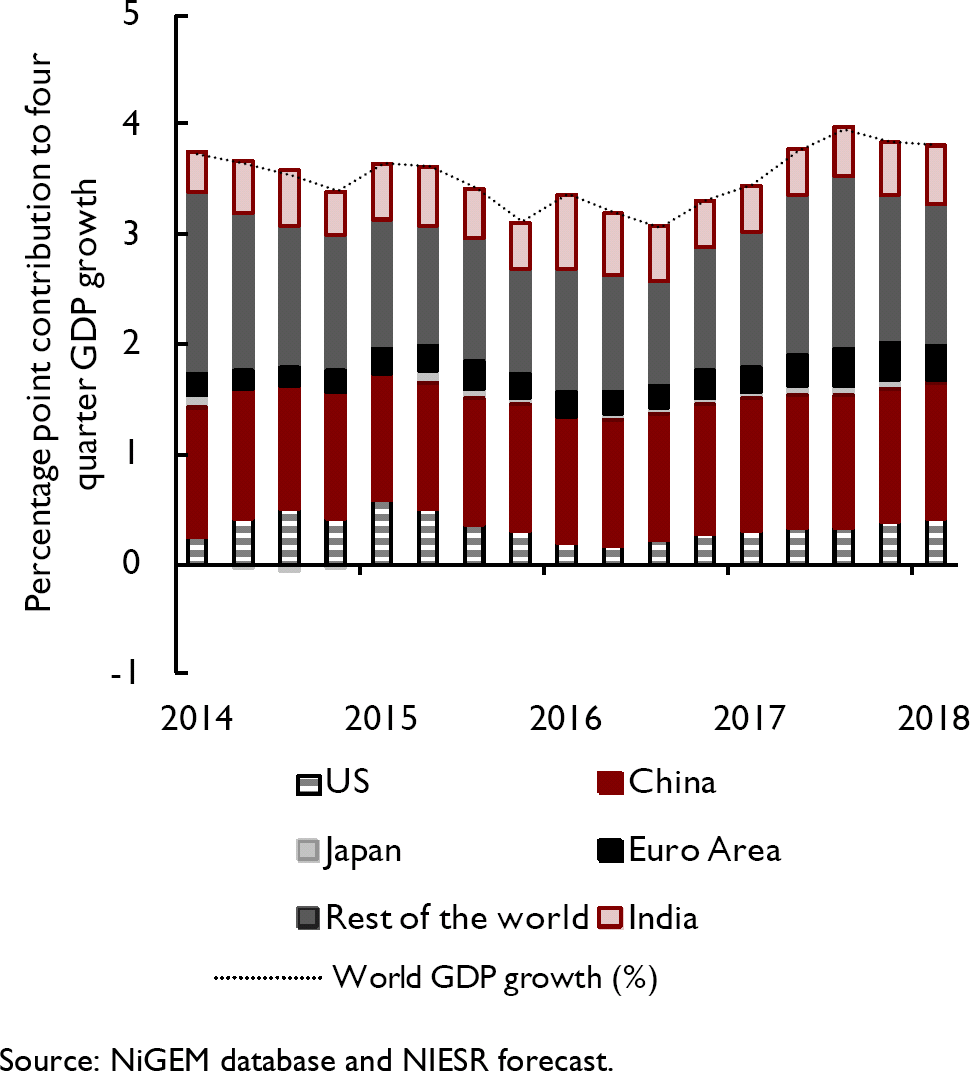
Figure 2. World GDP growth and its components
With the US expansion now the second longest on record, one feature of commentaries has been some understandable interest in whether a recession might be in prospect. The term spread (see Lenoel, 2018) has moved little over the past three months and the expansion phase looks set to continue. But, although the expansion has been long, it has not been strong (figure 3). US GDP is only 21 per cent above the trough in mid-2009. By contrast, the slightly shorter expansion after 1982 saw a 38 per cent rise in GDP, suggesting that the longevity of the expansion should not be taken as an indicator of its likely duration.
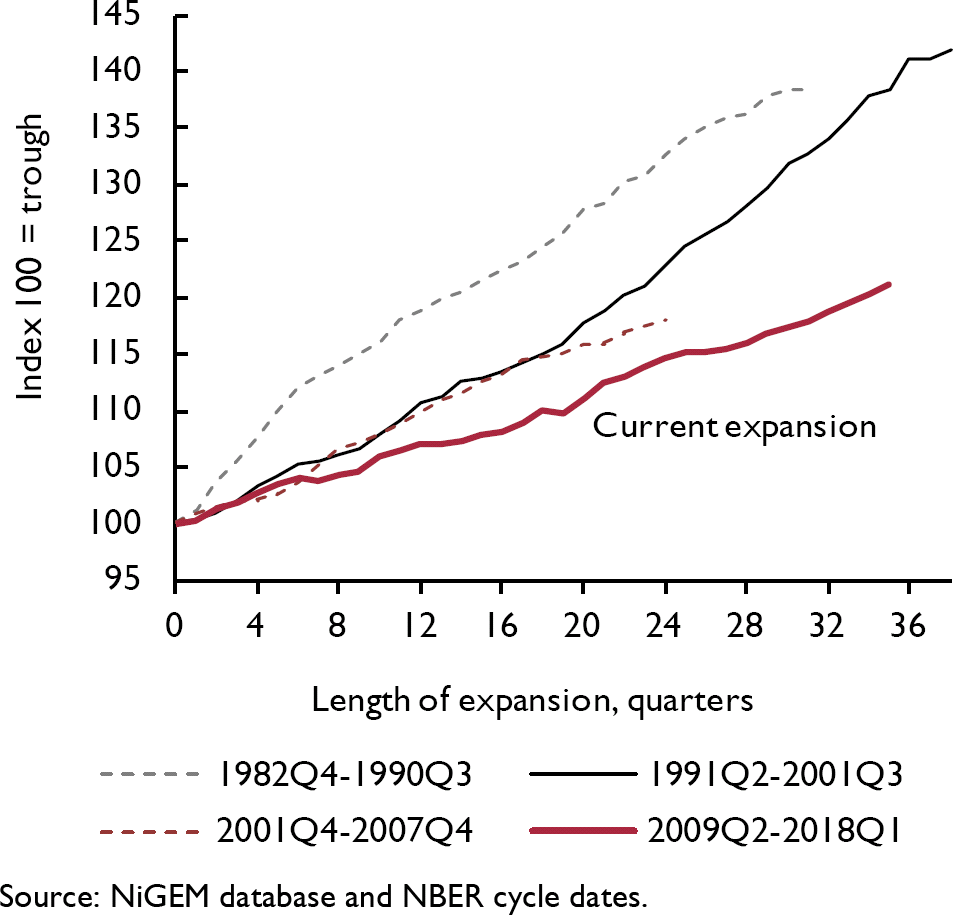
Figure 3. US GDP in expansions
While growth in the Euro Area generally surprised on the upside in 2017, with growth of 2.6 per cent in 2017 showing a rebound from 2016's dip in growth (1.8 per cent), the overall pace of growth (at 0.7 per cent quarter-on-quarter in each quarter in 2017) masked a divergence between countries within the Euro Area.
Spain grew strongly (by 3.1 per cent) and continued that strong performance in the first quarter of 2018, while several other countries saw weaker growth in the first quarter, particularly in exports. As a result of stronger growth, unemployment has fallen but still remains high by pre-recession standards. Inflation within the Euro Area has so far remained subdued, enabling the ECB to continue its accommodative monetary policy. However, the ECB announced at its June meeting that continued quantitative easing would end in December 2018 and that policy interest rates were expected to remain at present levels at least through the summer of 2019.
Japan saw an unexpected fall in GDP in the first quarter, largely due to a reversal of the building of inventories, and growth is expected to resume. Among emerging economies, India and China continue to show growth well ahead of the global average and Turkey and Vietnam performed strongly in 2017 with output expanding by 7.4 and 6.7 per cent respectively, although in Turkey it was accompanied by rapid inflation. Argentina and Venezuela have continued to deal with economic problems and both have seen very rapid inflation. While continued low inflation elsewhere is notable (figure 4), the general pick-up in demand has benefitted commodity producers and oil prices, in particular, having risen strongly over the past two years.
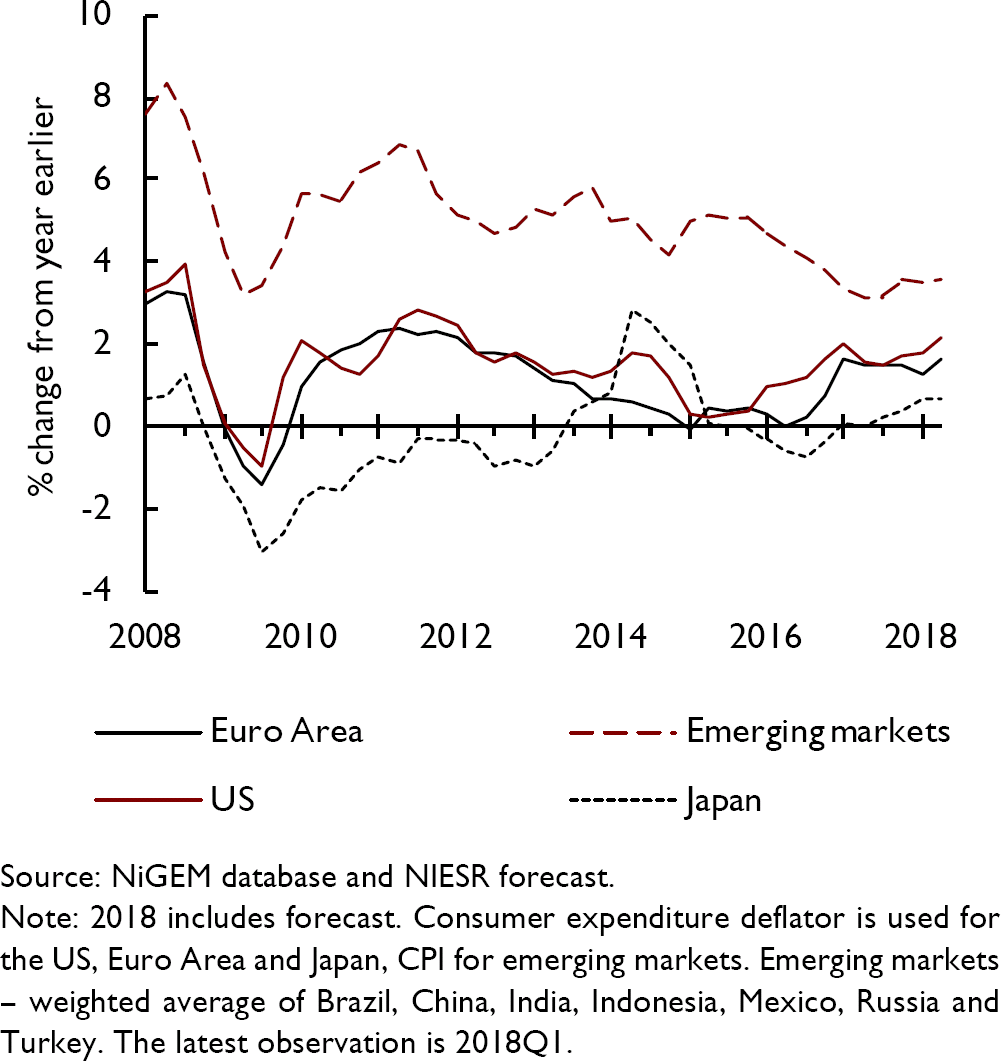
Figure 4. Consumer price inflation
Our revised baseline forecast
Taking the recent news as a whole, forward-looking developments have not been sufficient to lead us to make any major changes to our view for the global outlook. Global growth is expected to run at 3.9 per cent this year and 3.8 per cent in 2019, after 3.8 per cent last year. Into the medium term, the pace of growth is forecast to settle at about 3½ per cent, reflecting a continued narrowing of output gaps in the recovery from the Great Recession, demographic effects (especially in the major industrial economies) and a gradual deceleration in growth in China. There are clearly risks around the forecast and these are illustrated by the fan chart for global economic growth (figure 1).
Our expectation remains for inflation to continue to be higher than in 2014–16 but to be broadly in line with policy targets. The reductions in unemployment rates and some reports of skilled labour shortages, together with the slow pace of investment since the crisis, could mean that capacity pressures are building and these would likely lead to higher inflation. Our policy rate expectations are for a gradual tightening internationally, reflecting a response to potential pressures from a narrowing of output gaps.
Monetary policy
Within the advanced economies, the US Federal Reserve raised policy rates three times in 2017 and has already acted twice so far this year (in March and June). At least one further increase this year is implied in the Federal Reserve's latest ‘dot plot’ chart and further increases are anticipated in 2019 as policy rates continue to be ‘normalised’. However, the profile of policy rates remains dependent on the economic outlook and is not pre-set. The fiscal boost this year will feed through and one policy concern will be whether this contributes to capacity problems and creates pressures for inflation to rise above its target, something that it has failed to do consistently so far.
In contrast, the ECB is still continuing its policy of quantitative easing, with policy rates held at the lower bound, although the monthly scale of purchases has been scaled back and is due to end in December 2018. Given currency linkages, the pressure from US policy rate rises is likely to be transmitted to some emerging market economies, perhaps with some concerns about non-financial companies' debt intensifying (Naisbitt, 2018). With economies at different phases of the cycle, the pattern of potential policy and market rate movements is diverse.
Financial and foreign exchange markets
Bond yields in the US rose in May, with 10-year yields up to over 3 per cent, touching their highest level since mid-2011, and 5-year rates at 2.90 per cent, regaining their high of June 2009. Since mid-May both yields have eased back, with 5-year at around 2.75 per cent and 10-year at around 2.85 per cent, at mid-July. In terms of longer-term ‘guidance’, the Federal Reserve's implied expectation for longer-term rates from the ‘Dot Plot’ chart stood at 2.75 per cent in December 2017. This has now risen to 3 per cent and market implied rates are at similar levels.
Movements in 10-year government bond yields in the Euro Area have shown a more steady path so far this year, with rates holding below 1.50 per cent since July 2015. This reflects the policy actions of the ECB, which has held the rate on the deposit facility at −0.4 per cent and continued with its quantitative easing policy. The latter is set to reduce further after September, but guidance has been that policy rates are expected to be held at least through much of 2019, providing continued support for low longer-term rates.
Although US short-term interest rates have risen as the US economy has performed relatively strongly, the US dollar depreciated against the euro through 2017 by almost 20 per cent, with a low point reached in early February 2018. After holding at around €1.23, from late April the US dollar has appreciated by around 6 per cent against the euro. This pattern also broadly holds in trade-weighted exchange-rate terms. This marks a contrast with the euro, which has depreciated since late April by around 2 per cent. For the Japanese Yen effective exchange rate, after appreciating by around 3 per cent during January and February, the second quarter was a period of stability.
With equity markets continuing their multi-year rise in 2017 (the S&P index rose by 19 per cent through the year, the Nikkei by 19 per cent and the FTSE 100 by 7 per cent), equity prices rose to record levels. This resulted in some warnings in press and market commentaries about the possible over-valuation of stocks. It appeared that some of the market risks had started to materialise in February when strong US labour market news prompted worries of sharper interest rate rises. The S&P index fell by 8.5 per cent in just over a week and this fall reverberated in other markets. However, markets calmed and the S&P rose by 6 per cent over the following month. Announcements of US tariffs on steel and automobiles and then on trade with China on 22 March led to further market jitters late in the first quarter. In the second quarter markets saw more of a consolidation, with the S&P 500 up 3 per cent, the Nikkei up 4 per cent and the FTSE 100 up 8 per cent.
The Vix index,Footnote 2 an indicator of financial market volatility or uncertainty (sometimes referred to as the ‘fear index’ for equity markets), traded at a lower level (by about 3 points) in the second half of 2017 than a year earlier. But the first quarter of this year saw much more volatility, including a spike on 5 February following strong data. After falling back (to 14) in early March, it peaked again (at 25) on 23 March. Since then volatility has gradually reduced, reaching a low of 12 in early June and it has remained close to that level to mid-July despite the escalating trade and tariff rhetoric.
Commodity markets
So far in 2018 oil prices have continued their sustained increase since early 2016. The Brent oil price has increased to around $75 per barrel and gives an upward revision to our assumptions. The sustained rise is being reflected in higher consumer prices for petrol and energy.
For other commodities, The Economist all-items commodity price index (in dollar terms) fell by about 5 per cent in the second quarter after a 1 per cent rise in the first quarter, with food prices falling by about 7 per cent after an earlier 6 per cent rise. Metals were up in the second quarter by just under 1 per cent after a fall of 6 per cent in the preceding quarter.
Risks to the global forecast
Our near-term global growth projections are for continued relatively robust growth but, with the focus on tariffs and speculation about a ‘trade war’, the downside risks have increased over the past three months and upside risks have receded. Our view is that the near-term risks around the central forecast are broadly balanced. However, the uncertainties around the possibility of a worse outcome into the medium term have increased with the more strident protectionist talk on tariffs and trade. Whether the recent strident talk will be matched by further actions is yet to be seen.
On the positive side, the synchronised nature of relatively strong activity could well have further to run, with domestic demand growth in economies being boosted by investment spending growth which is responding to stronger global demand. If inflation remains subdued, this transmission mechanism could provide a boost to global growth. Monetary policy has remained accommodative across most economies since the Great Recession and, if low inflation continues, this could continue and support a faster pace of growth.
While the output of economies has expanded, the pace of that expansion has been relatively slow. From a longer-term viewpoint, a key feature of the expansion has been the disappointing rate of productivity growth. This, as discussed in the February Review (Kazalova and Naisbitt, 2018), has been a generalised feature in the advanced economies, with productivity growth disappointing relative to previous experience. The exact causes of this shortfall are not agreed (Riley et al., 2018) but it is possible that a strong and synchronised expansion could lead to a stronger path for productivity growth. Stronger investment spending, in particular, could add to future capacity and result in stronger productivity growth, so supporting higher future real earnings growth. If productivity growth does strengthen, the upswing could continue more strongly than anticipated.
In addition, the fiscal measures in the US could add more momentum than expected, both in the US economy and through import demand channels, leading to a stronger outlook in the near term. There may also be scope for other economies to increase fiscal support, as discussed in Box B.
Downside risks to the global outlook come from several possible sources. The gradual tightening of US monetary policy since 2015 has been accompanied by the unemployment rate falling to an 18-year low of 3.8 per cent in May. Despite some worries about increased capacity usage leading to inflationary pressures, to date US inflation has been persistently below its target. But low inflation might not persist and the Federal Reserve could face tough decisions to raise interest rates more rapidly and substantially. At a time when equity markets appear to be richly valued relative to what might be regarded as fundamentals (see figure 5 for one such possible indicator), such a change in policy stance could lead to a fall in equity prices and so in household wealth, which would have direct and indirect (via reduced consumer confidence) negative effects on consumer spending, in turn reducing import demand.
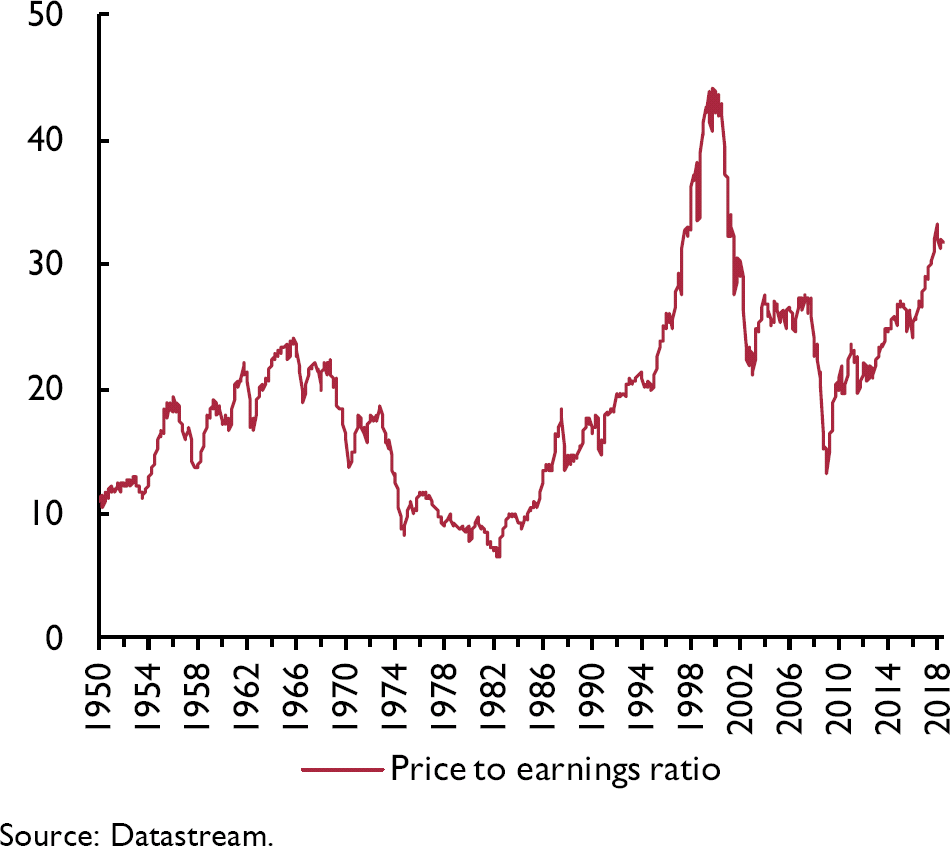
Figure 5. Shiller cyclically adjusted price–earnings ratio for the S&P 500
The synchronised nature of the recent global expansion may, of itself, present a risk to sustained growth. Greater synchronisation may reflect greater connectivity of economies and so imply that a shock that is unique to one economy may be more readily transmitted to other economies. The imposition of tariffs and the direct effects of higher import costs could be supplemented by lower export growth due to retaliation and, so, reduced risk sharing across economies. In addition, uncertainty over future trade policy has increased this year with President Trump's pronouncements on tariffs. It is difficult to know how far the most recent announcements with regard to trade with China will become reality or what other possible trade actions President Trump may initiate, but heightened protectionist rhetoric turning into action and retaliation adds a substantial downside risk to the outlook for global trade growth (see Reference Hantzsche and LiadzeHantzsche and Liadze, 2018). With continued robust growth in China remaining a key contributing factor to global economic growth, any internal economic downside risks in China (perhaps due to the rapid credit growth that has already led to concerns being expressed) could be added to by downside external trade shocks.
Finally, the potential downside risk to global economic prospects from the build-up of debt – in both public and private sectors – is the subject of the Commentary in this issue (see also Naisbitt, 2018). As in the 2000s, higher debt can create a potential vulnerability even if the precise trigger that could realise that risk is not evident. After a long period of ultra-low interest rates perhaps the key risk is that borrowers may have grown too accustomed to low debt service costs and that even gradual and limited increases in interest rates may lead to a need for larger than anticipated changes in spending and saving patterns with adverse consequences for continued economic growth.
Box A. Trade wars – any winners?
On 6 July President Trump's administration imposed new tariffs on goods worth $34bn of annual imports from China. China retaliated with a package matching the magnitude of that of the US. At the time of writing, further tariffs covering $16bn worth of imports are expected to follow by both countries in the coming weeks. As the tit-for-tat trade battle escalates, both the US and China have threatened to levy tariffs up to the full range of imports (worth about $500 billion per year in the case of US imports from China).
We use NIESR's Global Econometric Model (NiGEM) to run stylised scenarios to investigate the impact of these increases in tariffs on US and Chinese imports, continuing earlier work (Reference Liadze and HaccheLiadze and Hacche, 2017; Reference Hantzsche and LiadzeHantzsche and Liadze, 2018), which shows that tariff imposition not only harms the economies that the tariffs are aimed at, but also the country that imposes them, as well as spilling over to other economies who might be innocent bystanders in the trade dispute. Footnote 1 We consider only the direct effects of tariffs and do not take account here of the negative impact that uncertainly is expected to have on business investment, which may exacerbate the fall in output. The Bank of England governor's analysis of tariffs, also using NiGEM, does take account of this effect.Footnote 2
In the simulations initially 25 per cent duties are assumed to be applied to $50bn worth of imports from both the US and China. This is followed by the introduction of a 10 per cent levy first on $200bn worth of US imports from China, then expanded further to cover the remaining $250bn worth of imports. Within NiGEM higher tariffs work by raising import prices in the tariff imposing country which leads ultimately to lower demand and output through a number of channels including lower consumption, lower investment and lower exports to countries that are disadvantaged by higher tariffs. Shocks are applied exogenously for 3 years after which they are allowed to return back to their initial levels.
The simulation results (see figure A1) suggest that the loss of output from the first round of tariffs by both the US and China would be modest, reducing GDP by less than 0.2 per cent relative to what it would otherwise have been. However, the adverse impact on GDP in both countries is significantly higher if duties are imposed on a larger range of imports from China into the US. Even though the shocks are of a bilateral nature, given the share of the US and China in global output and trade (about 32 and 40 per cent respectively), there is a material negative spillover effect on other economies.
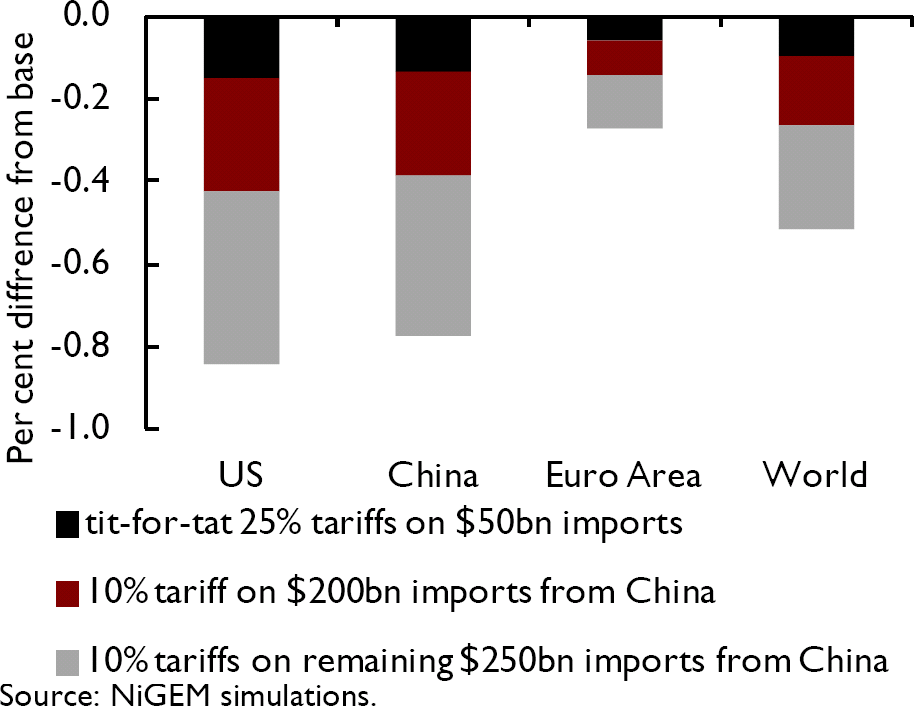
Figure A1. Impact on the level of GDP (in the third year)
In all simulations, higher tariffs lead to an increase in domestic inflationary pressures via an increase in import prices (see figure A2). A tit-for-tat trade dispute leads to an increase in domestic prices of a comparable magnitude in both China and the US, but the impact on inflation in the US becomes more pronounced after the US levy tariffs on a wider range of imports from China.
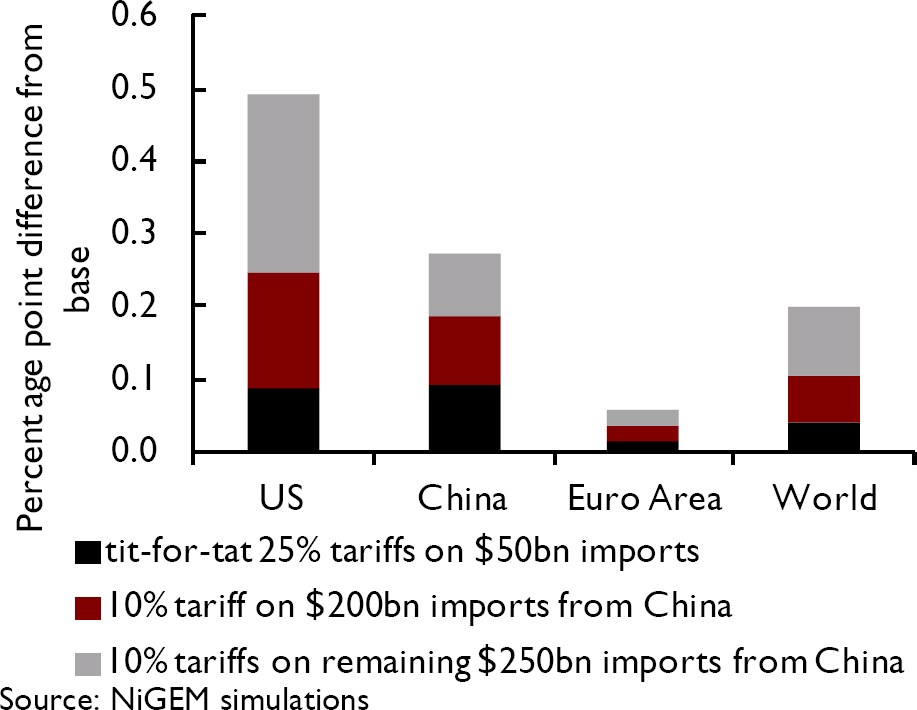
Figure A2. Impact on inflation (in the third year)
Notes
1 An expanded version of NiGEM v2.17b is used, enabling tariffs to be imposed between the US and all countries. Monetary policy reacts to deviations from nominal GDP and inflation targets; financial markets are forward looking and respond to expected changes in interest rates, so that if expectations of future interest rates are raised, following tariff imposition, then bond and equity prices will fall and the exchange value of the domestic currency will increase immediately, bringing some effects forward.
2 ‘From protectionism to prosperity’, speech by Mark Carney, Governor of the Bank of England, 5 July 2018.
Box B. Intra-Euro Area spillovers – simulating the effects of fiscal stimulus
What would European policymakers do if there was a severe slowdown in the global economy now? Monetary policy ammunition is largely exhausted and many countries appear to have little space to implement expansionary fiscal measures. In this Box, we address the heterogeneity of fiscal positions in the Euro Area, with a view to examining the effectiveness of fiscal expansions undertaken individually and collectively in stimulating aggregate demand in the monetary union.
Fiscal policies implemented by a country in isolation have an effect on other countries through trade linkages and resource flows. These spillover effects are particularly important in the Euro Area, given the comprehensiveness of its special agreements, integration among member states and its common currency. Nonetheless, there are large differences across Euro Area countries in the amount of room that individual countries have available to carry out fiscal expansions. Figure B1 shows the size of public debt and the budget balances in Euro Area countries, and highlights the degree of dispersion amongst them.
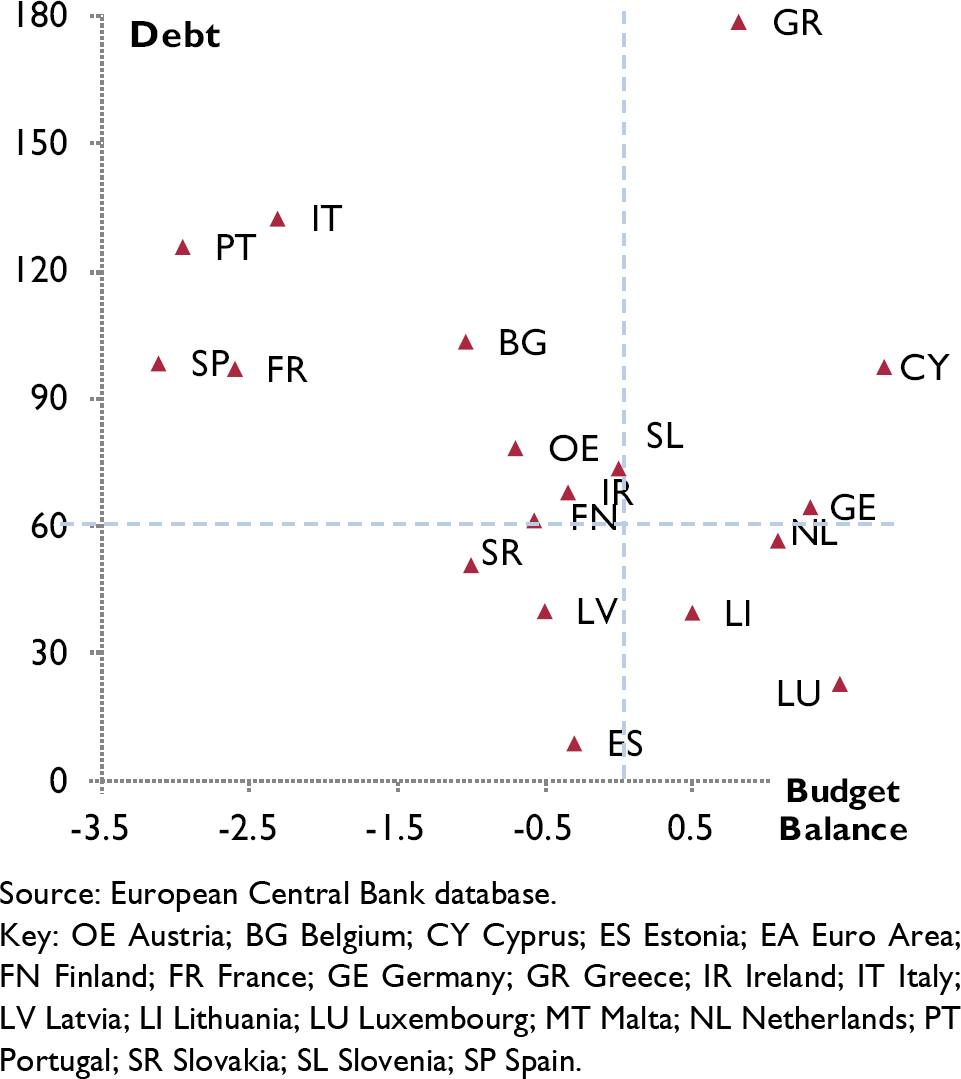
Figure B1. 2017 public debt and budget balance in Euro Area countries (per cent of GDP)
The medium-term budgetary objectives (MTOs) defined by the European Commission in the Stability and Growth Pact are set to ensure sound fiscal policies. According to those criteria, we assume here that a country has ‘fiscal space’ (i.e. the space to expand fiscal policy) if the levels of government debt-to-GDP and budget balance are broadly in line with those commitments. Considering the five major Euro Area economies, only Germany and the Netherlands appear to have fiscal space to increase public spending. However, amongst the constrained countries, Italy and France have recently legislated for or are calling for fiscal measures. In this Box, we assess the benefits that come with a more collective approach with regard to fiscal policy.
The analysis uses the National Institute's Global Econometric Model (NiGEM) to examine the effect of a co-ordinated Euro Area fiscal expansion and an expansion conducted by member states in isolation. The different scenarios simulate an expansion to government spending of the same magnitude (1 per cent of GDP) and duration (for two years), before they gradually revert to baseline. Monetary policy and exchange rates are kept exogenous for the duration of the shock.
Table B1 below shows the effect of fiscal expansions on first year output and contrasts the effects of the fiscal stimulus when done in isolation and when it is co-ordinated across the Euro Area as a whole.Footnote 1 The diagonal elements report the effects of the fiscal expansion in the country originating the fiscal expansion, while the off-diagonal elements show the spillover effect onto the other countries. At the bottom of the table, the line ‘Isolated’ reports once again the fiscal multiplier in the country originating the stimulus, and the line ‘Co-ordinated’ shows the fiscal multipliers from the co-ordinated Euro Area expansion on the individual countries and Euro Area as a whole.Footnote 2 Finally, the trade spillovers are reported.
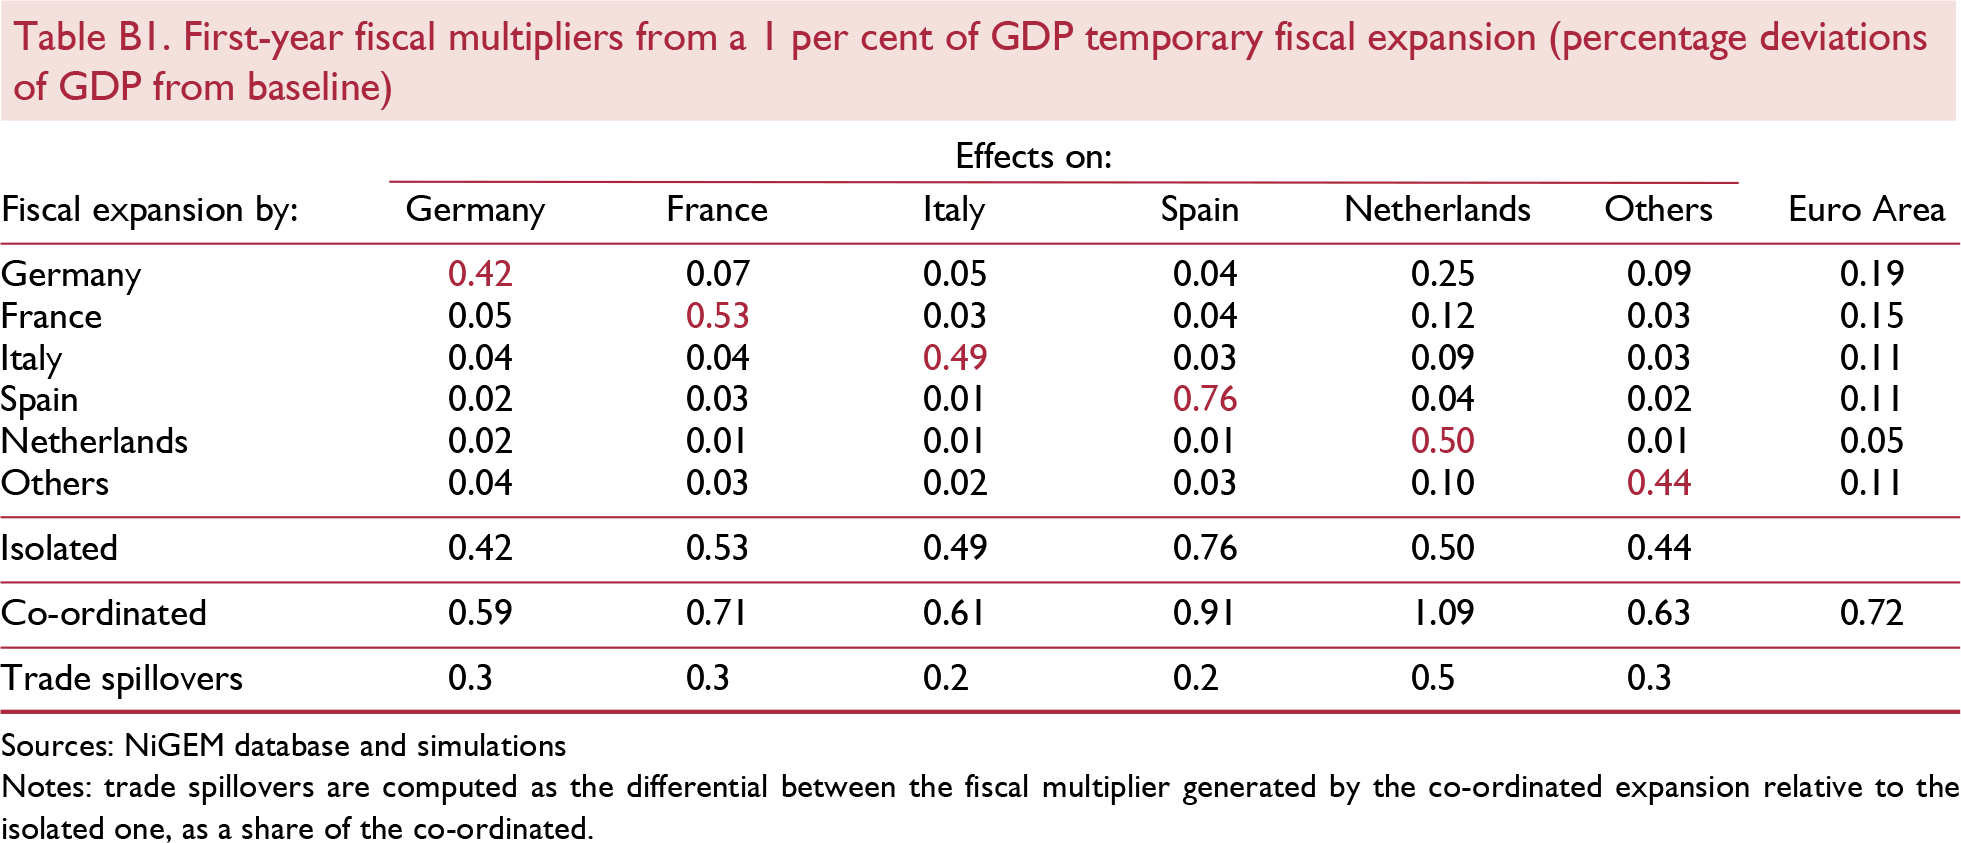
The domestic first-year fiscal multipliers are country-specific and are larger for countries where the number of liquidity-constrained consumers is higher, such that a rise in output determines a greater response of consumption. That is the case for Spain, where the isolated expansion yields a significantly higher increase in output relative to the same isolated expansion conducted elsewhere. In contrast, the same isolated expansion in Germany has a smaller fiscal multiplier as the estimated marginal propensity to consume out of current income is lower. However, a German expansion would yield the most beneficial effects to Euro Area growth relative to a fiscal shock adopted in the other member countries separately (around 0.2 percent points higher).
Comparing the size of domestic fiscal multipliers with the off-diagonal values, spillovers on other Euro Area states arising from the fiscal stimulus adopted only in one country are relatively small compared to their domestic effects. However, when all countries adopt them simultaneously, the trade spillovers account for around 30 per cent of the rise in output one year after the stimulus.
The magnitude of trade spillovers reflects the structure of Euro Area trade linkages and the degree of countries' openness, which determines their sensitivity to foreign demand shocks. The spillover effects of a co-ordinated Euro Area shock are bigger for countries that are more sensitive to a shock to Euro Area demand for their exports. For example, the co-ordinated fiscal multiplier in the Netherlands is more than double that of the isolated scenario (1.1 percentage points higher GDP when co-ordinated compared to 0.5 percentage points when done in isolation).
What if the expansion was limited to countries with fiscal space?
We have also simulated the effect of a co-ordinated expansion of only the countries that have space to expand fiscal policy – as defined before – and assessed the impact on the constrained countries that are not shocked. Figure B2 shows that the spillover effects generate benefits to those countries from the fiscal stimulus co-ordinated across the ‘stimulators’.
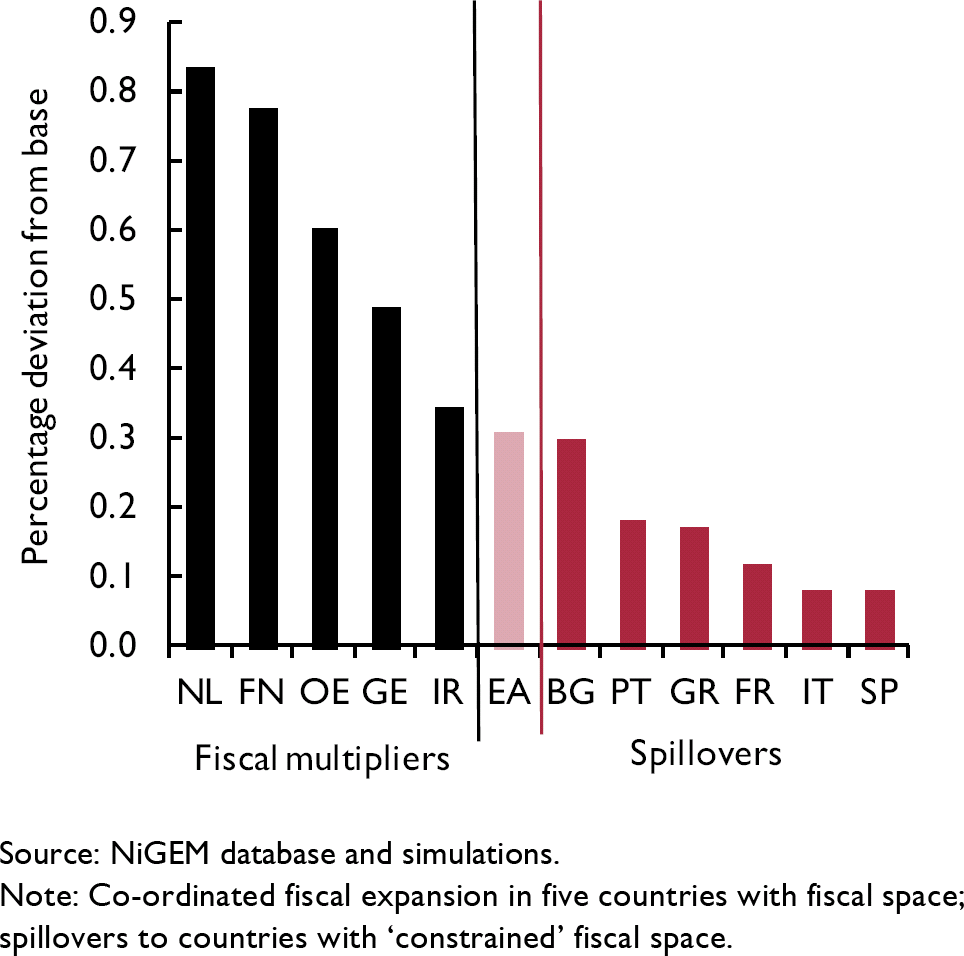
Figure B2. First-year fiscal multipliers and spillovers from a I per cent of GDP temporary fiscal expansion
The fiscal multiplier generated by the co-ordinated expansion conducted by the five countries with fiscal space is around 0.1 percentage points higher than if the expansion were implemented in Germany alone. Compared to table B1, the impact of a fully co-ordinated Euro Area expansion is significantly greater than an expansion limited to the five countries with fiscal space.
These results show that, if there were to be a fiscal expansion by Euro Area countries, the dispersion in Euro Area members' fiscal positions calls for a more collective approach. Many factors would contribute to the size of the final effect of a fiscal expansion. These results, however, provide a basis for ranking the effectiveness of various policies either co-ordinated across countries or undertaken in isolation. If a fiscal boost is implemented simultaneously, the fiscal multipliers are larger for all countries in the monetary union, with the trade spillover channel accounting for some 30 per cent of the average rise in output.
Notes
1 The analysis excludes Cyprus, Luxembourg and Malta as they are not modelled separately in NiGEM; also Estonia, Latvia, Lithuania, Slovakia and Slovenia are not included as, although in NiGEM, there is not an explicit model for the government sector.
2 Pain, N., Rusticelli, E., Salins, V. and Turner, D. (2018), in ‘A model-based analysis of the effects of increased public investment’ (National Intitute Economic Review, May), used NiGEM to estimate the size of fiscal multipliers across the G7 from an expansion to government consumption relative to government investment.


