


I. INTRODUCTION
Anthraquinone-2-carboxylic acid (AQCA) is in the class of polyphenols that possess anti-inflammatory qualities. AQCA is abundant in Tabebuia bignoniaceae (trumpet tree) tree bark and has been found to inhibit the COX-2 (cyclooxygenase) enzyme (Ma et al., Reference Ma, Yada, Lee, Fukuda, Iida and Suzuki2017). Its anti-inflammatory properties have been investigated by Park et al. (Reference Park, Kim, Kim, Yang, Kim, Hong, Kim, Yoo, Kim, Kim and Cho2016). The systematic name (CAS Registry Number 117-78-2) is 9,10-dioxoanthracene-2-carboxylic acid. A two-dimensional molecular structure is shown in Figure 1.

Figure 1. The two-dimensional structure of anthraquinone-2-carboxylic acid.
X-ray powder diffraction patterns of AQCA and its methanol solvate have been reported by Tsai et al. (Reference Tsai, Kuo and Lin1993), and a variety of other physical properties were determined. A connectivity search in the Cambridge Structural Database (Groom et al., Reference Groom, Bruno, Lightfoot and Ward2016) yielded crystal structures of a DMSO adduct (Gruber et al., Reference Gruber, Helas, Seichter and Weber2010; TAJGIW) and two clathrates (Kobayashi et al., Reference Kobayashi, Kodama and Saigo2008; WIXVOP and WIXVUV), but no structures of pure AQCA.
This work was carried out as part of a project (Kaduk et al., Reference Kaduk, Crowder, Zhong, Fawcett and Suchomel2014) to determine the crystal structures of large-volume commercial pharmaceuticals, and include high-quality powder diffraction data for them in the Powder Diffraction File (Gates-Rector and Blanton, Reference Gates-Rector and Blanton2019).
II. EXPERIMENTAL
AQCA was a commercial reagent, purchased from TargetMol (Batch #119182), and was used as-received. The yellow powder was packed into a 1.5-mm diameter Kapton capillary, and rotated during the measurement at ~50 Hz. The powder pattern was measured at 295 K at beam line 11-BM (Antao et al., Reference Antao, Hassan, Wang, Lee and Toby2008; Lee et al., Reference Lee, Shu, Ramanathan, Preissner, Wang, Beno, Von Dreele, Ribaud, Kurtz, Antao, Jiao and Toby2008; Wang et al., Reference Wang, Toby, Lee, Ribaud, Antao, Kurtz, Ramanathan, Von Dreele and Beno2008) of the Advanced Photon Source at Argonne National Laboratory using a wavelength of 0.458153(2) Å from 0.5° to 50° 2θ with a step size of 0.001° and a counting time of 0.1 s/step. The high-resolution powder diffraction data were collected using twelve silicon crystal analyzers that allow for high angular resolution, high precision, and accurate peak positions. A mixture of silicon (NIST SRM 640c) and alumina (NIST SRM 676a) standards (ratio Al2O3:Si = 2:1 by weight) was used to calibrate the instrument and refine the monochromatic wavelength used in the experiment.
The pattern was indexed using DICVOL14 (Louër and Boultif, Reference Louër and Boultif2014) on a primitive monoclinic unit cell with a = 22.70667, b = 3.73900, c = 26.39351 Å, β = 106.563°, V = 2148.35 Å3, and Z = 8. Up to three unindexed lines were permitted. Analysis of the systematic absences using EXPO2014 (Altomare et al., Reference Altomare, Cuocci, Giacovazzo, Moliterni, Rizzi, Corriero and Falcicchio2013) suggested the space group P2 1, so there were four molecules in the asymmetric unit. A reduced cell search of the Cambridge Structural Database (Groom et al., Reference Groom, Bruno, Lightfoot and Ward2016) yielded no hits.
The AQCA molecule was downloaded from PubChem (Kim et al., Reference Kim, Chen, Cheng, Gindulyte, He, He, Li, Shoemaker, Thiessen, Yu, Zaslavsky, Zhang and Bolton2023) as Conformer3D_CID_67030.sdf, and converted to a *.mol2 file using Mercury (Macrae et al., Reference Macrae, Sovago, Cottrell, Galek, McCabe, Pidcock, Platings, Shields, Stevens, Towler and Wood2020). The crystal structure was solved using Monte Carlo simulated annealing techniques as implemented in EXPO2014 (Altomare et al., Reference Altomare, Cuocci, Giacovazzo, Moliterni, Rizzi, Corriero and Falcicchio2013). The best two of the ten solutions were similar. The remaining solutions contained close intermolecular contacts, so the best solution was selected for initial refinement.
After initial refinement, the carboxylic acid group of one of the four molecules made close intermolecular contacts with aromatic C–H groups, and was not in a position to form hydrogen bonds. Accordingly, the molecule was “flipped” 180° using Materials Studio (Dassault Systèmes, 2022) to an orientation more suitable for hydrogen bonding, and the structure was re-refined. Analysis of potential hydrogen bonds (using the O⋯O distances) made the approximate positions of the carboxylic acid protons clear.
Rietveld refinement was carried out using GSAS-II (Toby and Von Dreele, Reference Toby and Von Dreele2013). Only the 0.9°–25.0°θ portion of the pattern was included in the refinement (d min = 1.058 Å). All of the carbon, aromatic hydrogen atoms, and quinone oxygen atoms were modeled using a C15H8O2 rigid body, derived from optimization of the AQCA structure from PubChem using Spartan ‘20 (Wavefunction, 2022), and removing the 2O and H atoms of the carboxylic acid group. The group was saved as an *.xyz file, and imported into GSAS-II as a vector rigid body. Only the O atoms of the carboxylic acid groups were refined independently, subject to C–O bond restraints of 1.27(5) Å, and bond angle restraints of O–C–O = 125(3) and C–C–O = 117.5(30)°, to permit rotation of the carboxylic acid groups. The active H atoms were fixed based on the results of the density functional theory (DFT) calculation. An independent Uiso was refined for each of the four rigid bodies. The Uiso of the two O atoms in each carboxyl group were constrained to a common value. A preferred orientation model was included in the refinement as sixth-order spherical harmonics. The peak profiles were described using the generalized microstrain model (Stephens, Reference Stephens1999). The background was modeled using a six-term shifted Chebyshev polynomial, and a peak at 6.17° 2θ to model the scattering from the Kapton capillary and any amorphous component.
The final refinement (begun from the DFT-optimized structure) of seventy-eight variables using 24,139 observations and twenty restraints yielded the residuals Rwp = 0.19333 and GOF = 4.10. The largest peak (0.139 Å from C5) and hole (1.964 Å from C94) in the difference Fourier map were 0.67(16) and −0.68(16) eÅ−3, respectively. The largest errors in the difference plot (Figure 2) were in peak intensities, and the refinement overall was unsatisfactory. There were unindexed peaks. The Certificate of Analysis indicates 99.83% purity, so they may represent the trace presence of an additional polymorph.

Figure 2. The Rietveld plot for the incorrect refinement of anthraquinone-2-carboxylic acid. The blue crosses represent the observed data points, and the green line is the calculated pattern. The cyan curve is the normalized error plot, and the red line is the background curve. The vertical scale has been multiplied by a factor of 10× for 2θ > 10.0°.
Tsai et al. (Reference Tsai, Kuo and Lin1993) indicated that AQCA could be recrystallized by sublimation, so a second sample was purchased (Sigma–Aldrich 1003514978) and an aliquot was recrystallized by placing as-received powder in a beaker and heating it on a hot plate, while covering the beaker with a watch glass. Long needles were produced (Figure 3). A portion of the needles was ground in a mortar and pestle, and packed into a 0.3-mm diameter glass capillary. The X-ray powder diffraction pattern was measured on a PANalytical Empyrean diffractometer equipped with an incident-beam focusing mirror and an X'Celerator detector. The pattern (1°–50° 2θ, 0.0083556° steps, 4.0 s/step, 1/4° divergence slit, 0.02 radian Soller slits) was measured using Mo Kα radiation.
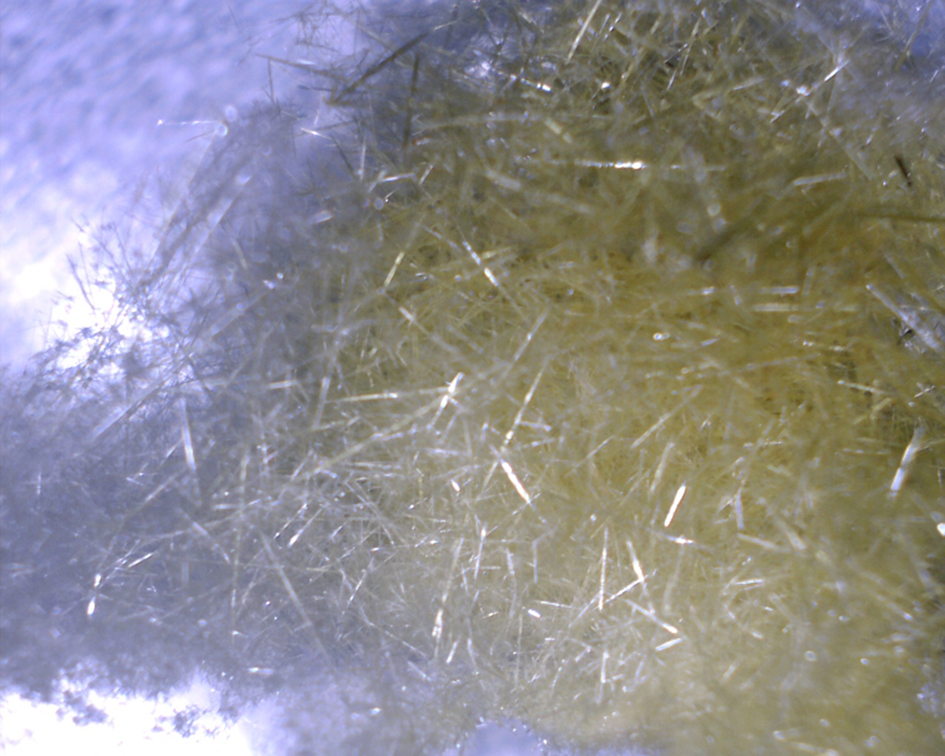
Figure 3. An optical micrograph of the needles obtained by recrystallizing anthraquinone-2-carboxylic acid by sublimation.
Several peaks that were present in the original synchrotron pattern were not observed in the pattern of the recrystallized sample (Figure 4). The laboratory pattern was indexed using N-TREOR (Altomare et al., Reference Altomare, Cuocci, Giacovazzo, Moliterni, Rizzi, Corriero and Falcicchio2013) on a primitive triclinic cell having a = 3.7985, b = 12.2241, c = 22.8641 Å, α = 73.485, β = 89.934, γ = 86.453°, V = 1098.7 Å3, and Z = 4. A reduced cell search in the Cambridge Structural Database (Groom et al., Reference Groom, Bruno, Lightfoot and Ward2016) yielded no hits.

Figure 4. Comparison of the synchrotron pattern of anthraquinone-2-carboxylic acid (black) to that of the recrystallized material (green). The laboratory pattern (measured using Mo Kα radiation) was converted to the synchrotron wavelength of 0.458153(2) Å using JADE Pro (MDI, 2023). Image generated using JADE Pro (MDI, 2023).
The structure was solved using the triclinic cell and the synchrotron data with EXPO2014 (Altomare et al., Reference Altomare, Cuocci, Giacovazzo, Moliterni, Rizzi, Corriero and Falcicchio2013), using two molecules as fragments. A bump penalty and (100) preferred orientation were included.
Separate Rietveld refinements were carried out with GSAS-II (Toby and Von Dreele, Reference Toby and Von Dreele2013) using the synchrotron and laboratory data (different samples). All non-H bond distances and angles were subjected to restraints, based on a Mercury/Mogul Geometry Check (Bruno et al., Reference Bruno, Cole, Kessler, Luo, Motherwell, Purkis, Smith, Taylor, Cooper, Harris and Orpen2004; Sykes et al., Reference Sykes, McCabe, Allen, Battle, Bruno and Wood2011). The Mogul average and standard deviation for each quantity were used as the restraint parameters. The anthraquinone ring systems and the carboxyl groups were restrained to be planar. The hydrogen atoms were included in calculated positions, which were recalculated during the refinement using Materials Studio (Dassault, 2022). The Uiso of the heavy atoms were grouped by chemical similarity. The Uiso for the H atoms were fixed at 1.3× the Uiso of the heavy atoms to which they are attached. The peak profiles were described using the generalized microstrain model. The refinements yielded the residuals included in Table I. The final Rietveld plots are shown in Figure 5.
TABLE I. Summary of refinement residuals for the different data sets of anthraquinone-2-carboxylic acid.


Figure 5. Final Rietveld plots for the refinements of anthraquinone-2-carboxylic acid using synchrotron (left) and laboratory (right) data. The blue crosses represent the observed data points, and the green line is the calculated pattern. The cyan curve is the normalized error plot, and the red line is the background curve.
The structure of AQCA was optimized (fixed experimental unit cell) with density functional techniques using VASP (Kresse and Furthmüller, Reference Kresse and Furthmüller1996) through the MedeA graphical interface (Materials Design, 2016). The calculation was carried out on 16 2.4 GHz processors (each with 4 Gb RAM) of a 64-processor HP Proliant DL580 Generation 7 Linux cluster at North Central College. The calculation used the GGA-PBE functional, a plane wave cutoff energy of 400.0 eV, and a k-point spacing of 0.5 Å−1 leading to a 4 × 1 × 1 mesh, and took ~6.2 h. Single-point density functional calculations (fixed experimental cell) and population analysis were carried out using CRYSTAL23 (Erba et al., Reference Erba, Desmaris, Casassa, Civalleri, Donà, Bush, Searle, Maschio, Daga, Cossard, Ribaldone, Ascrizzi, Marana, Flament and Kirtman2023). The basis sets for the H, C, and O atoms in the calculation were those of Gatti et al. (Reference Gatti, Saunders and Roetti1994). The calculations were run on a 3.5 GHz PC using 14 k-points and the B3LYP functional, and took ~2.6 h. VASP indicated that this compound is a semiconductor, with a band gap of 1.745 eV.
III. RESULTS AND DISCUSSION
The powder pattern of this study is similar enough to that reported by Tsai et al. (Reference Tsai, Kuo and Lin1993; Figure 6) to conclude that they probably represent the same material, but there are differences, so the conclusion is not certain. The material used by Tsai et al. may contain an additional polymorph. Our material is probably representative of that used in commerce.

Figure 6. Comparison of the synchrotron pattern of anthraquinone-2-carboxylic acid (black) to that reported by Tsai et al. (Reference Tsai, Kuo and Lin1993; green). The literature pattern (measured using Cu Kα radiation) was digitized using UN-SCAN-IT (Silk Scientific, 2013) and converted to the synchrotron wavelength of 0.458153(2) Å using JADE Pro (MDI, 2023). Image generated using JADE Pro (MDI, 2023).
The crystal structure contains two independent molecules of AQCA. The molecules with atom numbering are illustrated in Figure 7. Although the expected hydrogen-bonded dimers are present, the dimers are not centrosymmetric. The dimer contains one molecule of each planar low-energy conformation.

Figure 7. The asymmetric unit of anthraquinone-2-carboxylic acid, with the atom numbering. The atoms are represented by 50% probability spheroids. Image generated using Mercury (Macrae et al., Reference Macrae, Sovago, Cottrell, Galek, McCabe, Pidcock, Platings, Shields, Stevens, Towler and Wood2020).
The root-mean-square (rms) Cartesian displacements of the non-H atoms in the Rietveld-refined and VASP-optimized molecules are 0.327 and 0.092 Å for molecule 1 (lower atom numbers) and molecule 2. The agreements are within the normal range for correct structures (van de Streek and Neumann, Reference van de Streek and Neumann2014). The largest differences are in the orientation of the carboxylic acid group in molecule 1. The rms difference in the absolute positions in the unit cell is 0.454 Å (Figure 8). The relatively limited range of data and the relatively broad peaks limit the accuracy which can be achieved. The remainder of this discussion will emphasize the VASP-optimized structure.

Figure 8. Comparison of the Rietveld-refined (red) and VASP-optimized (blue) structures of anthraquinone-2-carboxylic acid. Image generated using Mercury (Macrae et al., Reference Macrae, Sovago, Cottrell, Galek, McCabe, Pidcock, Platings, Shields, Stevens, Towler and Wood2020).
The crystal structure (Figure 9) consists of a herringbone array of centrosymmetric pairs of molecules parallel to the bc-plane, or alternatively arrangement of non-centrosymmetric hydrogen-bonded dimers along the c-axis. The molecules stack along the short a-axis. The mean planes of the anthraquinone ring systems are approximately –5, –5, 8 and 4, 6, –1. The Mercury Aromatics Analyser indicated strong interactions along the a-axis, with a distance of 3.79 Å.

Figure 9. The crystal structure of anthraquinone-2-carboxylic acid, viewed down the a-axis. Image generated using Mercury (Macrae et al., Reference Macrae, Sovago, Cottrell, Galek, McCabe, Pidcock, Platings, Shields, Stevens, Towler and Wood2020).
All of the bond distances, bond angles, and torsion angles fall within the normal ranges indicated by a Mercury Mogul Geometry check (Macrae et al., Reference Macrae, Sovago, Cottrell, Galek, McCabe, Pidcock, Platings, Shields, Stevens, Towler and Wood2020). Quantum chemical geometry optimization of the isolated molecules (DFT/B3LYP/6-31G*/water) using Spartan ‘20 (Wavefunction, 2022) indicated the two conformations are essentially identical in energy, as expected (Kaduk et al., Reference Kaduk, Golab and Leusen1998).
Analysis of the contributions to the total crystal energy of the structure using the Forcite module of Materials Studio (Dassault Systèmes, 2022) suggests that bond distortion terms dominate the intramolecular deformation energy. The intermolecular energy is dominated by electrostatic attractions, which in this force field analysis also include hydrogen bonds. The hydrogen bonds are better analyzed using the results of the DFT calculation.
Hydrogen bonds (Table II) are prominent in the crystal structure. The two independent molecules are linked into dimers through strong O–H⋯O hydrogen bonds. The energies of these O–H⋯O hydrogen bonds were estimated using a correlation derived from the results of Rammohan and Kaduk (Reference Rammohan and Kaduk2018). Several C–H⋯O bonds, both intra- and inter-molecular, also contribute to the lattice energy.
TABLE II. Hydrogen bonds (CRYSTAL23) in anthraquinone-2-carboxylic acid.

a Intramolecular charge.
The Bravais–Friedel–Donnay–Harker (Bravais, Reference Bravais1866; Friedel, Reference Friedel1907; Donnay and Harker, Reference Donnay and Harker1937) model suggests that we might expect needle morphology for AQCA, with 〈100〉 as the long axis, and an aspect ratio of approximately 6:1 (Figure 10). This morphology is consistent with that of the recrystallized sample. A second-order spherical harmonic model for preferred orientation was included in the refinements. As noted in Table I, the texture indices were not especially high, showing that preferred orientation was minor in these rotated capillary specimens.

Figure 10. The Bravais–Friedel–Donnay–Harker morphology of anthraquinone-2-carboxylic acid, predicted by Mercury. Image generated using Mercury (Macrae et al., Reference Macrae, Sovago, Cottrell, Galek, McCabe, Pidcock, Platings, Shields, Stevens, Towler and Wood2020).
IV. DEPOSITED DATA
The powder pattern of AQCA from this synchrotron data set has been submitted to ICDD for inclusion in the Powder Diffraction File. The Crystallographic Information Framework (CIF) files containing the results of the Rietveld refinement (including the raw data) and the DFT geometry optimization were deposited with the ICDD. The data can be requested at pdj@icdd.com.
ACKNOWLEDGEMENTS
Use of the Advanced Photon Source at Argonne National Laboratory was supported by the U.S. Department of Energy, Office of Science, Office of Basic Energy Sciences, under Contract No. DE-AC02-06CH11357. This work was partially supported by the International Centre for Diffraction Data. We thank Lynn Ribaud and Saul Lapidus for their assistance in the data collection.
CONFLICTS OF INTEREST
The authors have no conflicts of interest to declare.


 Open access