


The dry period is the time before the calving of cows when they are not milked. A 55- to 60-d dry period is traditionally recommended and it has an important role in the milk production cycle. In addition to giving cows a chance to rest before the beginning of a new lactation, the dry period provides the opportunity to treat animals with chronic intramammary infection (van Hoeij et al., Reference van Hoeij, Lam, de Koning, Steeneveld, Kemp and van Knegsel2016). It also allows for the regeneration of epithelial tissues in the mammary gland before the onset of a new lactation (Capuco et al., Reference Capuco, Akers and Smith1997), which maximizes milk production (van Knegsel et al., Reference van Knegsel, van der Drift, Čermáková and Kemp2013). Previous studies indicate that a dry period of 50 to 60 d is necessary to maximize milk production in the subsequent lactation (Sørensen and Enevoldsen, Reference Sørensen and Enevoldsen1991; Rastani et al., Reference Rastani, Grummer, Bertics, Gümen, Wiltbank, Mashek and Schwab2005). However, some results indicate that the reduction of the dry period could have a positive consequence not only on milk production and its composition, but also on the metabolic status and fertility of the animals (Bachman and Schairer, Reference Bachman and Schairer2003; Gulay et al., Reference Gulay, Hayen, Bachman, Belloso, Liboni and Head2003; de Feu et al., Reference de Feu, Evans, Lonergan and Butler2009).
Most studies of dry period length were, however, carried out under different climatic and management conditions than those observed in a tropical country such as Brazil. For instance, the regeneration of the mammary gland epithelial tissue during the dry period might be delayed or compromised by high environment temperatures, potentially having a negative effect on milk production (Fabris et al., Reference Fabris, Laporta, Skibiel, Corra, Senn, Wohlgemuth and Dahl2019). The available evidence indicates a negative association of dry periods shorter or longer than 60 to 79 d with milk production (Teixeira et al., Reference Teixeira, Valente, Verneque and Freitas1999), but the relationship with milk components still requires evaluation, especially considering the implementation of genetic selection programmes for milk production (Boligon et al., Reference Boligon, Rorato, Ferreira, Weber, Kippert and Andreazza2005; Canaza-Cayo et al., Reference Canaza-Cayo, Cobuci, Lopes, Almeida Torres, Martins, Santos Daltro and Barbosa da Silva2016). Therefore, it is necessary to evaluate the relationship between the dry period length and milk production, but also its components in animals kept under tropical conditions to establish an ideal duration to maximize production. We hypothesized that different lengths of dry period would influence milk production and its components. Thus, the objective of this study was to evaluate the relationship between dry period length and the production of milk, fat, protein, lactose, and total milk solids in the subsequent lactation of Holstein dairy cows in tropical climate.
Materials and methods
The dairy herd improvement (DHI) data used in this study were provided by the Holstein Cattle Breeders Association of Minas Gerais (ACGHMG). All data were collected by producers and ACGHMG technicians as part of the regular ACGHMG on-farm milk recording and conformed to normal farm animal handling. Consequently, approval from the Ethics Committee on the Use of Animals was not required.
The initial data file consisted of 85 046 records of completed lactations (i.e. one record per animal per lactation) from 37 581 Holstein cows of 129 dairy herds located in Minas Gerais state, Brazil. The data were collected from animals that calved between 1982 and 2017. Over the study years, the overall average daily temperature was 22.0°C (standard deviation; sd = 3.38°C) and it ranged from 4.2°C to 33.5°C (INMET, 2022). The average daily humidity was 71.7% (sd = 13.53%; minimum = 8.0%; maximum = 100.0%), and the average yearly rainfall was 1277.1 mm (sd = 402.36 mm; minimum 136.3 mm; maximum 3631.3 mm; INMET, 2022).
Data cleaning and handling
Data handling, cleaning, and modelling were done using the R software (R Core Team, 2021) and its specific packages. Editing was performed to ensure both reliability and consistency for the analysis. Duplicated (n = 557) and first lactation (n = 34 309) observations were removed. Next, cows with lactation greater than or equal to six were grouped together (6+). Based on a frequency analysis, the following constraints were imposed on calving age by parity to ensure that parities were consistent with sensible ages at calving: 29 to 60 months for second parity, 38 to 70 months for third parity, 47 to 90 months for fourth parity, 60 to 110 months for fifth parity and 70 to 130 months for 6+ parity. Observations falling out of this range were excluded (n = 5155). Besides, observations in which lactation length was equal to zero or greater than 600 d (n = 1205) as well as if the length of dry period was missing (n = 3093) or greater than 120 d (n = 6404) were also excluded. Outliers on the production of milk (n = 790), fat (n = 272), protein (n = 225), lactose (n = 42), and total solids (127) were identified and sequentially removed following the methodology proposed by Leys et al. (Reference Leys, Ley, Klein, Bernard and Licata2013), in which the range of valid observations is defined as the median ± 2.5 times the median absolute deviation. The valid range of observations was calculated based on calving year and parity number.
Multiple imputation was used to handle missing observations. After data cleaning, the percentage of missing observations ranged from 0.95% on calf status at birth (n = 313) to 18.94% on lactation length (n = 6225). The average percentage of missing observations per herd was 4.26% (sd = 2.59%) and ranged from 0 to 14.0%. The function missForest from the package missForest (Stekhoven and Buehlmann, Reference Stekhoven and Buehlmann2012) was used to impute the missing observations. In short, this is a nonparametric approach that consists of training a random forest model based on complete observations to impute each of the missing values (Stekhoven and Buehlmann, Reference Stekhoven and Buehlmann2012). In addition to multiple imputation being a better approach compared with other methodologies in order to increase power and accuracy of the data analysis (van Buuren, Reference van Buuren2019), random forest is able to handle complex interactions between variables even in conditions where there is a high number of missing observations (Tang and Ishwaran, Reference Tang and Ishwaran2017), which is frequently observed in DHI data.
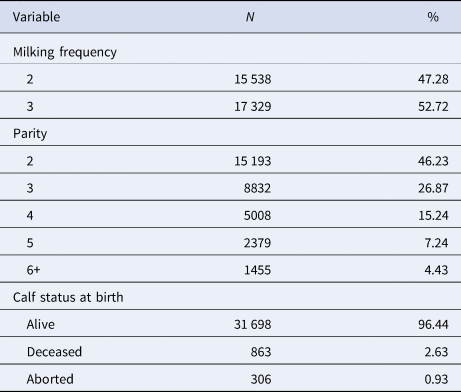
After data handling and cleaning, the remained data from 32 867 complete lactations of 19 535 Holstein animals that calved between 1993 and 2017 in 122 herds was analysed. Descriptive statistics of the variables considered in this study are presented in Tables 1 and 2.
Table 1. Distribution of numeric variables used in this study

sd, standard deviation.
a Total production over the complete lactation.
Table 2. Distribution of categorical variables used in this study
Analysis
Completed lactation production of milk, fat, protein, lactose, and total solids were considered as the response variables while dry period length was considered the explanatory variable. Calving age, lactation length, milking frequency, parity number, and calf status at birth were also considered in the analysis as covariables to account for additional sources of variation. In addition, herd, calving year, and calving season were included in the analyses as proxies for clustering, time, and seasonal effects, respectively.
Variance inflation factors (VIF) were calculated, using the vif function from the car R package (Fox and Weisberg, Reference Fox and Weisberg2019), to evaluate the multicollinearity between the explanatory variable and covariates using the complete data set. A threshold of 10.0 was used to evaluate the estimated VIF (James et al., Reference James, Witten, Hastie and Tibshirani2013). Next, a stratified splitting, based on the response variables, was used to split the data into training and validation sets using a 75 to 25 ratio, respectively, for each response variable separately, creating a separate set of training and validation data for each response variable. The training data sets were used to train the models and the validation data sets were used to evaluate their performance.
A covariate shift analysis was conducted to evaluate if the distribution of the explanatory variable and covariates differed between training and validation data sets. A label identifying the data set (training or validation) was created and a random forest classifier was trained using 10-fold cross-validation to predict the label. A classifier model was trained for each of the response variables individually using the h2o.randomForest function from the h2o package (LeDell et al., Reference LeDell, Gill, Aiello, Fu, Candel, Click, Kraljevic, Nykodym, Aboyoun, Kurka and Malohlava2020) and these were evaluated based on the area under the curve (AUC) metric.
Machine learning algorithms
The data were analysed with machine learning algorithms as they are able to automatically handle potential nonlinearities and high-order interactions present in the data. Gradient boosting machine (GBM), extreme gradient boosting machine (XGBM), random forest (RF), and artificial neural network (ANN) were the machine-learning algorithms used in this study to train models. The best model was then used to analyse the relationship between the dry period length and response variables. All models were trained on the training data sets using 10-fold cross-validation. The GBM, XGBM, and RF models were trained using the caret package (Kuhn, Reference Kuhn2020) by specifying the methods gbm, xgbTree, and ranger respectively. Hyperparameters for these models were tuned using adaptive resampling, which resamples the hyperparameter tuning grid by concentrating on values closer to the identified optimal settings (Kuhn, Reference Kuhn2014, Reference Kuhn2020). The ANN model was trained using the h2o package (LeDell et al., Reference LeDell, Gill, Aiello, Fu, Candel, Click, Kraljevic, Nykodym, Aboyoun, Kurka and Malohlava2020). The hyperparameters for this model were tuned using a random grid search composed of activation functions (hyperbolic tangent, rectifier linear, and maxout), number of hidden layers (2, 3, and 4), number of neurons in each hidden layer (150, 200, and 250), and dropout ratio (0, 5, 10, and 15%). The search was set to stop if the improvement in prediction error, measured by the root mean square error (RMSE), did not decrease by 1 × 10⁻⁴ after five consecutive models.
Four metrics were used to evaluate the final models. The efficacy of adjustment was evaluated through the coefficient of determination (R 2), while the deviation between the observed and predicted values was evaluated by the RMSE, mean absolute error (MAE), and mean percentage error (MPE). The best model would have the highest R 2 and lowest RMSE, MAE, and MPE. This evaluation was done using the validation data set. The best model was used for further analysis that were conducted using the complete data set (i.e. training and validation data set combined).
Inferential analysis
Different statistical approaches were used to obtain biological insights from the best model for each of the response variable (i.e. completed lactation production of milk, fat, protein, lactose, and total solids). Permutation was used to evaluate variable importance. In short, this is a model agnostic approach that measures the prediction error of the model after shuffling the variables’ values, which changes the relationship between the variables and the outcome. Shuffling the values of important variables would result in an increase of the error while the error would remain unchanged for variables that bare not important (Molnar, Reference Molnar2019).
The strength of interaction between dry period length and the covariables was measured using the Friedman's H-statistic (Friedman and Popescu, Reference Friedman and Popescu2008), which is also a model agnostic approach. This statistic measures the fraction of the variance explained by interactions that is not explained by the additive effect of the variables alone (Friedman and Popescu, Reference Friedman and Popescu2008). The influence of the dry period length was obtained from the best model using partial dependence plots (PDP). It indicates the marginal relationship between the dry period length and the production after controlling for the covariates (Friedman, Reference Friedman2001). It depicts if the shape of the relationship between the response variables and the dry period length is linear, monotonic, or more complex (Molnar, Reference Molnar2019).
Variable importance and PDP were calculated using the functions FeatureImp and FeatureEffect, respectively, from the R package iml (Molnar et al., Reference Molnar, Casalicchio and Bischl2018). The overall interaction strength was calculated using the light_interaction function from the R package flashlight (Mayer, Reference Mayer2021).
Results
The VIF values ranged from 1.03 to 6.61, which did not indicate the presence of multicollinearity (i.e. high linear correlation) between explanatory variable and covariates since they were all lower than 10.0 (James et al., Reference James, Witten, Hastie and Tibshirani2013). The AUC obtained in the covariate shift analysis of milk (AUC = 0.495), fat (AUC = 0.503), protein (AUC = 0.497), lactose (AUC = 0.509), and total solids (AUC = 0.501) did not imply strong evidence of covariate shift between the training and the validation data sets.
All algorithms showed good overall predictive ability between all response variables. The efficacy of adjustment, as measured by the R 2, ranged from 0.70 to 0.79 and the prediction error, as measured by the MPE, ranged from 20.39 to 28.60% across all response variables (Table 3). The best performing models were selected by comparing their performance in the validation data set. The RF algorithm produced the models with the best performance for most of the metrics (Table 3) and they were used for further inferential analysis.
Table 3. Results of gradient boosting machine (GBM), extreme gradient boosting machine (XGBM), random forest (RF), and artificial neural network (ANN) models obtained on the validation data set of each response variable (milk, fat, protein, lactose, and total solids)

Best results within rows are bolded.
R 2, coefficient of determination; RMSE, root mean squared error; MAE, mean absolute error; MPE, mean percentage error.
The explanatory variable and covariates were ranked according to their importance in contributing to the models' predictions based on permutation. Lactation length, milking frequency, and dry period length ranked first, second, and third, respectively, for all response variables (Fig. 1). The overall interaction strengths were weak and did not imply strong evidence of interaction between explanatory variable and covariates (Fig. 2). Similar to variable importance, lactation length, milking frequency, and dry period length had the first, second, and third highest interaction strength, respectively, for all response variables. The highest interaction strength ranged from 0.23 in milk production to 0.27 in lactose production, both for the lactation length variable (Fig. 2). On the other hand, dry period length interaction strength only ranged from 0.10 on lactose to 0.12 on protein (Fig. 2).

Fig. 1. Importance (x axis) of explanatory variables (y axis) to predict complete lactation production of milk (a), fat (b), protein (c), lactose (d), and total milk solids (e) based on random forest models. Variable importance indicates the increase in model error prediction, measured as root mean squared error, when shuffling the values of explanatory variables (Molnar, Reference Molnar2019).

Fig. 2. Overall interaction strength (x axis) of explanatory variables (y axis) to predict complete lactation production of milk (a), fat (b), protein (c), lactose (d), and total milk solids (e). The higher the value -.
The relationship between dry period length and complete lactation milk, fat, protein, lactose, and total milk solids production are shown in Figure 3. A positive parabolic relationship was found between dry period length and production, but the estimated highest average production differed depending on the response variable. Highest milk production was observed when dry period length was, on average, 50 d long, while the average highest production of fat, protein, lactose and total milk solids were observed when the dry period was 38, 38, 50, and 44 d long, respectively (Fig. 3).
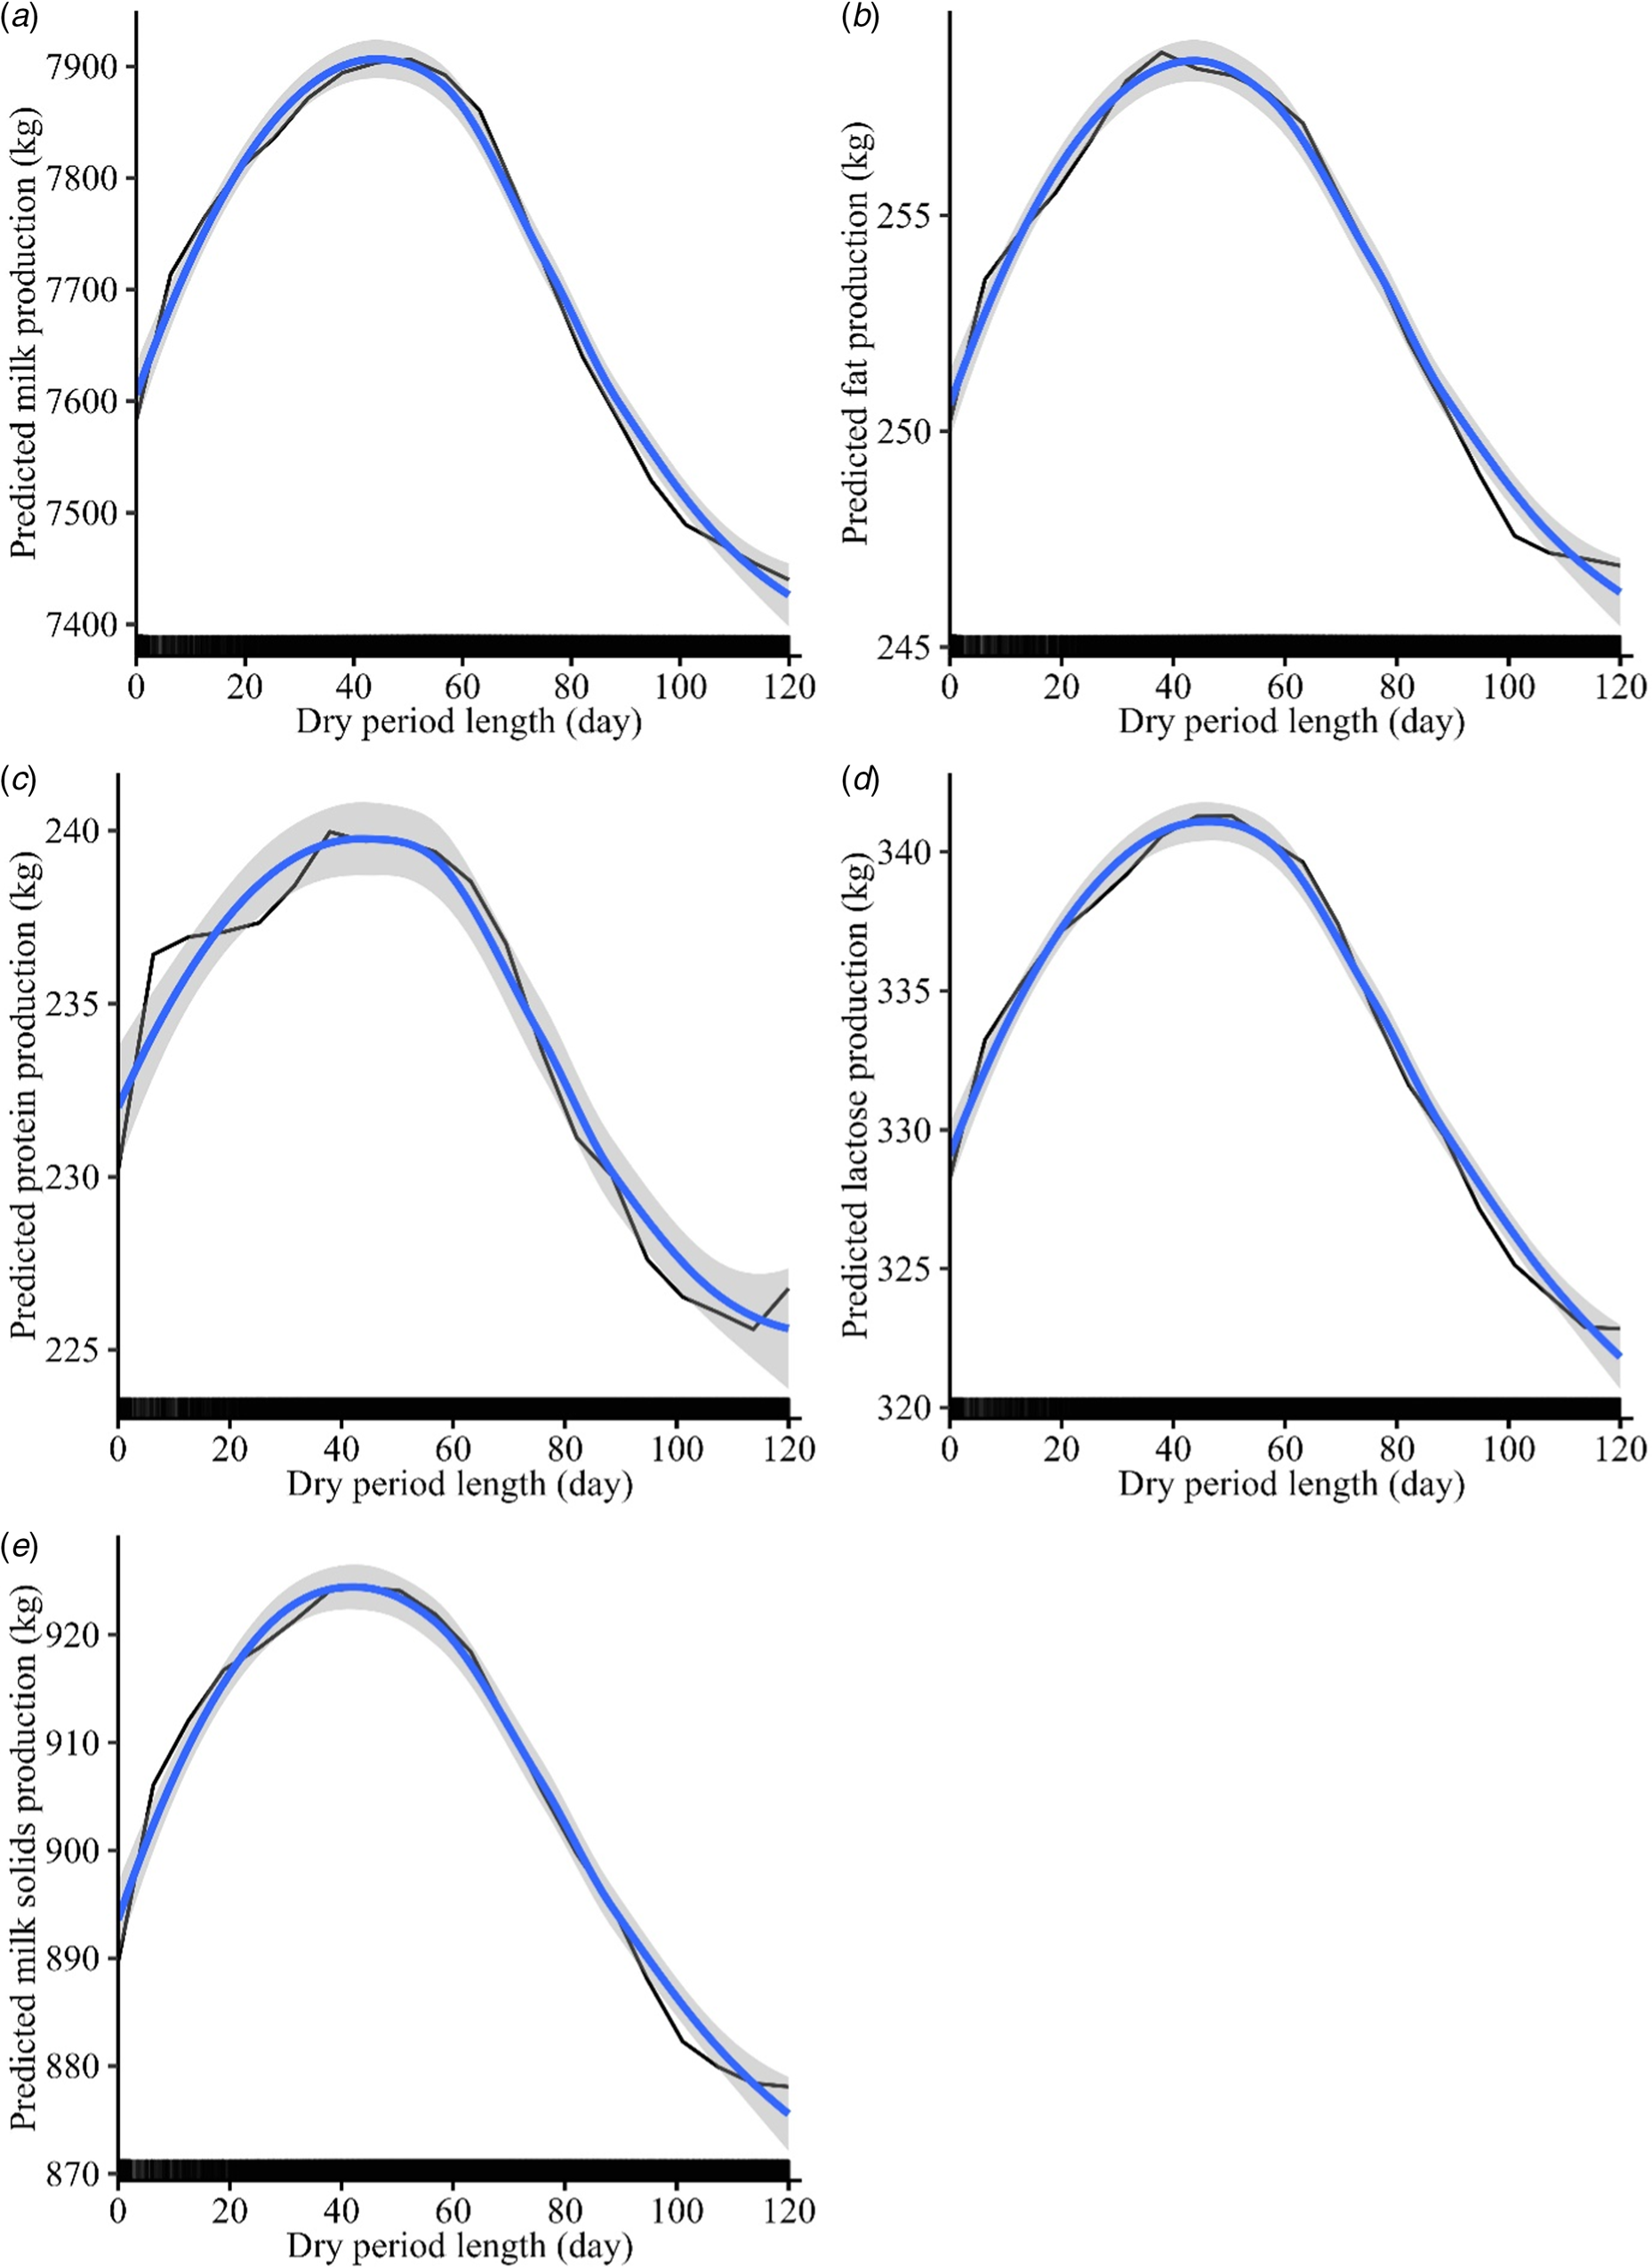
Fig. 3. Partial dependence plots depicting the relationship between dry period length and complete lactation production of milk (a), fat (b), protein (c), lactose (d), and total milk solids (e). Partial dependence is represented by the black line. A loess trend (blue line) along with the standard error (shade) was included to facilitate the interpretation of the partial dependence shape and a rug at the bottom of each plot indicates the distribution of the observations.
Discussion
A retrospective longitudinal study was carried out to evaluate the relationship between dry period length and milk production and its components in animals under tropical climate conditions. Machine learning analytical techniques were used to test the hypothesis that the length of the dry period is associated with changes in production in the subsequent lactation. Among the variables included in the analysis, dry period length was the third most important variable for all production variables evaluated. Lactation length and milking frequency were first and second, respectively. Based on the standard lactation curve of dairy cows, the longer a lactation, the higher the cumulative milk produced. In addition, the effect of increasing milking frequency on both milk production and its components are well established in the literature. Milk production increases when cows are milked three times compared with two times a day, while the opposite is observed for concentrations of fat and protein (Smith et al., Reference Smith, Ely, Graves and Gilson2002). Therefore, we expected to find the covariables lactation length and milking frequency to be important on the observed milk production and its components.
Shorter dry periods were associated with reduction in milk production in the subsequent lactation compared with the conventional 60 d. This result is consistent with the findings reported by Sørensen and Enevoldsen (Reference Sørensen and Enevoldsen1991) and Rastani et al. (Reference Rastani, Grummer, Bertics, Gümen, Wiltbank, Mashek and Schwab2005), who found that managing cows for a dry period of less than 40 d resulted in decreased milk production in the subsequent lactation compared with cows managed for a 60-d dry period. The reduced cell turnover and the secretory capacity of the mammary epithelial have been reported as the reasons for such reduction in cattle (Annen et al., Reference Annen, Collier, McGuire, Vicini, Ballam and Lormore2004b). However, the reduction varies not only between animals but also between herds (Santschi et al., Reference Santschi, Lefebvre, Cue, Girard and Pellerin2011; Safa et al., Reference Safa, Soleimani and Heravi Moussavi2013), indicating the existence of an interaction between management aspects, animal health and animal physiology. For instance, having an abortion as the starting reason of a new lactation, which would result in an unplanned short dry period, will have a negative effect on lactation productivity (Keshavarzi et al., Reference Keshavarzi, Sadeghi-Sefidmazgi, Ghorbani, Kowsar, Razmkabir and Amer2020).
The volume of milk produced is determined by the osmotic property of lactose, which explains the optimum dry period length being the same for production of both milk and lactose in our study. The synthesis of lactose is responsible for the uptake of water by the mammary alveolus (González and Noro, Reference González, Noro, González, Pinto, Zanela, Fischer and Bondan2011). The more lactose is produced, the greater the volume of water drawn into the alveolus and, consequently, the greater the volume of milk produced. Therefore, there is a positive correlation between lactose and milk volume (Haile-Mariam and Pryce, Reference Haile-Mariam and Pryce2017; Costa et al., Reference Costa, Lopez-Villalobos, Visentin, De Marchi, Cassandro and Penasa2019). Factors that change the metabolic balance of the mammary gland, such as higher than normal levels of somatic cells count, disrupt the water secretion role of lactose (Haile-Mariam and Pryce, Reference Haile-Mariam and Pryce2017) and, consequently, reduce the volume of milk produced (González and Noro, Reference González, Noro, González, Pinto, Zanela, Fischer and Bondan2011).
Reducing the dry period increases total milk production in the current lactation due to extension of the number of days in milk (Borges et al., Reference Borges, Nascimento, Simioni, Vieira and Nascimento2011). The decision of reducing the dry period should consider the trade-off between the additional milk yield in the current lactation and the reduction in the subsequent lactation. In our study, it was estimated that milk production after a zero- and a 30-d dry period were 4% (323 kg) and 1% (35 kg), respectively, lower than 50 d, which was found to be the length with the highest milk yield. Our results were lower that what was found by Teixeira et al. (Reference Teixeira, Valente, Verneque and Freitas1999), who reported a reduction of 438 and 421 kg on 305-d milk yield of cows with a dry period of 30 and 0 d compared to a more conventional 50-d dry period length under tropical climate. Studies conducted under more mild climates reported a reduction on milk yield associated with shorting the dry period ranging from 1 to 18% (Bachman and Schairer, Reference Bachman and Schairer2003; Annen et al., Reference Annen, Collier, McGuire and Vicini2004a).
The economic implication of the reduction or extension of the dry period not only depends on the volume of milk produced, but also its composition. In addition to the reduction of production associated with short dry periods, our results also indicated a negative relationship between long dry periods and milk production and its components, which is similar to what has been previously reported (Teixeira et al., Reference Teixeira, Valente, Verneque and Freitas1999; Bachman and Schairer, Reference Bachman and Schairer2003; Kuhn et al., Reference Kuhn, Hutchison J and Norman2006). No revenue is generated from milk selling while the animal is dry and an unnecessarily long dry period would have a negative impact on profitability (Delgado et al., Reference Delgado, Cue, Haine, Sewalem, Lacroix, Lefebvre, Dubuc, Bouchard and Wade2017). On the other hand, even though shortening the dry period is associated with a reduction in milk production, this might not be reflected in revenue loss. Santschi et al. (Reference Santschi, Lefebvre, Cue, Girard and Pellerin2011) reported no effect of a short dry period on energy-corrected milk, which considers not only the amount of milk produced, but also its protein and fat content that in turn dictates the selling price of the milk. This was similar to our results. Even though energy-corrected milk production was not evaluated in our study, the maximum fat and protein yields were observed on short dry periods.
Decreasing the occurrence of metabolic disorders could be a potential benefit of omitting the dry period. The transition period between pregnant non-lactating to non-pregnant lactating stage, which is when most of the metabolic disorders are more commonly observed (Østergaard and Gröhn, Reference Østergaard and Gröhn1999; LeBlanc et al., Reference LeBlanc, Lissemore, Kelton, Duffield and Leslie2006), would be eliminated if the dry period is omitted. In fact, removing the dry period was shown to improve the energy balance of the animals (van Knegsel et al., Reference van Knegsel, van der Drift, Čermáková and Kemp2013; Mayasari et al., Reference Mayasari, Chen, Ferrari, Bruckmaier, Kemp, Parmentier, van Knegsel and Trevisi2017) and to reduce the risk of ketosis (van Knegsel et al., Reference van Knegsel, van der Drift, Čermáková and Kemp2013), even though no relationship was observed with the occurrence of other diseases (van Knegsel et al., Reference van Knegsel, van der Drift, Čermáková and Kemp2013; Mayasari et al., Reference Mayasari, Chen, Ferrari, Bruckmaier, Kemp, Parmentier, van Knegsel and Trevisi2017). On the other hand, the dry period gives the opportunity to treat chronic intramammary infection by using dry-cow therapy (van Hoeij et al., Reference van Hoeij, Lam, de Koning, Steeneveld, Kemp and van Knegsel2016), which would not be possible if the dry period is omitted for all cows.
Though hot climates pose an additional challenge to animal production and reproduction (Das et al., Reference Das, Sailo, Verma, Bharti, Saikia, Imtiwati and Kumar2016), our results indicate that the association of dry period length and animal production under tropical conditions is similar to more mild climatic conditions. We found a positive parabolic relationship between dry period and milk components. For instance, Kuhn et al. (Reference Kuhn, Hutchison J and Norman2006) also reported a similar relationship when evaluating the effect of dry period length on both fat and protein production from USA farms. For both components, production was maximized when dry period length was 60 d (Kuhn et al., Reference Kuhn, Hutchison J and Norman2006). In our case, however, fat and protein production were maximized with a dry period length of 38 d.
The relatively low prediction errors of the best models in our study indicate that the variables evaluated here should be included in precision livestock systems aiming to optimize the dry period length, but other aspects should also be considered. The reduction of dry period could be an appropriate strategy for healthy high production cows (Santschi et al., Reference Santschi, Lefebvre, Cue, Girard and Pellerin2011), but it would not be appropriate for cows with low BCS or with a chronic intramammary infection (van Hoeij et al., Reference van Hoeij, Lam, de Koning, Steeneveld, Kemp and van Knegsel2016). Consequently, dry period length optimization should be carried out at animal level and considering individual cow characteristics. For instance, Kok et al. (Reference Kok, van Hoeij, Kemp and van Knegsel2021) evaluated customized dry periods based on parity number and somatic cell count before dry-off. Even though milk revenue was lower on cows with shorter dry periods, this could be financially feasible given the observed improvement on cow health. Therefore, health aspects should also be considered in the optimization of the dry period length in addition to the variables evaluated in the present study.
A limitation of our study was the use of retrospective data. Our study was conducted using data collected from commercial dairy farms, and the reasons for shorter or a longer dry periods were unknown. Abortion, a potential reason for shorter dry periods, was accounted in our analysis as this information was available, but a shorter dry period length could have occurred due to errors in conception records. On the other hand, a longer dry period could be the result of fertility issues. Such factors should be considered when comparing the production results from animals with different dry period lengths. However, using retrospective DHI data allowed for a greater number of animals to be enrolled, which is typically a limitation of traditional animal trials.
In conclusion, dry period length is associated with the production of milk and its components in the subsequent lactation of Holstein cows under tropical climatic conditions. It should not be omitted in order to maximize the dairy production under these conditions, but the optimum length depends on the production outcome evaluated. A dry period of 50 d should be used to obtain the highest volume of milk and lactose in the subsequent lactation, while a 38-d long dry period maximizes the production of both fat and protein. Lastly, a dry period of 44 d maximizes the production of total milk solids. In addition to the features evaluated in the present study, further research should focus on evaluating other animal characteristics, such as those related to animal health and reproduction, for the development of precision livestock systems to automatically determine the optimum dry period length for individual cows.
Acknowledgement
The authors would like to acknowledge the Associação dos Criadores de Gado Holandês de Minas Gerais for providing the data used in this study.


 Open access