

Between 1988 and 2010 the People’s Republic of China lifted no fewer than 680 million people out of extreme poverty, defined at the time as living on less than the equivalent of USD1.25 per day (Ndaba, Reference Ndaba2014). Paid jobs played a major role (Ali et al., Reference Ali, Bhawuk, Blustein, Bullock, Carr, Gloss and Kenny2014). Today, however, paid work globally is not a guarantee of freedom from hardship (International Labour Organisation [ILO], 2019). Most workers globally remain trapped in “working” poverty (United Nations [UN], 2019), meaning they were in employment but still struggling to pay daily bills (International Trade Union Confederation; ITUC, 2018). In China, research on working poverty has been relatively scarce (Zhou & Turvey, Reference Zhou and Turvey2015). One study found employees in China were underpaid compared to actual living costs (Zhonglin, Ying, Hao, & Zhun, Reference Zhonglin, Ying, Hao and Zhun2012). This may occur among internal migrant workers (China Labour Bulletin, 2016). Other studies have highlighted relative deprivation for Chinese workers (Leung, Lin, & Lu, Reference Leung, Lin and Lu2014) in middle income occupations (Lewin, Kenney, & Murmann, Reference Lewin, Kenney and Murmann2016).
Our study extends these diverse but interrelated strands of research in China. It attempts a replication of regional international research that has indicated a wage and income threshold, on a continuous “wage spectrum” ranging from low to medium to high wage amounts, at which employees are likely to feel free from working poverty (Carr, Parker, Arrowsmith, & Watters, Reference Carr, Parker, Arrowsmith and Watters2016) and not trapped within it (Sen, Reference Sen1999). Escape from working poverty is an important issue for all countries (United Nations, 2019). According to the Bali Declaration adopted at the 16th Asia and Pacific Regional Meeting of the International Labour Organisation (ILO China & Mongolia News, 2017), it includes sense of wage justice (ILO, 2019). Wage justice reflects quality of work life (Carr & MacLachlan, Reference Carr and MacLachlan2014). Hence, for a wage to free people from working poverty, it should be sufficient to enable a subjective sense of wage justice, meaning a fair wage, and quality of work life. This in turn may be reciprocated with organizational commitment, and may facilitate life satisfaction.
Figure 1 presents three competing theoretical linkages between wage and income on the one hand, and quality of work life on the other.
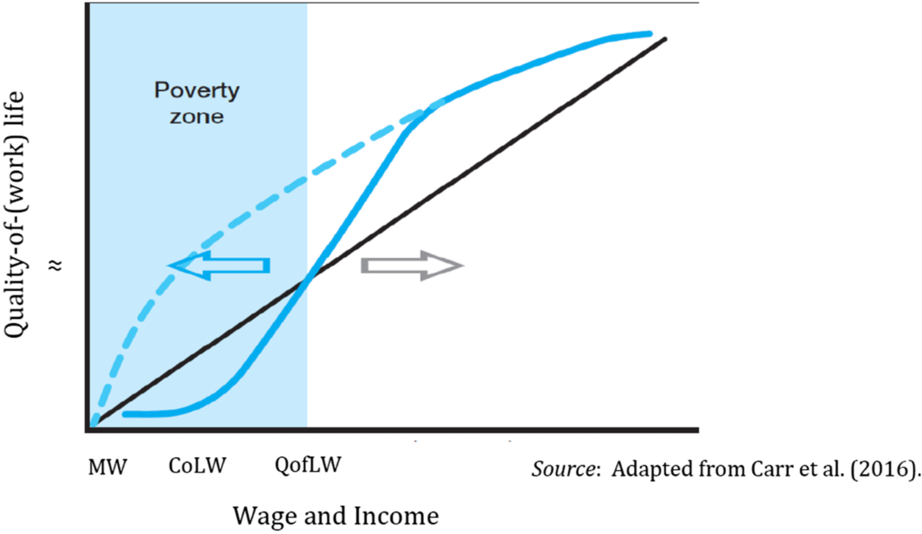
Figure 1. Quality of (work) life along the Wage and Income spectrum.
Figure 1 positions commonly used wage descriptors along a wage and income spectrum (Carr et al., Reference Carr, Maleka, Meyer, Barry, Haar, Parker and Naithani2018). Thus, the legal minimum wage (MW) is often less than the actual monetary cost-of-living wage (CoLW). This would allow people to subsist materially by meeting everyday costs of living. Beyond that point, a quality of living wage (QofLW), in living wage theory, enables a sense of wage justice at work, of reciprocal commitment to the organization, and potentially of happiness in wider life (Carr et al., Reference Carr, Parker, Arrowsmith and Watters2016). A living wage so defined, namely as enabling subjective qualities of work and life, has been proposed by the UN to be a pivotal step for escaping from working poverty (Ali et al., Reference Ali, Bhawuk, Blustein, Bullock, Carr, Gloss and Kenny2014).
However, Figure 1 makes competing theoretical predictions (Carr et al., Reference Carr, Parker, Arrowsmith and Watters2016). First, the black line predicts a linear relationship, consistent with most existing research on pay and job attitudes (Judge, Piccolo, Podsakoff, Shaw, & Rich, Reference Judge, Piccolo, Podsakoff, Shaw and Rich2010). Under this view, there is no discrete living wage cusp, but only gradual increments in quality of living in direct proportion with wages, that is, no dramatic shifts in curve gradient. Alternatively, the dotted blue line implies that even very low wages can be positive. Any wage is a good wage compared to being unemployed, for instance (Carr et al., Reference Carr, Parker, Arrowsmith and Watters2016). Third, the continuous blue line is predicting a poverty trap in the blue zone, whereby quality of (work) life as a function of income is nonlinear because employees still feel trapped below a poverty line until some living wage threshold is crossed (Kraay & McKenzie, Reference Kraay and McKenzie2014). According to this theory, only beyond a certain QofLW threshold, meaning a wage that delivers a good quality of life, beyond/to the right of the blue zone, will aspects of overall quality of life and work life such as sense of wage justice, commitment and life satisfaction simultaneously transform from generally negative (poor) to positive quality-of-(work) life (≈). There are other examples of facets of overall quality of life and work life; for example, job satisfaction and life happiness (Carr et al., Reference Carr, Parker, Arrowsmith and Watters2016). What they all share by definition, however, is an emphasis on the subjective experience of decent everyday living and work conditions (ILO China & Mongolia News, 2017). Thus, a living wage threshold is the monetary point that delivers a quality of living wage.
Crucially for this study, evidence has begun to emerge from an international network of scholars researching the linkages shown in Figure 1, under Project GLOW (2019). In two very different countries — South Africa and New Zealand — the best approximation to the actual survey (N = 900 low-income workers) data, using nonlinear regression techniques and multivariate indicators of quality of life and work life, was the dotted blue line; that is, there was a discrete wage threshold that reportedly enabled people to feel they were escaping from working poverty (Carr et al., Reference Carr, Haar, Hodgetts, Arrowsmith, Parker, Young-Hauser, Alefaio-Tuglia and Jones2019; Carr et al., Reference Carr, Maleka, Meyer, Barry, Haar, Parker and Naithani2018; Maleka et al, Reference Maleka, Carr, Raath, Schultz, Dachapalli and Ragadu2016). This threshold was significantly above the legal “minimum wage” paid by law to workers in the formal sector, and CoLW in those countries. Once past it, employees reported wage fairness (rather than unfairness) and, for example, being job happy rather than unhappy (Carr et al., Reference Carr, Haar, Hodgetts, Arrowsmith, Parker, Young-Hauser, Alefaio-Tuglia and Jones2019; Carr et al., Reference Carr, Maleka, Meyer, Barry, Haar, Parker and Naithani2018). Recently, similar findings have emerged from a GLOW study conducted using interview approaches with hospitality workers in Thailand (Yoelao, Mohan, & Sombatwattan, Reference Yoelao, Mohan and Sombatwattana2019)
However, these findings have so far been restricted to just three countries, raising the question of whether they are replicable elsewhere, or vary substantially, and on what basis? Nor did they include organizational commitment as a job attitude. The latter variable is very important because the Sustainable Development Goals (SDGs) stress “shared prosperity” (United Nations, 2019), including with organizational groups (Colquitt, Conlon, Wesson, Porter, & Ng, Reference Colquitt, Conlon, Wesson, Porter and Ng2001; Fisher, Reference Fisher2010). This can occur, for example, through reciprocated wage justice in China (Farh, Earley, & Lin, Reference Farh, Earley and Lin1997; Mossholder, Kemery, Bennett, & Wesolowski, Reference Mossholder, Kemery, Bennett and Wesolowski1998). Psychological research on workplace justice predicts that feeling that one is paid justly, including equitably compared to others with similar backgrounds and experience, will tend to enhance organizational commitment (Joseph, Wu, & Ho, Reference Joseph, Wu and Ho2012).
Organizational commitment (Allen & Meyer, Reference Allen and Meyer1990) is commonly factored into Affective (liking), Normative (duty) and Continuance (economic necessity). In a study of the links between wage justice and organizational commitment in India, the former predicted the latter; in particular, affective commitment (Biswas, Reference Biswas2015). Such findings are important for organizations, since affective commitment, like its counterpart normative commitment, is linked to performance variables such as absenteeism and turnover (Chang & Xin, Reference Chang and Xin2009; Drey, Gould, & Allan, Reference Drey, Gould and Allan2009), and to guanxi, meaning having good connectedness and networking in society (Chen & Francesco, Reference Chen and Francesco2000). This study therefore tested the relationship between wages, wage justice, and organizational commitment.
Beyond the workplace, fair pay has the potential to enhance not only quality of work life but also life-in-general, including life satisfaction (Haar, Russo, Sũne, & Ollier-Malaterre, Reference Haar, Russo, Sũne and Ollier-Malaterre2014). Consistent with such a possibility, an early study of the relationship between workplace pay and life satisfaction in the United States found that “a worker who is the sole supporter of a relatively large family [was] particularly sensitive to the economic attributes of his or her job” (George & Brief, Reference George and Brief1989, p. 212). Pay was relatively salient, and predictive of job satisfaction, when hardship was higher — through lower incomes. In Mongolia, a primary trigger for stress (vs. wellbeing) included worries about earning insufficient income for one’s household (Chuluun, Graham, & Myanganbuu, Reference Chuluun, Graham and Myanganbuu2016). Such findings suggest that pay and job satisfaction may be linked in nonlinear ways to life satisfaction (Figure 1). Life satisfaction in turn implies that wider household incomes will matter, too. This study probes these potential connections between wage and income with quality-of-work life and life satisfaction (Figure 1).
The principal research question in this study is therefore: Can we replicate the finding of a cusp in the relationship between wage and income on the one hand and quality of work and life on the other, in the People’s Republic of China? The principal hypothesis we are testing is that there will be a nonlinear relationship with a cusp, rather than a linear relationship without a cusp. The core rationale for this hypothesis is grounded in general poverty trap theory, and in particular living wage theory (Carr et al., Reference Carr, Parker, Arrowsmith and Watters2016). This predicts that only once a certain threshold is crossed will pay and income make a qualitative difference in quality of life and work life, by tending to transform both from centrally negative to positive.
To recap, the cost of living wage is the number of yuan or dollars to buy food and pay rent. A living wage delivers, in addition, a subjectively decent quality of life and work life. The minimum wage by contrast is a legal statute paid to all workers by law, in the formal sector.
Method
Participants
Drawn from urban areas of Shandong province in China’s North, 135 employees participated under conditions of informed consent and confidentiality, approved under a low-risk screening questionnaire provided by Massey University’s Human Ethics Committee. All participants were recruited by snowball. The researcher contacted relatives in China who connected with potential participants. After talking to the relatives, the researcher made sure that they understood the purpose of the study and were willing to distribute the confidential and anonymous questionnaires to their acquaintances. These consented voluntarily to take part in the research.
Demographically, respondents were female (n = 72) and male (n = 63). Modal age category was the preset response category of 41–50 years (n = 57, 42.2%), followed by 20–30 years (n = 48, 35.6%), 31–40 years (n = 20, 14.8%) and >50 years (n = 10, 7.4%). In Shandong province, the average age of employees was 30–55 years (Qian, Reference Qian2014), while the mean age of our participants was 30–50 years.
Most participants came from households with three people (two working adults, one child, from China’s One-Child Policy, n = 84 participants, 62% of the sample). Next came four-person households (n = 30, 22%), then two-person households (n = 11, 8%), then five-person households (n = 7, 5%), and finally six-person households (n = 3, 2%). Families with no children ranked second (n = 35, 26%), followed by two-child families (n = 14, 10%), and finally households with three children (n = 1, <1%).
Modal number of incomes per household was two (n = 87, 64%), matching the typical Chinese family (two parents, one child). Occupationally, laborers made up the largest percentage of participants (n = 46, 34%). Teacher was next most frequent occupation (n = 33, 24%), then government officer (n = 24, 18%), then banker (n = 15, 11%), with the remaining (n = 17, 13%) participants working in diverse “other” roles.
Measures
All instruments were administered in the language of the participants, Chinese (the full questionnaire is available from corresponding author on request).
Wages
We asked respondents to report their personal monthly living wages and their annual household income in wage brackets. This can help to partially protect privacy as well as accuracy, compared to asking for precise wage and income figures (Carr et al., Reference Carr, Haar, Hodgetts, Arrowsmith, Parker, Young-Hauser, Alefaio-Tuglia and Jones2019; Carr et al., Reference Carr, Maleka, Meyer, Barry, Haar, Parker and Naithani2018). Participants were asked to choose the corresponding answer these wage questions: “What is your personal monthly income before tax and the total monthly income after tax?” “What is your household’s total annual income before tax and the total annual income after tax?”
Organizational commitment
This was measured using Wang’s 19-item Organizational Commitment Questionnaire (Wang, Reference Wang2005). The questionnaire was developed from Allen and Meyer’s (Reference Allen and Meyer1990) Commitment Questionnaire. Unlike the Allen and Meyer (Reference Allen and Meyer1990) version, the Wang (Reference Wang2005) version of the questionnaire uses a 5-point Likert-type scale, ranging from 1 (strongly disagree) to 5 (strongly agree). The questionnaire adapted by Wang has a high level of reliability among Chinese employees (Wang, Reference Wang2005). Through principal components analysis with orthogonal rotation, three factors of organizational commitment (affective commitment, normative commitment, and continuance commitment) from Wang’s research (Reference Wang2005) had acceptable alpha coefficients of reliability=.82, .89 and .92 respectively.
Wage justice
Participants’ personal perception of wage justice was measured by a combined eight-item questionnaire, including five items from Leung, Smith, Wang, and Sun (Reference Leung, Smith, Wang and Sun1996). This instrument measures widely accepted aspects of wage justice, adapted from Moorman (Reference Moorman1991), with modifications to render the items more appropriate for Chinese settings. Leung et al. (Reference Leung, Smith, Wang and Sun1996) reconstructed this scale to capture the perceived fairness of the compensation for Chinese employees. Each of their revised eight items asked participants the degree to which they were being rewarded “fairly” when considering their educational background, work effort, and work performance compared to other employees in the organization and sector. Participants were asked to indicate whether they felt they were fairly rewarded on a five-item Likert-type scale. The 5-point scale ranged from strongly agree to strongly disagree. Reliability of this measure in China (from Leung et al., Reference Leung, Smith, Wang and Sun1996) for wage justice and fairness was high, with an alpha = .83, that is, the scale has shown acceptable reliability in China.
Life satisfaction
Life satisfaction was measured using Xiong and Xu’s (Reference Xiong and Xu2009) five-item questionnaire. This was adapted from Diener, Emmons, Larsen, and Griffin’s five-item instrument called Satisfaction with Life Scale (SWLS; Reference Diener, Emmons, Larsen and Griffin1985). The items use a 7-point Likert-type scale, ranging from 1 (strongly disagree) to 7 (strongly agree). The questionnaire was originally tested by Xiong and Xu (Reference Xiong and Xu2009) in Xinyang and Zhangqiu cities with 600 people. Cronbach’s alpha for Xiong and Xu’s (Reference Xiong and Xu2009) questionnaire was .78, indicating that the measure would be acceptably reliable in our particular context in China.
Procedure
A key concern in this research was to keep all respondents free from mental and physical danger, so before the research was undertaken, a research proposal and measurement were peer reviewed by a senior professor in Massey University’s People, Organization, Work and Employment Research (MPOWER) group and was recognized as low risk.
Online questionnaires and paper-and-pencil questionnaires were used to collect data. If the respondents did not have access to a computer and could not do the questionnaire online, they were given the paper-and-pencil questionnaire, which was printed and posted to their home after receiving their personal consent. In total, 49 questionnaires were completed online and 86 questionnaires were completed on paper.
In order to protect the confidentiality, privacy and anonymity of the participants, the questionnaires completed online were returned through personal email to the researcher. The paper-and-pencil questionnaires were sealed by the participants themselves and placed in an envelope that was provided by the researcher. Relatives did not open the envelope. Questionnaires were therefore anonymous. Participants who wanted to know the results of the aggregated data analysis left their personal email address on a separate piece of paper at the back of the questionnaire. This information was kept by the researcher’s relatives in China and later used to send summaries of the core findings. Paper versus online questionnaires made no significant difference to any of the variable scores (Hu, Reference Hu2016).
After emailing or handing back their questionnaire, each participant was given 20 RMB. The 20 RMB was not a payment but a token of appreciation for the participants’ time.
Results
Data reduction
Wages and income
To preserve statistical power, we reduced our measures of these to two key variables: personal monthly wage after tax, and household annual income after tax. Personal monthly wage before tax and annual household income before tax were not used because in China, people know their actual after-tax income (Hu, Reference Hu2016) and their after-tax wage and income are the actual money that employees receive from their organizations, so these are more salient for Chinese employees (Yuen, Reference Yuen2004).
Initially there seemed to be rather large pay ranges. Participants’ monthly take home wage ranged from <2,000 RMB (NZ$480.8) to >120,000 RMB. Annual take-home income of respondents ranged from <30,000 RMB to a high-income level of more than 300, 000 RMB. However, monthly and annual incomes of <2,000 and <30,000 RMB respectively had only one participant each and were removed from further analyses. Upper tails were longer, with 12/135 (9%) individuals earning at or above 7,000 RMB monthly and 17/135 households (13%) with incomes at/above 150,000 RMB. Hence the bulk of our sample earned between 2–6,000 RMB monthly and from 30–149,000 RMB annually.
Whether the sample represented the local population was harder to address. On one hand, the mode for monthly wage was in the 3,000s RMB, not inconsistent with a mean for Shandong province of 4,318 RMN (Statistical Portal, 2014). On the other hand, for annual household income, there were two modal bands, each n = 23 (17%), of 60–69,999 and 100–119,000 RMB. These modes may partly reflect different occupational groups in our sample, or perhaps single versus double incomes per household (see Participants above). One estimate of average annual per capita pre-tax income in Shandong (during 2016) was 64,219 RMB (CEIC, 2018). Allowing for tax and annual bonuses (Hu, Reference Hu2016), this would not be inconsistent with our own figures for single- and dual-income households respectively. Nevertheless, we could not claim to have a fully representative probability sample. As such, we did not seek to generalize beyond our sample (see Discussion).
Wage justice, organizational commitment, life satisfaction
To minimize the risk of common method variance, and to check the separability of our psychological measures, these were factor analyzed together. Because the three measures were being trialled on a relatively low-income sample, we utilized exploratory rather than confirmatory factor analysis (Carr et al., Reference Carr, Maleka, Meyer, Barry, Haar, Parker and Naithani2018).
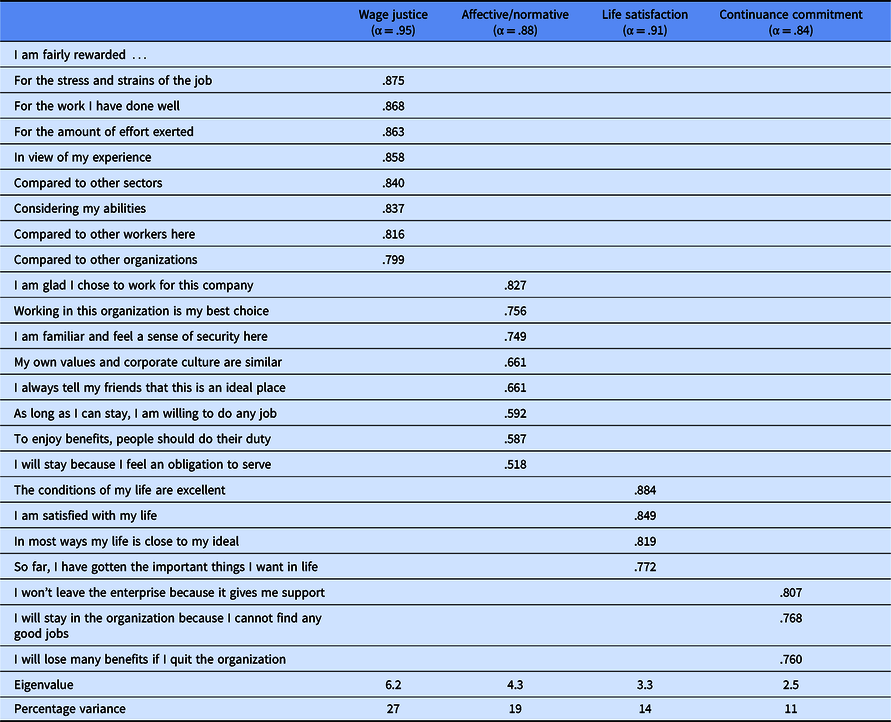
Despite a relatively small sample size and potential low power, factorability was high (KMO = .844, Bartlett’s p < .001). After removing items that failed to load or cross-load, and using orthogonal rotation to separate factors, the factor solution in Table 1 was derived. Affective and Normative commitment could not be separated and a combined joint measure was retained. The factor solution in Table 1 explained 71% of the variance, and was clear and distinctive, with negligible factor overlap (loadings <.429 suppressed). Hence, we calculated mean scores/item for each factor in Table 1. Mean scores/item were the key dependent variables.
Table 1. Factor Solution for Measures of Justice, Commitment, and Life Satisfaction
Curve estimation
Following Carr et al. (Reference Carr, Maleka, Meyer, Barry, Haar, Parker and Naithani2018), to decide between linear and nonlinear models with our localised sample, we used an exploratory technique — curve estimation, in linear and cubic models — for monthly personal pay and annual household income net after tax, inclusive of bonuses, as predictors (Table 2). Criterion variables were wage justice, affective/normative commitment, continuance commitment, and life satisfaction.
Table 2. Fit Statistics for Curve Estimations
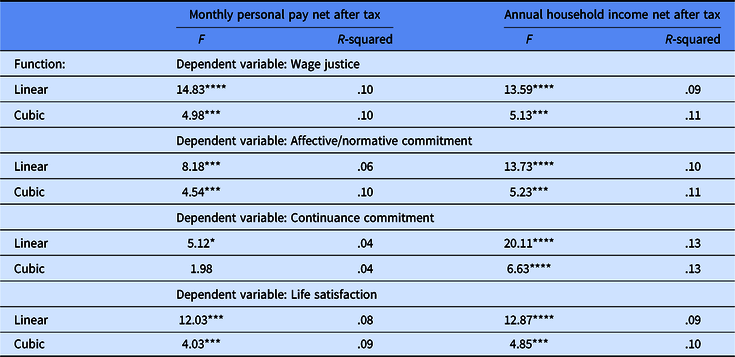
Note: *p < .05, **p < .01, ***p < .005, ****p < .001
Monthly df = 1,132 (linear), 3,130 (cubic);
Annual df = 3,131 (linear), 3,129 (cubic).
Shown in Table 2, with the exception of continuance commitment as a function of monthly personal pay (p = .12, ns), for the cubic model, all of the relationships were statistically significant, despite the relatively small sample and low statistical power. This indicated that there was in general a significant relationship between income on the one hand and our criterion variables on the other (Carr et al., Reference Carr, Maleka, Meyer, Barry, Haar, Parker and Naithani2018). However, the differences in explanatory power between the linear and cubic models were too narrow to choose one over the other, that is, between linear versus nonlinear.
In order to further address our twin research questions (i.e., to decide whether the functions were linear or nonlinear, with or without any poverty trap, and the dependent variables; see Figure 1), we utilized a nonparametric technique, LOcally Estimated Scatterplot Smoothing (LOESS). This technique is apt for small samples as it does not require high statistical power (Irizarry, Reference Irizarry2019; Jacoby, Reference Jacoby2000). Being nonparametric, it also makes few distributional assumptions. Instead, at both lower or upper tails of a distribution (see Wages and Income, above), LOESS curve estimations are more sensitive than standard curve estimation procedures to points of inflexion and cusps — they analyze the curve in sections rather than as a whole, and can thereby detect relatively subtle changes in gradient even in small samples (Jacoby, Reference Jacoby2000, p. 583). These properties combined may help offset any concerns with statistical power in smaller samples (such as ours). LOESS analysis can thereby be used to detect not only whether a relationship is linear or nonlinear, but also whether it has multiple points of inflexion (as in the S-shaped dotted line, a poverty trap, shown in Figure 1). For our estimations, the tension parameter was set to .50 to produce a curve that was as smooth as possible (Jacoby, Reference Jacoby2000). Kernel function was the default in SPSS, that is, the Epanechnikov kernel.
The results are shown in Figure 2 (monthly wage left, annual household income right). As in previous research (Carr et al., Reference Carr, Haar, Hodgetts, Arrowsmith, Parker, Young-Hauser, Alefaio-Tuglia and Jones2019), our main focus was exploring the possibility of replicating the lower end of the pay spectrum sampled, not its upper tail.

Figure 2. Wage justice, organizational commitment, life satisfaction as functions of monthly personal wage after tax (monthlyafter), and annual household income after tax (annualafter).
Independently of whether the predictor variable was personal monthly wage or monthly household income, and regardless of whether the dependent variable was wage justice, organizational commitment, or life satisfaction, the shape of the function was visually, from Figure 1, quite consistent. It was neither simply linear (straight lines in Figure 1), nor was it solely diminishing marginal returns from the base of the wage spectrum (blue line in Figure 1). The cubic model provided an approximation (dashed line in Figure 2). However, the finer-grained analysis using LOESS revealed a shape more akin to the dotted line (in Figure 1), consistently indicating a living wage threshold.
Discussion
The major finding in this study was that we were able to replicate the preliminary findings from South Africa, New Zealand and Thailand of a living wage threshold. First, the link between wage and quality of work life was nonlinear. Second, at lower wages and incomes, quality of life and work life, for our relatively localised sample of workers in China, made no discernible difference to these criterion variables. These variables are associated in the wider literature with subjective wellbeing and organizational benefits. However, beyond the same pay and income threshold there were clear and consistent upticks on these variables. This pattern of findings thus supports previous research on living wages and is consistent with both poverty trap and living wage theories (Carr et al., Reference Carr, Parker, Arrowsmith and Watters2016).
Was there a living wage threshold (as depicted by the dotted line in Figure 1)? From Figure 2, yes, there was. The LOESS curves largely began with a relatively flat section of curve, suggestive of a poverty trap (Carr et al., Reference Carr, Parker, Arrowsmith and Watters2016). Thereafter, the curves visibly rose relatively sharply, reaching mini-peaks once monthly personal wage reached 4–5,000 RMB monthly personal wage, and household annual income midway between 80Ks and 90Ks, that is, an average of 90K RMB per annum approximately, or, divided by 12, 75K RMB per month — that is, almost double the personal monthly wage. Crucially, this monetary threshold on the x-axis corresponded with crossing the neutral point on the dependent variables (i.e., on the y-axis) from wage injustice to justice, lack of commitment to commitment, and life dissatisfaction to satisfaction. Thus, at a relatively localized level inside China, we replicated previous international findings of a cusp.
Second, we asked on what dependent variables was the living wage manifested. On all of the dependent variables in Table 2, there was a visible mini-peak for all of the variables measured, spanning personal monthly wage and annual household income; as well as wage justice, organizational commitment, and life satisfaction. The peaks and troughs visible in Figure 2, though, were also more discernibly flat at the beginning and somewhat more visibly cusped thereafter for personal wage as compared to household income. This indicated that the poverty trap was more salient for participants at an individual level than at the level of household unit. In retrospect, we might have expected individual wage to be more salient for individuals than household income, a group-level variable (Ajzen, Reference Ajzen2011). The finding was at least consistent with recent research from New Zealand, which found that household income acted as a buffer for individual wage, moderating statistically significant linkages between the latter and individual job attitudes (Carr et al., Reference Carr, Haar, Hodgetts, Arrowsmith, Parker, Young-Hauser, Alefaio-Tuglia and Jones2019).
Like the addition of household incomes, the inclusion of organizational commitment in the current study’s list of dependent variables implies and recognizes the importance of building shared prosperity (United Nations, 2019). This inclusion of organizational commitment as a dependent variable was a novel, if tentative, contribution to the literature.
Since our study was conducted, others have also calculated a living wage figure in China. A largely cost-of-living-based estimation of a living wage in urban Shanghai during 2015–16 (when our data too were collected; Hu, Reference Hu2016) was a monthly personal wage of 4,136 RMB. This was based on an urban household of 3.5 people, 1.78 workers (Global Living Wage Coalition, 2015). The figure included mandatory deductions such as tax. Recalibrating to a living wage net of mandatory deductions (as in our data, via tax), the figure that is comparable to ours would be RMB 3,702 monthly. This estimate is lower than our estimate of 4.5K monthly per personal wage (net, after tax). To that extent, any largely costs of living wage estimates of a living wage (CoLW, in Figure 1) may not fully capture subjective quality of living (QofLW, Figure 1).
The overarching aim of this study was not generalization but replication, at a relatively localized level (Gergen, Reference Gergen1973). Of course, this initial study of living wages in the People’s Republic of China has many ways in which it could be improved, and extended. Most obviously, a larger and likely more representative probability sample, the inclusion of time as a key variable to enable inferences about causation in addition to association, and the expansion of measures to include actual performance and evaluation of living wage interventions would all expand the focus, relevance, and applied impact of the research. A larger sample would also power the confidence required for tests of mediation; for example, of links between wage and life satisfaction by sense of wage justice (Fiske, Kenny, & Taylor, Reference Fiske, Kenny and Taylor1982). Such developments are in fact already planned and underway as part of the interdisciplinary, international, intergenerational and longitudinal study of living wages in Project GLOW, which ultimately aims to provide reliable, representative and replicable evidence on the psychology of living wages and decent work under the SDGs (http://projectglow.net).
Acknowledgement
This paper is based on a Massey University master’s thesis by Yuting Hu (Reference Hu2016), “Is there a ‘living wage’ that boosts sense of distributive justice and links to organizational commitment? A field study from the People’s Republic of China.” The authors wish to thank Professors Jarrod Haar and Fiona Alpass for their constructive and helpful comments and feedback on an earlier version of this manuscript. We would particularly like to thank our peer reviewers and action editor for constructive and helpful feedback, significant improvements and inputs to several earlier versions of this paper. These have transformed the paper and the clarity of its contribution. Xie xie to all our participants who have kindly shared their data with us all.


 Open access