


1. Introduction
Buoyant convection and rotational influence through Coriolis acceleration are two principal features of fluid flows encountered in geophysics and astrophysics. A popular model system to study buoyant convective flows is Rayleigh–Bénard convection (RBC): a horizontal layer of fluid sandwiched between two parallel plates where the bottom plate is at a higher temperature than the top plate. With the inclusion of background rotation about a vertical axis, the problem of rotating Rayleigh–Bénard convection (RRBC) encompasses the principal actors, convection and rotation, in a simple, mathematically well-defined system amenable to experimental, numerical and analytical investigation. The interplay of convection and rotation is often studied in the RRBC context (Stevens, Clercx & Lohse Reference Stevens, Clercx and Lohse2013a; Kunnen Reference Kunnen2021; Ecke & Shishkina Reference Ecke and Shishkina2023), which in itself has so far presented a wide variety of possible flow states without invoking additional complexities that may be encountered in geophysical and astrophysical flows such as magnetic fields, strong non-Oberbeck–Boussinesq effects, spherical geometries, and more (e.g. Jones Reference Jones2011; Glatzmaier Reference Glatzmaier2014; Aurnou et al. Reference Aurnou, Calkins, Cheng, Julien, King, Nieves, Soderlund and Stellmach2015; Schumacher & Sreenivasan Reference Schumacher and Sreenivasan2020).
A property shared by the majority of geophysical and astrophysical flows is that they are characterised by large Reynolds numbers (ratio of inertial to viscous forces) and at the same time small Rossby numbers (ratio of inertial to Coriolis forces). We thus expect turbulent convective flow with a strong rotational constraint. In recent RRBC investigations, it was found that rotation-dominated convection – named the geostrophic regime after the dominant balance between Coriolis force and pressure gradient – displays an interesting subdivision into various realisable flow phenomenologies, each with specific scalings of descriptive statistical quantities like the efficiency of convective heat transfer (e.g. Sprague et al. Reference Sprague, Julien, Knobloch and Werne2006; Julien et al. Reference Julien, Rubio, Grooms and Knobloch2012b; Ecke & Niemela Reference Ecke and Niemela2014; Stellmach et al. Reference Stellmach, Lischper, Julien, Vasil, Cheng, Ribeiro, King and Aurnou2014; Cheng et al. Reference Cheng, Stellmach, Ribeiro, Grannan, King and Aurnou2015, Reference Cheng, Madonia, Aguirre Guzmán and Kunnen2020; Lu et al. Reference Lu, Ding, Shi, Xia and Zhong2021; Madonia et al. Reference Madonia, Aguirre Guzmán, Clercx and Kunnen2021), which was reviewed recently in Kunnen (Reference Kunnen2021) and Ecke & Shishkina (Reference Ecke and Shishkina2023). Starting from onset of convection, with increasing strength of buoyant forcing, one expects to encounter cellular convection, convective Taylor columns (CTCs), plumes and geostrophic turbulence (GT), showing step by step a decreasing rotational constraint (Sprague et al. Reference Sprague, Julien, Knobloch and Werne2006; Julien et al. Reference Julien, Rubio, Grooms and Knobloch2012b; Kunnen Reference Kunnen2021; Aguirre Guzmán et al. Reference Aguirre Guzmán, Madonia, Cheng, Ostilla-Mónico, Clercx and Kunnen2022). From our prior heat transfer and temperature measurements (Cheng et al. Reference Cheng, Madonia, Aguirre Guzmán and Kunnen2020), we could identify an additional transitional state, rotation-influenced turbulence (RIT), that requires further description.
Getting to the geostrophic regime requires dedicated tools: large-scale experimental set-ups (e.g. Ecke & Niemela Reference Ecke and Niemela2014; Cheng et al. Reference Cheng, Stellmach, Ribeiro, Grannan, King and Aurnou2015, Reference Cheng, Aurnou, Julien and Kunnen2018, Reference Cheng, Madonia, Aguirre Guzmán and Kunnen2020; Hawkins Reference Hawkins2020; Lu et al. Reference Lu, Ding, Shi, Xia and Zhong2021; Hawkins et al. Reference Hawkins, Cheng, Abbate, Pilegard, Stellmach, Julien and Aurnou2023), direct numerical simulations (DNS) on fine meshes (e.g. Stellmach et al. Reference Stellmach, Lischper, Julien, Vasil, Cheng, Ribeiro, King and Aurnou2014; Aguirre Guzmán et al. Reference Aguirre Guzmán, Madonia, Cheng, Ostilla-Mónico, Clercx and Kunnen2020) or asymptotically reduced modelling (e.g. Sprague et al. Reference Sprague, Julien, Knobloch and Werne2006; Julien et al. Reference Julien, Rubio, Grooms and Knobloch2012b; Maffei et al. Reference Maffei, Krouss, Julien and Calkins2021). A complicating factor for experiments in particular is that at the confining sidewall, a prominent mode of convection is formed, named the wall mode, boundary zonal flow or sidewall circulation (Favier & Knobloch Reference Favier and Knobloch2020; de Wit et al. Reference de Wit, Aguirre Guzmán, Madonia, Cheng, Clercx and Kunnen2020; Zhang et al. Reference Zhang, van Gils, Horn, Wedi, Zwirner, Ahlers, Ecke, Weiss, Bodenschatz and Shishkina2020; Lu et al. Reference Lu, Ding, Shi, Xia and Zhong2021; Zhang, Ecke & Shishkina Reference Zhang, Ecke and Shishkina2021; Ecke, Zhang & Shishkina Reference Ecke, Zhang and Shishkina2022; Wedi et al. Reference Wedi, Moturi, Funfschilling and Weiss2022). This convection mode is the first to become unstable to buoyant forcing, before bulk convection (e.g. Zhang & Liao Reference Zhang and Liao2009), and was found unexpectedly to persist deep into the turbulent regimes (Madonia et al. Reference Madonia, Aguirre Guzmán, Clercx and Kunnen2021). This complicates the interpretation of results on global flow properties (like the efficiency of convective heat transfer) and their comparison to studies without lateral confinement (i.e. simulations on domains with periodic boundary conditions).
The difficulty of entering the geostrophic regime, particularly for experiments and DNS, leaves it scarcely studied with many open questions remaining, particularly considering the statistical description of this turbulent flow from velocity measurements. Here, we contribute flow measurements from our dedicated experimental setup TROCONVEX (Cheng et al. Reference Cheng, Aurnou, Julien and Kunnen2018, Reference Cheng, Madonia, Aguirre Guzmán and Kunnen2020; Madonia et al. Reference Madonia, Aguirre Guzmán, Clercx and Kunnen2021). At a constant rotation rate, we choose different strengths of buoyant forcing to scan the subranges of the geostrophic regime. We quantify the strength of turbulence in terms of the Reynolds number, and compute kinetic energy spectra to identify the distribution of energy over the spatial scales.
The remainder of this paper is organised as follows. In § 2, we introduce the dimensionless input and output parameters of RRBC, and list proposed scaling arguments for the Reynolds number. Then the experimental methods are explained in § 3. Results on the measured Reynolds numbers are given in § 4, along with a test of the scaling arguments and a comparison to literature data. In § 5, we plot and discuss the computed kinetic energy spectra. We present our conclusions in § 6.
2. Theoretical background
We will first define the dimensionless input and output parameters of RRBC in § 2.1. Then the effects of rotation on the stability of convective flow are treated in § 2.2. In § 2.3, we discuss scaling arguments for the Reynolds number proposed in the literature.
2.1. Input and output parameters
Three dimensionless input parameters are required to describe the flow state. The Rayleigh number  $Ra$ expresses the ratio of thermal forcing to dissipation, the Ekman number $Ek$ is the ratio of viscous to Coriolis forces, and the Prandtl number $Pr$ describes the diffusive properties of the fluid. These quantities are defined as
 \begin{equation} Ra=\frac{g\alpha\,{\rm \Delta} T\,H^3}{\nu\kappa} , \quad Ek=\frac{\nu}{2\varOmega H^2} \quad Pr=\frac{\nu}{\kappa},\end{equation}
where  $g$ is gravitational acceleration, ${\rm \Delta} T$ the applied temperature difference between the plates and $H$ is their vertical separation, $\varOmega$ is the rotation rate, and $\alpha$, $\nu$ and $\kappa$ are the thermal expansion coefficient, kinematic viscosity and thermal diffusivity of the fluid, respectively. A related parameter that has been used frequently to give an a priori indication of the relative importance of buoyant forcing to Coriolis forces (see e.g. Stevens et al. Reference Stevens, Clercx and Lohse2013a; Aurnou, Horn & Julien Reference Aurnou, Horn and Julien2020; Kunnen Reference Kunnen2021; Ecke & Shishkina Reference Ecke and Shishkina2023) is the so-called convective Rossby number
 \begin{equation} Ro_c=\frac{U_{ff}}{2\varOmega H}=Ek\sqrt{\frac{Ra}{Pr}} , \end{equation}
where the free-fall velocity  $U_{ff}=\sqrt {g\alpha \,{\rm \Delta} T\,H}$ indicates the maximum flow speed that could develop in this convection system.
Two prominent output parameters are the Nusselt number  $Nu$ and the Reynolds number $Re$, which indicate the efficiency of convective heat transfer and momentum transfer, respectively. The Nusselt number is defined as
 \begin{equation} Nu=\frac{q}{q_{cond}}=\frac{qH}{\lambda\,{\rm \Delta} T}. \end{equation}
The total heat flux  $q$ (convection and conduction) is normalized by the conductive flux $q_{cond}=\lambda \,{\rm \Delta} T/H$, with $\lambda$ the thermal conductivity of the fluid. In the absence of convection (a quiescent fluid), $q=q_{cond}$ and $Nu=1$; when convection sets in, $q>q_{cond}$ and $Nu>1$. In our current configuration, with gravity pointing downwards, the total heat flux can be expressed as
 \begin{equation} q=\frac{\lambda}{\kappa}\,\langle w T \rangle - \lambda\left\langle \frac{\partial T}{\partial z}\right\rangle,\end{equation}
where  $z$ is the vertical coordinate pointing upwards, counter to gravity, and $w$ is the vertical component of velocity. Angular brackets $\langle \,\cdot\, \rangle$ denote a suitable average, either a cross-sectional plane average at a certain height $z$, or a volume average over the flow domain. The Reynolds number
 \begin{equation} Re=\frac{UH}{\nu} \end{equation}
introduces a characteristic velocity scale  $U$, usually taken to be the root-mean-square (r.m.s.) velocity. The ultimate goal is to understand how $Nu$ and $Re$ depend on the input parameters $Ra$,
$Ra$,  $Pr$ and $Ek$. Power-law scaling relations are expected (e.g. Julien et al. Reference Julien, Knobloch, Rubio and Vasil2012a; King, Stellmach & Buffett Reference King, Stellmach and Buffett2013; Maffei et al. Reference Maffei, Krouss, Julien and Calkins2021). For non-rotating convection, the phenomenological theory developed by Grossmann & Lohse (Reference Grossmann and Lohse2000, Reference Grossmann and Lohse2001, Reference Grossmann and Lohse2002, Reference Grossmann and Lohse2004) (see also Ahlers, Grossmann & Lohse Reference Ahlers, Grossmann and Lohse2009; Stevens et al. Reference Stevens, van der Poel, Grossmann and Lohse2013b) has been very successful in explaining the $Nu(Ra,Pr)$ and $Re(Ra,Pr)$ relations.
2.2. Stabilisation of convection by rotation
Rotation tends to stabilise convection. For  $Pr>0.68$ and at asymptotically small $Ek\rightarrow 0$, linear stability theory (Chandrasekhar Reference Chandrasekhar1961; Niiler & Bisshopp Reference Niiler and Bisshopp1965) predicts the critical Rayleigh number $Ra_C$ for onset of convection, and the characteristic horizontal size $\ell _C$ of convection near onset (half the most unstable wavelength), as
 \begin{equation} Ra_C=8.70\,Ek^{-4/3} , \quad \ell_C/H=2.41\,Ek^{1/3}.\end{equation}
(The onset of convection for  $Pr<0.68$ behaves differently (Chandrasekhar Reference Chandrasekhar1961; Aurnou et al. Reference Aurnou, Bertin, Grannan, Horn and Vogt2018); it is out of scope for the current investigation.) Due to this stabilising effect, it is insightful to also consider the degree of supercriticality $Ra/Ra_C$ to get a first impression of the intensity of convection. These asymptotic formulations are accurate for this work given the small applied $Ek$.
$Ek$.
2.3. Reynolds number scaling in rotating convection
Several scaling relations for the Reynolds number have been proposed for RRBC flow. They are based on balancing terms in the governing Navier–Stokes equation for an incompressible Oberbeck–Boussinesq fluid, which is (e.g. Chandrasekhar Reference Chandrasekhar1961)
 \begin{equation} \frac{\partial\boldsymbol{u}}{\partial t}+(\boldsymbol{u}\boldsymbol{\cdot}\boldsymbol{\nabla})\boldsymbol{u}=-\boldsymbol{\nabla} p -2\varOmega\hat{\boldsymbol{z}}\times\boldsymbol{u} + \nu\,\nabla^2 \boldsymbol{u} + g\alpha T \hat{\boldsymbol{z}} ,\quad \boldsymbol{\nabla}\boldsymbol{\cdot}\boldsymbol{u}=0 . \end{equation}
This equation describes the evolution of velocity  $\boldsymbol {u}$ as a function of time $t$, where $p$ is the reduced pressure (e.g. Greenspan Reference Greenspan1968; Kundu & Cohen Reference Kundu and Cohen2002) and $T$ is temperature; $\hat {\boldsymbol {z}}$ is the vertical unit vector pointing upwards, counter to gravity. Centrifugal buoyancy is excluded here (Horn & Aurnou Reference Horn and Aurnou2018, Reference Horn and Aurnou2019). The equation for vorticity $\boldsymbol {\omega }=\boldsymbol {\nabla }\times \boldsymbol {u}$ is also invoked in these scaling arguments:
 \begin{equation} \frac{\partial\boldsymbol{\omega}}{\partial t}+(\boldsymbol{u}\boldsymbol{\cdot}\boldsymbol{\nabla}) \boldsymbol{\omega}=(\boldsymbol{\omega}\boldsymbol{\cdot}\boldsymbol{\nabla})\boldsymbol{u}+2\varOmega\,\frac{\partial\boldsymbol{u}}{\partial z}+\nu\,\nabla^2\boldsymbol{\omega} - g\alpha\hat{\boldsymbol{z}}\times \boldsymbol{\nabla} T . \end{equation}
 One proposed scaling relation balances the viscous, buoyancy and Coriolis terms into the so-called viscous–Archimedean–Coriolis (VAC) balance (Aubert et al. Reference Aubert, Brito, Nataf, Cardin and Masson2001; Gillet & Jones Reference Gillet and Jones2006; King et al. Reference King, Stellmach and Buffett2013). First, we recall the exact global balance of energy (viscous dissipation equals buoyant production) that can be found by averaging the energy equation  $\boldsymbol {u}\boldsymbol {\cdot }$ (2.7) over the flow domain (Shraiman & Siggia Reference Shraiman and Siggia1990; Grossmann & Lohse Reference Grossmann and Lohse2000; Ahlers et al. Reference Ahlers, Grossmann and Lohse2009):
 \begin{equation} \nu\langle (\boldsymbol{\nabla}\boldsymbol{u})^2\rangle _V=g\alpha\langle wT\rangle _V=\frac{\nu^3}{H^4}\,\frac{Ra\,(Nu-1)}{Pr^2},\end{equation}
where  $\langle \,\cdot\, \rangle _V$ denotes a volume average. For modest convection, geostrophy and the Taylor–Proudman theorem are considered to be broken by viscosity acting on small horizontal scales. The balance of viscous and Coriolis terms in the vorticity equation is scaled by recognising that vertical derivatives $\partial /\partial z$ scale as $1/H$, and horizontal derivatives $\partial /\partial x$ and $\partial /\partial y$ scale as $1/\ell$, where $\ell \ll H$ is the horizontal scale of convection:
 \begin{equation} 2\varOmega\,\frac{\partial\boldsymbol{u}}{\partial z}\sim \nu\, \nabla^2\boldsymbol{\omega} \rightarrow 2\varOmega\,\frac{U}{H}\sim\nu\,\frac{U}{\ell^3} \rightarrow \frac{\ell}{H}\sim\left(\frac{\nu}{2\varOmega H^2}\right)^{1/3}=Ek^{1/3} .\end{equation}
We recover the scaling of the onset length scale  $\ell _C$ of (2.6a,b), which is a consequence of this VAC force balance. Using $\boldsymbol {\nabla }\sim 1/\ell$ (i.e. dominated by the horizontal derivatives), we can scale the first term in (2.9) as $\nu U^2/\ell ^2$, then, using (2.10), rewrite it in terms of the Reynolds number as
 \begin{equation} \nu\,\frac{U^2}{\ell^2}\sim\frac{\nu^3}{H^4}\,\frac{Ra\,(Nu-1)}{Pr^2} \rightarrow Re_{VAC}\sim \frac{Ra^{1/2}\,Ek^{1/3}\,(Nu-1)^{1/2}}{Pr}.\end{equation}
A second proposed scaling is built on a balance of Coriolis–inertial–Archimedean (CIA) forces (Ingersoll & Pollard Reference Ingersoll and Pollard1982; Aubert et al. Reference Aubert, Brito, Nataf, Cardin and Masson2001; Jones Reference Jones2011; Guervilly, Cardin & Schaeffer Reference Guervilly, Cardin and Schaeffer2019; Aurnou et al. Reference Aurnou, Horn and Julien2020). For a fully turbulent flow, effects of viscosity are negligible at larger length scales, and Coriolis and inertial forces are balanced in the vorticity equation
 \begin{equation} 2\varOmega\,\frac{\partial\boldsymbol{u}}{\partial z}\sim (\boldsymbol{u}\boldsymbol{\cdot}\boldsymbol{\nabla})\boldsymbol{\omega} \rightarrow 2\varOmega\,\frac{U}{H}\sim\frac{U^2}{\ell^2} \rightarrow \frac{\ell}{H}\sim\left(\frac{U}{2\varOmega H}\right)^{1/2}=Ro^{1/2},\end{equation}
where the horizontal length scale  $\ell$ now scales as the square root of the Rossby number $Ro=U/(2\varOmega H)$ based on the velocity scale $U$ (Guervilly et al. Reference Guervilly, Cardin and Schaeffer2019). Then inertia and buoyancy are balanced in the energy equation
 \begin{equation} \boldsymbol{u}\boldsymbol{\cdot}((\boldsymbol{u}\boldsymbol{\cdot}\boldsymbol{\nabla})\boldsymbol{u}) \sim g\alpha\boldsymbol{u}\boldsymbol{\cdot}(T\hat{\boldsymbol{z}}) \rightarrow \frac{U^3}{\ell}\sim \frac{\nu^3}{H^4}\,\frac{Ra\,(Nu-1)}{Pr^2},\end{equation}
where (2.9) has been used, invoking a volume average. The final scaling relation, combining (2.12) and (2.13), can be rewritten in terms of  $Re$ as
 \begin{equation} Re_{CIA}\sim\frac{Ra^{2/5}\,Ek^{1/5}\,(Nu-1)^{2/5}}{Pr^{4/5}}.\end{equation}
 What remains to be determined is the dependence of the Nusselt number  $Nu$ on the input parameters. For rotating convection, this relation is far from complete, with a variety of subregimes opening up in the geostrophic regime based on recent numerical and experimental evidence (Sprague et al. Reference Sprague, Julien, Knobloch and Werne2006; Julien et al. Reference Julien, Rubio, Grooms and Knobloch2012b; Ecke & Niemela Reference Ecke and Niemela2014; Cheng et al. Reference Cheng, Stellmach, Ribeiro, Grannan, King and Aurnou2015, Reference Cheng, Aurnou, Julien and Kunnen2018, Reference Cheng, Madonia, Aguirre Guzmán and Kunnen2020; Kunnen Reference Kunnen2021; Lu et al. Reference Lu, Ding, Shi, Xia and Zhong2021). Two theoretical scalings have been proposed.
The first scaling (Boubnov & Golitsyn Reference Boubnov and Golitsyn1990; King et al. Reference King, Stellmach, Noir, Hansen and Aurnou2009; King, Stellmach & Aurnou Reference King, Stellmach and Aurnou2012) is a rotating equivalent of Malkus's marginal stability argument for the thermal boundary layer (Malkus Reference Malkus1954): the Rayleigh number  $Ra_\delta$ based on the thickness $\delta$ of the thermal boundary layer exceeds its critical value $Ra_{\delta,C}\sim Ek_\delta ^{-4/3}$ with an Ekman number also based on $\delta$. With the assumption of a temperature drop ${\rm \Delta} T_\delta \sim {\rm \Delta} T$ over a thermal boundary layer that is purely conductive ( $q\sim \lambda\,{\rm \Delta} T/\delta$), King et al. (Reference King, Stellmach, Noir, Hansen and Aurnou2009, Reference King, Stellmach and Aurnou2012) find
 \begin{equation} Nu\sim\left(\frac{Ra}{Ra_C}\right)^3\sim Ra^3\,Ek^4 . \end{equation}
This scaling relation was also derived by Boubnov & Golitsyn (Reference Boubnov and Golitsyn1990) based on measurements of the vertical mean temperature profile.
The second scaling relation is a rotating equivalent of Spiegel's argument that under vigorously turbulent conditions, the heat flux  $q$ should become independent of the diffusive fluid properties $\nu$ and $\kappa$ (Spiegel Reference Spiegel1971). Stevenson (Reference Stevenson1979) and Julien et al. (Reference Julien, Knobloch, Rubio and Vasil2012a) show that if rotation is included, the only combination of parameters leading to diffusion-free total heat flux $q$ is
 \begin{equation} Nu-1\sim \frac{Ra^{3/2}\,Ek^2}{Pr^{1/2}}.\end{equation}
Numerical and experimental evidence points towards the asymptotic validity of the latter scaling (2.16) (Julien et al. Reference Julien, Knobloch, Rubio and Vasil2012a; Stellmach et al. Reference Stellmach, Lischper, Julien, Vasil, Cheng, Ribeiro, King and Aurnou2014; Bouillaut et al. Reference Bouillaut, Miquel, Julien, Aumaître and Gallet2021), although the presence of no-slip walls (Stellmach et al. Reference Stellmach, Lischper, Julien, Vasil, Cheng, Ribeiro, King and Aurnou2014; Kunnen et al. Reference Kunnen, Ostilla-Mónico, van der Poel, Verzicco and Lohse2016; Plumley et al. Reference Plumley, Julien, Marti and Stellmach2017; Aguirre Guzmán et al. Reference Aguirre Guzmán, Madonia, Cheng, Ostilla-Mónico, Clercx and Kunnen2021) and the significant heat flux contribution of the wall mode near sidewalls in confined convection (Favier & Knobloch Reference Favier and Knobloch2020; de Wit et al. Reference de Wit, Aguirre Guzmán, Madonia, Cheng, Clercx and Kunnen2020; Zhang et al. Reference Zhang, van Gils, Horn, Wedi, Zwirner, Ahlers, Ecke, Weiss, Bodenschatz and Shishkina2020, Reference Zhang, Ecke and Shishkina2021; Lu et al. Reference Lu, Ding, Shi, Xia and Zhong2021; Ecke et al. Reference Ecke, Zhang and Shishkina2022) preclude observation of the pure scaling law.
Upon insertion of (2.16) into (2.14), we obtain in dimensionless and dimensional form that
 \begin{equation} Re\sim \frac{Ra\,Ek}{Pr} \rightarrow U\sim\frac{g\alpha\,{\rm \Delta} T}{2\varOmega},\end{equation}
i.e. the velocity scale  $U$ is now also diffusion-free (Aurnou et al. Reference Aurnou, Horn and Julien2020).
3. Experimental methods
The experimental set-up used for this study is TROCONVEX, a large-scale rotating convection apparatus designed for the study of the geostrophic regime of convection. The design considerations with regard to the accessible parameter range for a given set-up have been discussed in detail in Cheng et al. (Reference Cheng, Aurnou, Julien and Kunnen2018). Details on the set-up for heat transfer measurements are given in Cheng et al. (Reference Cheng, Madonia, Aguirre Guzmán and Kunnen2020). Here, we perform optical flow measurements using stereoscopic particle image velocimetry (stereo-PIV; Prasad Reference Prasad2000; Raffel et al. Reference Raffel, Willert, Wereley and Kompenhans2007). The arrangement has been explained in Madonia et al. (Reference Madonia, Aguirre Guzmán, Clercx and Kunnen2021); here, we repeat the most important parts.
The convection cell is an upright cylinder of height  $H=2\ \mathrm {m}$ and radius $R=0.195\ \mathrm {m}$ filled with water. Its diameter-to-height aspect ratio is $\varGamma =2R/H=0.195$. The bottom plate is made of copper and is heated electrically to be at a controlled temperature $T_b$. Likewise, the temperature of the copper top plate, equipped with a double-spiral groove for cooling liquid circulation, is controlled to a temperature $T_t$ by a combination of a chiller and a thermostated bath. The mean temperature $T_m=(T_b+T_t)/2$ is kept at a constant $31\,^\circ \mathrm {C}$, so that $Pr=5.2$. The convection cell is placed on a rotating table. We apply constant rotation $\varOmega =1.93$ rad s $^{-1}$, corresponding to $Ek=5.00\times 10^{-8}$. At this Ekman number, $2R/\ell _C\approx 22$, i.e. the cylinder diameter fits $22$ times the characteristic onset length $\ell _C$. The temperature difference ${\rm \Delta} T=T_b-T_t$ is changed between experiments to vary $Ra$. Additionally, one non-rotating experiment is included for reference. The operating conditions for the various experiments are summarised in table 1. These conditions are the same as in Madonia et al. (Reference Madonia, Aguirre Guzmán, Clercx and Kunnen2021); they also overlap with the heat transfer data from the same set-up reported in Cheng et al. (Reference Cheng, Madonia, Aguirre Guzmán and Kunnen2020), at the intermediate $Ek$ value considered in that paper.
Table 1. Parameter values for the experiments. In all cases,  $\varGamma =0.195$ and $Pr=5.2$. Output parameters are the Reynolds numbers $Re_u$ and $Re_w$ based on horizontal and vertical r.m.s. velocities, respectively. For the non-rotating experiment (bottom row), the parameter $Ra/Ra_C$ is not stated explicitly. It is large given that without rotation $Ra_C$ is only $O(10^3)$; quantitative comparison to the rotating cases is not meaningful.

Optical access is facilitated by a custom-made water-filled prism mounted around the cylinder, significantly reducing refraction on the cylinder wall. It allows for horizontal crossing of a laser light sheet with thickness approximately  $3.5\ \mathrm {mm}$ at mid-height $z/H=0.5$. The laser pulses at frequencies $7.5$ or $15\ \mathrm {Hz}$, depending on the typical flow speeds. The water is seeded with polyamid particles with nominal diameter $5\ \mathrm {\mu }$m. Two $5\ \mathrm {Mpixel}$ cameras (Jai SP-500M-CXP2) equipped with Scheimpflug adapters are each placed at a stereoscopic angle of approximately $45^\circ$ with the vertical, so that stereo-PIV can be applied (Prasad Reference Prasad2000; Raffel et al. Reference Raffel, Willert, Wereley and Kompenhans2007). We can measure the full velocity vectors $\boldsymbol {u}=(u,v,w)$ in the laser light sheet plane, resulting in a grid of vectors with separation $3.2\ \mathrm {mm}$ in both horizontal directions that fits $122$ vectors in the cylinder diameter. Between $3000$ and $9000$ vector fields are evaluated per experiment, for a measurement duration ranging from $200$ to $600\ \mathrm {s}$.
Results are presented in terms of Reynolds numbers. Horizontal and vertical velocities are treated separately. The Reynolds number  $Re_u$ is based on the characteristic horizontal velocity $U_h=\sqrt {\langle u^2\rangle +\langle v^2\rangle }$. Here, $\langle \,\cdot\, \rangle$ denotes either averaging over time and over circular shells to obtain radial profiles, or averaging over time and over the full cross-sectional area excluding the wall mode near the sidewall (to be defined more precisely later on) to get to a single representative value per experiment. In this azimuthal averaging, we divide the section into 65 concentric circular shells. Each shell represents a ring of thickness $3\ \mathrm {mm}$, comparable to the resolution of our PIV vector field spacing ( $3.2\ \mathrm {mm}$). Similarly, $Re_w$ is based on the characteristic velocity scale $W=\sqrt {\langle w^2\rangle }$. In all cases, $\langle u\rangle \approx \langle v\rangle \approx \langle w\rangle \approx 0$. These Reynolds numbers can also be interpreted as the r.m.s. velocities normalised with the viscous velocity scale $U_\nu =\nu /H$. Likewise, we consider the r.m.s. value of the vertical component of vorticity, $\omega _z^{rms}$.
An important consideration that is encountered in rotating convection experiments is the effect of centrifugal buoyancy (Horn & Aurnou Reference Horn and Aurnou2018, Reference Horn and Aurnou2019). We use the Froude number  $Fr=\varOmega ^2R/g$ to quantify the ratio of maximal centrifugal to gravitational acceleration. Since centrifugal acceleration is negligibly small in most geophysical and astrophysical applications, its effects (as studied in detail by Horn & Aurnou Reference Horn and Aurnou2018, Reference Horn and Aurnou2019) should preferably be kept to a minimum in experiments, i.e. $Fr\ll 1$. Here, $Fr=0.074$ for all rotating experiments. Such a $Fr$ value did not lead to significant up/down asymmetry in our sidewall temperature measurements (Cheng et al. Reference Cheng, Madonia, Aguirre Guzmán and Kunnen2020); we expect that centrifugal buoyancy is negligibly small in these experiments, too.
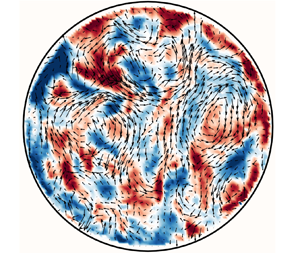
To give a first impression of the measurement results, we plot two instantaneous velocity field snapshots at  $Ra=6.48\times 10^{11}$, with and without rotation, in figure 1. Velocities are normalised with the viscous velocity scale $\nu /H$, which is $3.87\times 10^{-7}$ m s $^{-1}$ at this mean temperature. As such, the magnitude of the normalised velocity components in these plots can be interpreted as displaying the local instantaneous Reynolds number. It is clear that rotation, present in figure 1(a) but absent in figure 1(b), has a large effect on the overall flow structuring. Under rotation, the flow tends to organise into structures that are considerably smaller than the diameter of the cylinder, while without rotation, the global organisation is as large as the cross-section. We have considered the characteristic size of the flow features before in Madonia et al. (Reference Madonia, Aguirre Guzmán, Clercx and Kunnen2021), where we could see that the correlation length for vertical velocity increases as $Ra$ grows. In the rotating experiments, we can also observe intense vertical motion near the sidewall due to the convective wall mode (Favier & Knobloch Reference Favier and Knobloch2020; de Wit et al. Reference de Wit, Aguirre Guzmán, Madonia, Cheng, Clercx and Kunnen2020; Zhang et al. Reference Zhang, van Gils, Horn, Wedi, Zwirner, Ahlers, Ecke, Weiss, Bodenschatz and Shishkina2020, Reference Zhang, Ecke and Shishkina2021; Lu et al. Reference Lu, Ding, Shi, Xia and Zhong2021; Ecke et al. Reference Ecke, Zhang and Shishkina2022). For roughly half of the circumference, we find upward flow close to the sidewall; the other half is downward. In the non-rotating experiment (figure 1b), the large-scale circulation is observed (e.g. Ahlers et al. Reference Ahlers, Grossmann and Lohse2009): a vertical convection roll filling the domain with one half upward flow and one half downward flow.

Figure 1. Instantaneous velocity snapshots at  $Ra=6.48\times 10^{11}$: (a) with rotation, $Ek=5.00\times 10^{-8}$; (b) no rotation, $Ek=\infty$. The arrows display the horizontal velocity components; for clarity, only one-ninth of the total number of vectors is displayed. The background colour indicates the vertical velocity component. Velocities are normalised with the viscous velocity $\nu /H=3.87\times 10^{-7}$ m s $^{-1}$.
4. Reynolds number results
4.1. Radial profiles
We first consider radial profiles of the Reynolds numbers  $Re_u$ and $Re_w$, plotted in figure 2(a). Both quantities show an overall trend of larger values for larger $Ra$, as expected, with the exception of the two lowest $Ra$ cases, which are almost identical. The distinction between an inner and a near-wall outer portion of the domain is clear from both quantities: both profiles suggest a generally constant value that is largely independent of the radial position for the bulk part, away from the lateral sidewall, and a change of behaviour close to this sidewall. There, we see an increase in $Re_w$, a clear indication of the presence of vigorous convection near the sidewall in the wall mode. The black crosses in figure 2(a) indicate the approximate thickness of the sidewall boundary layer following the empirical relation
 \begin{equation} \delta_{w_{rms}}/R=a\,Ra^{0.15\pm 0.02}, \end{equation}
based on capturing the radial extent of the near-wall  $w_{rms}$ peak; $a=(3\pm 1)\times 10^{-3}$ is reported by de Wit et al. (Reference de Wit, Aguirre Guzmán, Madonia, Cheng, Clercx and Kunnen2020). Here we use $a=2\times 10^{-3}$ as the prefactor and $0.15$ as the exponent for $Ra$. This definition agrees well with our data as it indicates the extent of the sidewall layer, in both $Re_w$ and $Re_u$. For the former, it is at the base of the near-wall peak; for the latter, we see the beginning of the decay to zero.

Figure 2. (a) Radial dependence of  $Re_u$ (dashed lines) and $Re_w$ (solid lines) for different $Ra$. Black crosses indicate the beginning of the sidewall boundary layer, following 4.1. (b) Radial dependence of $\omega _z^{rms}$ for different $Ra$, normalised using the viscous time scale $\tau _{\nu }=H^2/\nu$. The legend entry ‘NR’ refers to the non-rotating experiment. All the quantities displayed in this figure are shown from only half the cylinder radius onwards for clarity.
The non-rotating case (black curves in figure 2a) shows three main points of interest. First,  $Re_w$ displays an immediate decay to zero close to the sidewall without any previous increase, contrary to the rotating cases. Second, without rotation, we measure significantly higher values of both $Re_u$ and $Re_w$ relative to the rotating case at the same $Ra$ (compare black and purple curves in figure 2a), a clear indication that the strong influence of rotation makes the flow less turbulent, suppressing both vertical and horizontal r.m.s. velocities. Third, the r.m.s. vertical velocity is now considerably more pronounced than the horizontal component, unlike the rotating cases. We will discuss flow anisotropy later in this paper.
In figure 2(b), we plot  $\omega _z^{rms}$ normalised using the viscous time scale $\tau _{\nu }=H^2/\nu$. The same trends as for $Re_w$ are reflected here, with the two cases with lowest $Ra$ being almost identical, and profiles that increase for higher $Ra$. Also here, we see higher values for the non-rotating case compared to its corresponding rotating counterpart, even though the difference is less than we see for vertical velocities. The non-rotating case also shows a localised peak close to the sidewall, while the rotating cases have a wider radial region where the vorticity increases before dropping down at the wall.
All the quantities displayed in figure 2 are shown from half the cylinder radius onwards, for clarity. The inner part keeps showing a constant behaviour down to approximately  $\frac {1}{10}R$, a circle of approximately $20\ \mathrm {mm}$ around the axis of the cylinder, where the scarcity of velocity vectors prevents meaningful radial binning and azimuthal averaging.
The quantities  $Re_u$, $Re_w$ and $\omega _z^{rms}$ are approximately constant in the inner part of the cylinder. From the profiles in figure 2, we can extract for every $Ra$ a mean value of that quantity in the bulk. This bulk average is obtained by excluding the wall zone as defined by (4.1) as well as excluding a circle of radius $20\ \mathrm {mm}$ from the cylinder axis, an area where the azimuthal averaging does not give trustworthy data, as argued above. In figure 3(a), we plot these averaged data as a function of $Ra$, with error bars that represent the standard deviations of these means. We also give the corresponding flow states as inferred from our earlier heat transfer measurements (Cheng et al. Reference Cheng, Madonia, Aguirre Guzmán and Kunnen2020).

Figure 3. (a) Dependence on  $Ra$ of Reynolds numbers based on horizontal ( $Re_u$) and vertical ( $Re_w$) velocity components (red, left ordinate) and vertical vorticities $\omega _z^{rms}$ (blue, right ordinate). Vorticity is normalised with the viscous timescale $\tau _\nu =H^2/\nu$. The solid lines represent power-law fits $Re_u\sim Ra ^{0.65 \pm 0.07}$, $Re_w\sim Ra ^{0.70 \pm 0.06}$ and $\omega _z^{rms} \sim Ra^{0.63 \pm 0.05}$. The dashed black diagonal line indicates the scaling $Re\sim Ra$ for reference. (b) Kinetic energy anisotropy $A=W^2 / (U_h^2+W^2)$ versus $Ra$. For isotropy, $A=\tfrac {1}{3}$ (red dashed line). In both panels, the dotted and dash-dotted lines represent the transitional $Ra$ between CTCs and plumes, and between GT and RIT, respectively, while open symbols represent the values for the non-rotating case.
As mentioned before, the two lower  $Ra$ cases, both in the CTC regime, show very similar values. From the plumes regime onwards, all the quantities display a steeper trend that is reasonably constant between the plumes/GT and RIT states: $Re_u\sim Ra ^{0.65 \pm 0.07}$, $Re_w\sim Ra ^{0.70 \pm 0.06}$ and $\omega _z^{rms} \sim Ra^{0.63 \pm 0.05}$. These exponents are notably smaller than the diffusion-free velocity scaling $Re\sim Ra$ of (2.17) included in figure 3 with a dashed black line. At the same time, these exponents are notably larger than the non-rotating trend $Re\sim Ra^{0.44}$ that has been measured in various experiments and employing different methods, as summarised by Ahlers et al. (Reference Ahlers, Grossmann and Lohse2009). They are even larger than the ‘ultimate’ diffusion-free scaling $Re\sim Ra^{1/2}$ for non-rotating convection (Kraichnan Reference Kraichnan1962; Spiegel Reference Spiegel1971; Grossmann & Lohse Reference Grossmann and Lohse2002). Another clear difference between the current non-rotating and rotating experiments is that without rotation, the values are higher than with rotation at the same $Ra$.
$Ra$.
The vorticity scaling  $\omega _z^{rms}\sim Ra ^{0.63}$ follows nicely that of horizontal velocity. From this information, we can infer that the characteristic horizontal length scale $\ell$ does not change much with $Ra$, employing the estimate $\omega _z\sim U_h/\ell$. This $Ra$-independent characteristic scale for rapidly rotating convection is one of the starting points of the asymptotically reduced equations (e.g. Sprague et al. Reference Sprague, Julien, Knobloch and Werne2006; Julien et al. Reference Julien, Rubio, Grooms and Knobloch2012b) that describe the flow in the limit $Ek\rightarrow 0$ and that have provided a lot of insights into geostrophic convection. We have measured correlation length scales before, in Madonia et al. (Reference Madonia, Aguirre Guzmán, Clercx and Kunnen2021). While velocity-based correlation lengths grew with increasing $Ra$, the correlation lengths based on vertical vorticity (which can be interpreted as the Taylor microscale) were found to be largely independent of $Ra$. Taylor length scales independent of $Ra$ have also been observed in asymptotic plane layer dynamo simulations by Yan & Calkins (Reference Yan and Calkins2022).
To study the degree of anisotropy in the bulk flow, we plot in figure 3(b) the kinetic energy anisotropy for each case, defined as
 \begin{equation} A= \frac{W^2}{U_h^2+W^2}. \end{equation}
It describes the fraction of total kinetic energy found in vertical motions. In the isotropic case, where the energy is distributed equally among the three components, this value would be  $\frac {1}{3}$. As we see from figure 3(b), the non-rotating case is far away from that value, while the rotating cases display values very close to the isotropic one, with the possible exception of the case with $Ra=6.48 \times 10^{11}$, possibly a point of transition between the plumes and GT states of the geostrophic regime, for which no transition relation is currently available. Here, rotation thus suppresses the large anisotropy of non-rotating convection, ending up in near-isotropy.
4.2. Test of force balance scaling relations
We can use the measured characteristic velocities to test compliance (in terms of  $Ra$ scaling) with the scaling relations (2.11) and (2.14), respectively based on the VAC and CIA force balances. We graphically test the compliance in figure 4 by plotting $Re/Re_{VAC}$ and $Re/Re_{CIA}$. Input on the $Nu(Ra)$ scaling is required. Here, we use our prior heat transfer results obtained in the same experimental set-up by Cheng et al. (Reference Cheng, Madonia, Aguirre Guzmán and Kunnen2020), namely, $Nu\sim Ra^{0.64}$ for the plumes/GT range, and $Nu\sim Ra^{0.52}$ for the RIT range. It must be emphasised that these measured relations may be affected by the heat transfer contribution of the sidewall circulation (de Wit et al. Reference de Wit, Aguirre Guzmán, Madonia, Cheng, Clercx and Kunnen2020; Zhang et al. Reference Zhang, van Gils, Horn, Wedi, Zwirner, Ahlers, Ecke, Weiss, Bodenschatz and Shishkina2020; Lu et al. Reference Lu, Ding, Shi, Xia and Zhong2021). We also include the ultimate scaling $Nu\sim Ra^{3/2}$ as per (2.16). The VAC scaling test is included for this diffusion-free relation, too, despite the incompatibility of combining a diffusion-free $Nu$ scaling with a force balance that includes the viscous force explicitly. The $Re$ scaling relations (2.11) and (2.14) do not have numerical prefactors. To make these plots, we have chosen the prefactors such that the points are at the same level on average for ease of comparison.

Figure 4. Test of  $Re(Ra)$ scaling with VAC (see (2.11)) and CIA (see (2.14)) force balance arguments, for (a,b) $Re_u$, and (c,d) $Re_w$. Three different $Nu(Ra)$ relations are invoked: $Nu\sim Ra^{0.52}$ (green, for RIT) and $Nu\sim Ra^{0.64}$ (red, for plumes/GT) based on our heat transfer measurements in the same set-up (Cheng et al. Reference Cheng, Madonia, Aguirre Guzmán and Kunnen2020), and $Nu\sim Ra^{3/2}$ (blue) following (2.16).
For both  $Re_u$ and $Re_w$, it is observed that either VAC or CIA scaling does a good job of describing the results, provided that our earlier experimental $Nu(Ra)$ relations are employed. We see that both relations $Nu\sim Ra^{0.52}$ and $Nu\sim Ra^{0.64}$ lead to comparable results and are equally valid in the plumes/GT and RIT ranges. Based on these plots and on the current data, we cannot decide which scaling (VAC or CIA) is most appropriate. This is in line with the analysis of Hawkins et al. (Reference Hawkins, Cheng, Abbate, Pilegard, Stellmach, Julien and Aurnou2023) (also covered in Hawkins Reference Hawkins2020), who similarly reported co-scaling of VAC and CIA relations based on measurements using laser Doppler velocimetry. We can insert these numbers into the scaling relations (2.11) and (2.14) for a quantitative comparison. Using $Nu\sim Ra^{0.64}$ for the plumes/GT range, we arrive at the prediction $Re \sim Ra^{0.82}$ from VAC scaling, and $Re \sim Ra^{0.66}$ from the CIA balance. When we use $Nu\sim Ra^{0.52}$ as obtained for the RIT range, we find $Re \sim Ra^{0.76}$ for VAC, and $Re \sim Ra^{0.61}$ for CIA. Our exponents for the velocity scalings from figure 3 are in this range – perhaps a bit closer to the CIA trend than to the VAC scaling, but certainly not giving a conclusive answer either. We are probably in a state where both inertial and viscous forces play a role. The flow is turbulent enough that inertial forces are relevant, but not yet turbulent enough to reach the diffusion-free scaling $Re\sim Ra$ of (2.17). Hawkins et al. (Reference Hawkins, Cheng, Abbate, Pilegard, Stellmach, Julien and Aurnou2023) conclude that pure CIA scaling is not observed given that the $Nu(Ra)$ is still affected by boundary-layer dynamics and thus not diffusion-free yet – a result that we share (Cheng et al. Reference Cheng, Madonia, Aguirre Guzmán and Kunnen2020).
To interpret our data further and compare to previously published results, we collect several reported datasets for  $Re_w$ in figure 5. We plot $\widetilde {Re}_w=Re_w\,Ek^{1/3}$ as a function of $(\widetilde {Ra}-\widetilde {Ra}_C)/Pr=(Ra-Ra_C)\,Ek^{4/3}/Pr$, both inspired and necessitated by the results of Maffei et al. (Reference Maffei, Krouss, Julien and Calkins2021) from asymptotic model simulations. In their asymptotic equation, $Ek\rightarrow 0$ so $Ek$ itself remains undefined. Furthermore, using this plot convention, they obtained a good collapse of their data spanning a range of $Pr$ and $\widetilde {Ra}$; see the plus symbols in the plot. Their simulation domain is a Cartesian box with periodic boundary conditions in the horizontal directions and stress-free walls on bottom and top. The other datasets are from DNS and experiments, where the corresponding Ekman number is colour-coded. The current results are included with diamonds. The experimental results by Hawkins et al. (Reference Hawkins, Cheng, Abbate, Pilegard, Stellmach, Julien and Aurnou2023) cover a significant range $Ra\approx 10^8\unicode{x2013}2\times 10^{11}$ and $Ek\approx 10^{-7}\unicode{x2013}3\times 10^{-5}$; they are the reported RRBC Reynolds number data closest to the current study in terms of $Ra$ and $Ek$, and are included with dots. Numerical and experimental results corresponding to a smaller cylindrical convection cell at $Ra\approx 10^9$ and $Ek\approx 3\times 10^{-6}\unicode{x2013}10^{-3}$ taken from Kunnen, Geurts & Clercx (Reference Kunnen, Geurts and Clercx2010) and Rajaei et al. (Reference Rajaei, Alards, Kunnen and Clercx2018) are included with up and down triangles. Finally, the DNS study by Aguirre Guzmán et al. (Reference Aguirre Guzmán, Madonia, Cheng, Ostilla-Mónico, Clercx and Kunnen2020) on a horizontally periodic domain with no-slip walls on bottom and top at $Ra=5\times 10^9\unicode{x2013}10^{12}$ and $Ek\approx 10^{-7}$ is included with open circles. From figure 5, we can make several observations.

Figure 5. Comparison of current results for  $Re_w$ with published results. Plus signs: data from Maffei et al. (Reference Maffei, Krouss, Julien and Calkins2021), colour coded by $Pr$, results from asymptotically reduced model simulations on a horizontally periodic domain. Other symbols colour-coded by $Ek$ (see colour bar). Diamonds: current results. Small filled circles: experiments of Hawkins et al. (Reference Hawkins, Cheng, Abbate, Pilegard, Stellmach, Julien and Aurnou2023). Up triangles: DNS in a cylinder (Kunnen et al. Reference Kunnen, Geurts and Clercx2010). Down triangles: experiments of Rajaei et al. (Reference Rajaei, Alards, Kunnen and Clercx2018). Circles: DNS in a horizontally periodic domain (Aguirre Guzmán et al. Reference Aguirre Guzmán, Madonia, Cheng, Ostilla-Mónico, Clercx and Kunnen2020).
First, the plateauing at low  $Ra$ that we observed in figure 3(a) is also observed in the data of Hawkins et al. (Reference Hawkins, Cheng, Abbate, Pilegard, Stellmach, Julien and Aurnou2023). On the contrary, the simulation results on horizontally periodic domains (Aguirre Guzmán et al. Reference Aguirre Guzmán, Madonia, Cheng, Ostilla-Mónico, Clercx and Kunnen2020; Maffei et al. Reference Maffei, Krouss, Julien and Calkins2021) do not show such a plateau. The principal distinguishing property is the presence or absence of a sidewall. We know that the sidewall circulation generates jet-like intrusions from the sidewall region into the bulk (Favier & Knobloch Reference Favier and Knobloch2020; Madonia et al. Reference Madonia, Aguirre Guzmán, Clercx and Kunnen2021). It is thus plausible that the observed plateauing of $Re_w$ is caused by the dominance of the jets emerging from the sidewall circulation over the columnar convection in the central region. Note that the difference between the DNS of Aguirre Guzmán et al. (Reference Aguirre Guzmán, Madonia, Cheng, Ostilla-Mónico, Clercx and Kunnen2020) and the asymptotic model of Maffei et al. (Reference Maffei, Krouss, Julien and Calkins2021) at low $\widetilde {Ra}=Ra\,Ek^{4/3}$ is related to the applied boundary conditions: in this range, paradoxically, no-slip boundaries lead to higher $Nu$ (and thus also higher $Re_w$) than stress-free boundaries at otherwise identical parameter values (Schmitz & Tilgner Reference Schmitz and Tilgner2010; Stellmach et al. Reference Stellmach, Lischper, Julien, Vasil, Cheng, Ribeiro, King and Aurnou2014; Kunnen et al. Reference Kunnen, Ostilla-Mónico, van der Poel, Verzicco and Lohse2016; Plumley et al. Reference Plumley, Julien, Marti and Stellmach2017). This effect has been ascribed to the prevalence of Ekman pumping as a source of vertical transport, present for no-slip plates but absent for stress-free.
Second, the Reynolds number scaling depends sensitively on the magnitudes of  $Ra$ and $Ek$. The smaller-scale cylinder investigations of Kunnen et al. (Reference Kunnen, Geurts and Clercx2010) and Rajaei et al. (Reference Rajaei, Alards, Kunnen and Clercx2018) at moderate $Ra\approx 10^9$ and $Ek$ down to $3\times 10^{-6}$ display a significantly shallower slope than the larger cylinders (larger $Ra$ and smaller $Ek$) of Hawkins et al. (Reference Hawkins, Cheng, Abbate, Pilegard, Stellmach, Julien and Aurnou2023) and the current study. There is definitely a different scaling upon entering the geostrophic regime of rotating convection. In fact, these four studies together display a gradual transition as a function of both $Ra$ and $Ek$. A steeper scaling can be seen as $Ek$ is reduced, while concomitantly increasing $Ra$ to retain turbulent convection, save for the added complications due to the sidewall circulation.
Third, the smallest- $Ek$ data points (orange and red) display a trend towards convergence to the asymptotic results for $(Ra-Ra_C)\,Ek^{4/3}/Pr \gtrsim 50$ and $Re_w\,Ek^{1/3}\gtrsim 20$. Notably, results of completely different origin (experiments, DNS and asymptotic models; horizontally periodic domains and confined cylinders) display convergence towards a common scaling behaviour. Based on this convergence, we expect that the effect of the wall modes on the $Re_w$ scaling is minimal. A linear scaling in figure 5 corresponds directly to the relation expressed in (2.17) where the velocity scale becomes independent of both diffusive parameters and domain-specific parameters, such as its height $H$. The convergence is not yet fully achieved; extra data points at even smaller $Ek$ values are required to corroborate this, but tough to realise experimentally or numerically. Such investigations may also allow us to investigate further the possible convergence between the curves coming from asymptotically reduced simulations, full Navier–Stokes simulations and experiments. We note that the asymptotic simulations of Maffei et al. (Reference Maffei, Krouss, Julien and Calkins2021) in fact result in stronger-than-linear scaling $\widetilde {Re}_w\sim \widetilde {Ra}^{1.2}$ (at $Pr=1$), which shows additionally that the existence of true diffusion-free flow behaviour remains an open question.
5. Energy spectra
To compute the energy spectra, we employ two-dimensional fast Fourier transforms of the velocity field, after padding the vector fields with zeros up to 512 grid points per dimension to avoid artefacts due to implied periodicity in the Fourier transform (Randall Reference Randall2008). The two-dimensional data are averaged over circular shells to obtain one representative curve independent of azimuthal angle. Since adjacent velocity vectors are  ${\rm \Delta} x=3.2\ \mathrm {mm}$ apart, the smallest wavenumber after zero padding is $k_\mathcal {L}=2{\rm \pi} /\mathcal {L}=2{\rm \pi} /(512\,{\rm \Delta} x)\approx 3.83\ \mathrm {m}^{-1}$, and the maximum relevant $k$ value (Nyquist wavenumber) is $k_{2{\rm \Delta} x}=2{\rm \pi} /(2\,{\rm \Delta} x)\approx 982 \ \mathrm {m}^{-1}$. All the $k$ values are integer multiples of $k_\mathcal {L}$. Nevertheless, the smallest physically relevant $k$ is determined by the diameter $D$ of the cylinder; that would be given by $k_{D}=2{\rm \pi} /D\approx 16.1 \ \mathrm {m}^{-1}$, but since all the wavenumbers are integer multiples of $k_\mathcal {L}$, our first relevant value is $k_{min}\approx 19.2 \ \mathrm {m}^{-1}$ – in dimensionless form, $k_{min}H\approx 38.4$.
The maximum relevant  $k$ requires more consideration. Previous literature (Foucaut, Carlier & Stanislas Reference Foucaut, Carlier and Stanislas2004; Savelsberg Reference Savelsberg2006) has shown that the window averaging applied in PIV measurements acts as a low-pass filter in Fourier space with a cut-off wavenumber that depends on the size of the measurement window $X$ (in our case, $X=2\,{\rm \Delta} x=6.4\ \mathrm {mm}$). The PIV filtering amounts to a multiplication in Fourier space of the real signal with a squared cardinal sine function
 \begin{equation} \mathrm{sinc}^2(kX/2)=\left(\frac{\sin{kX/2}}{kX/2}\right)^2. \end{equation}
We can then correct for this filtering, with corrected energy spectra becoming
 \begin{equation} E_{corr}=\frac{E_{meas}}{\mathrm{sinc}^2(kX/2)}, \end{equation}
where  $E_{meas}$ is the uncorrected spectrum determined directly from the PIV data, and $E_{corr}$ is the corrected spectrum. However, given that $\mathrm {sinc}^2(kX/2)\rightarrow 0$ as $kX/2\rightarrow {\rm \pi}$, direct application of (5.2) may cause practical difficulties: measurement noise will be severely amplified when approaching the zero of the denominator. To deal with this, we employ the rule of thumb proposed by Foucaut et al. (Reference Foucaut, Carlier and Stanislas2004) to cut off the spectra at a maximum $k_{max}=2.8/X$. At this $k$ value, the filter function is $\mathrm {sinc}^2(k_{max}X/2)\approx 0.5$, i.e. the spectrum is cut off at the wavenumber $k_{max}$ where PIV filtering reduces the measured spectral amplitude by $50\,\%$. In our case, $k_{max}H= 874$.
In figure 6, we show the energy spectra of our seven RRBC cases as well as the non-rotating case. We plot the total energy spectrum ( $E_{tot}$) together with the respective contributions from the horizontal ( $E_{hor}$) and vertical ( $E_{ver}$) velocity components. Wavenumbers are normalised using the cell height $H$.
$H$.

Figure 6. Kinetic energy spectra  $E(k)$ plotted as functions of normalised wavenumber $kH$, including total kinetic energy ( $E_{tot}$) as well as the contributions from horizontal ( $E_{hor}$) and vertical ( $E_{ver}$) velocity components. Reference power-law slopes $k^{-5/3}$ and $k^{-3}$ are also included. Graphs (e–h) are also plotted in compensated form $k^{5/3}\,E(k)$.
The rotating cases show common features. In all of them,  $E_{tot}$ exhibits a peak at $kH \approx 70$, which corresponds to the physical wavelength $L \approx 0.18 \ \mathrm {m}\approx D/2$. This peak is related to the ordering into a quadrupolar vortex state that we reported before (Madonia et al. Reference Madonia, Aguirre Guzmán, Clercx and Kunnen2021), which in hindsight was also found in the mean flow fields of de Wit et al. (Reference de Wit, Aguirre Guzmán, Madonia, Cheng, Clercx and Kunnen2020). Ecke et al. (Reference Ecke, Zhang and Shishkina2022) also show this flow organisation in their figure 2(c). Jets pointing radially inwards are observed at the positions where upward and downward flowing parts of the sidewall circulation meet, resulting in a four-quadrant organisation with two cyclonic and two anticyclonic vortices. The formation of these jets is a nonlinear feature of the sidewall circulation absent from its linear description (Herrmann & Busse Reference Herrmann and Busse1993; Liao, Zhang & Chang Reference Liao, Zhang and Chang2006; Zhang & Liao Reference Zhang and Liao2009). The dependence on the geometrical aspect ratio $\varGamma$ is an open question; we do anticipate changes for wider cylinders where more than one azimuthal wavelength can fit into the circumference. Here, with one azimuthal wavelength, we see an organisation into a quadrupolar vortex where each pole has characteristic size $L\approx D/2$. These structures are most energetic, but at the same time they are quasi-two-dimensional: there is no signature of them in the spectra $E_{ver}$ based on vertical velocity.
The shape of the remaining part of each spectrum is strongly dependent on the vertical energy contribution. As  $Ra$ increases, the peak in $E_{ver}$ goes towards smaller $k$ (larger length scales), a feature that we have observed before (Madonia et al. Reference Madonia, Aguirre Guzmán, Clercx and Kunnen2021) from calculations of the characteristic horizontal correlation length scale based on vertical velocity. We interpret this as the scale at which buoyancy is most prominently adding energy into the turbulent motion. In the language of the classical theory of three-dimensional turbulence (e.g. Frisch Reference Frisch1995; Pope Reference Pope2000), this scale can be considered the forcing scale. The dissipation scale (i.e. the Kolmogorov scale) remains approximately constant, leading to increased scale separation between forcing and dissipation as $Ra$ becomes larger. From the maximum of $E_{ver}$ towards larger $k$ values, we see the gradual development of a spectral scaling range close to $E(k)\sim k^{-5/3}$, the predicted scaling for the inertial range of three-dimensional turbulence (Frisch Reference Frisch1995; Pope Reference Pope2000). This scaling range is most prominent in the $E_{tot}$ curves and at larger $Ra$. We also plot the spectra of figures 6(e–h) in a compensated form $k^{5/3}E(k)$ to show the quality and extent of the $k^{-5/3}$ scaling range: the scaling range is not well developed in figure 6(e) at $Ra=1.08\times 10^{12}$, but it is present prominently in figures 6(f–h), the two rotating convection experiments at larger $Ra$ and the non-rotating case at $Ra=6.48\times 10^{11}$. Figures 6(a–d) are not shown in compensated form as no scaling range develops there.
The sum of horizontal and vertical contributions is reflected clearly in the total spectra  $E_{tot}$, with the peak due to the quadrupolar vortex dominating at smaller $k$, and a broad shoulder due to the peak contribution of $E_{ver}$ that shifts as a function of $Ra$.
$Ra$.
The horizontal spectra, in fact, also show a different scaling trend, from the approximate location of the peak of  $E_{ver}$ to smaller wavenumbers ending on the maximum of $E_{hor}$, which resembles the $E(k)\sim k^{-3}$ scaling. This $k^{-3}$ scaling could be a sign of a (non-local) inverse cascade (Smith & Waleffe Reference Smith and Waleffe1999; Lindborg Reference Lindborg2007; Julien et al. Reference Julien, Rubio, Grooms and Knobloch2012b; Aguirre Guzmán et al. Reference Aguirre Guzmán, Madonia, Cheng, Ostilla-Mónico, Clercx and Kunnen2020), although this scaling range is short and certainly cannot be considered as a proof. We are investigating the energy transfer among scales in more detail.
The non-rotating RBC case, instead, shows a very different situation. The peak of the overall spectrum is at  $k_{min}$, and it is due dominantly to the contribution of $E_{ver}$. It is a sign of the presence of the large-scale circulation of non-rotating convection (e.g. Ahlers et al. Reference Ahlers, Grossmann and Lohse2009): a domain-filling vertical convection roll with one half of the domain displaying upward flow and the other half downward. We have observed it in the current measurements (Madonia et al. Reference Madonia, Aguirre Guzmán, Clercx and Kunnen2021; Madonia Reference Madonia2022). This structure corresponds to a wavelength of approximately the diameter of the cylinder, that in wavenumber space is translated to $k_{min}$. Here, we also observe a rather extensive scaling range nicely matching the theoretical prediction $k^{-5/3}$.
6. Conclusion
We present flow statistics that result from the stereo-PIV measurements of rotating Rayleigh–Bénard convection in the geostrophic regime. We analyse radial profiles of the root-mean-square values of horizontal and vertical velocity as well as vertical vorticity. Near the sidewall, the radial extent of the sidewall circulation can be distinguished clearly. We see that for both velocities and vorticities, higher  $Ra$ corresponds to larger values of these quantities, and at the same $Ra$, the non-rotating case exhibits larger magnitudes than the corresponding rotating one.
Within the bulk region, for the flow states from plumes to rotation-influenced turbulence (RIT), the Reynolds number scalings follow a trend that lies in the range of both CIA and VAC scaling predictions, perhaps being numerically closer to the former, but otherwise no decisive distinction can be made. The vorticity scaling follows the same trend as the horizontal velocity, indicating that the characteristic horizontal scale remains constant (e.g. Sprague et al. Reference Sprague, Julien, Knobloch and Werne2006; Julien et al. Reference Julien, Rubio, Grooms and Knobloch2012b; Madonia et al. Reference Madonia, Aguirre Guzmán, Clercx and Kunnen2021). We also find that energy is distributed nearly isotropically, in contrast to non-rotating Rayleigh–Bénard convection where the vertical velocity component is strongly preferred.
The Reynolds number results compared to previously published results reveal that there is an overall steepening trend towards ‘ultimate’ diffusion-free scaling (Aurnou et al. Reference Aurnou, Horn and Julien2020) of the velocity fluctuations as the Ekman number is reduced, but we do not reach it yet. However, there are indications of convergence in scaling for results coming from different methods (experiments, direct numerical simulations and asymptotically reduced models) and different geometries (confined cylinders and horizontally periodic computational domains). At lower  $Ra$, there are complications due to the use of a confined geometry, as it promotes the presence of a wall mode that affects the bulk flow statistics.
Spectra of kinetic energy provide further evidence for the formation of a prominent quadrupolar vortex structure (Madonia et al. Reference Madonia, Aguirre Guzmán, Clercx and Kunnen2021). This feature is remarkably two-dimensional, as it is reflected only in spectra of horizontal velocity. In the spectra of vertical velocity, we observe a broad peak that we associate with the dominant length scale for energy injection. With increasing  $Ra$, the peak shifts towards smaller wavenumbers (larger length scales; Madonia et al. Reference Madonia, Aguirre Guzmán, Clercx and Kunnen2021). For larger wavenumbers, we observe the development of a scaling range with a classical $-5/3$ slope for three-dimensional turbulence (Frisch Reference Frisch1995; Pope Reference Pope2000). This inertial range scaling is most prominent for the non-rotating case.
These results provide valuable input on the turbulence scaling of flows in the geostrophic regime, a property that has been scarcely investigated up to now. There is clear perspective in the observed convergence of results from significantly different domains and employing different methods. At the same time, to reach true convergence, even more extreme parameter values than those used here are likely required, which is a major challenge for both experiments and direct numerical simulations. Additionally, the influence of the strong convection mode near the sidewall, the sidewall circulation, should be explored further to ensure proper interpretation of experimental and numerical results from confined domains.
Funding
M.M., A.J.A.G. and R.P.J.K. received funding from the European Research Council (ERC) under the European Union's Horizon 2020 research and innovation programme (grant agreement no. 678634). We are grateful for the support of the Netherlands Organisation for Scientific Research (NWO) for the use of supercomputer facilities (Cartesius and Snellius) under grant nos 2019.005, 2020.009 and 2021.009.
Data availability statement
The data that support the findings of this study are available from the corresponding author, R.P.J.K., upon reasonable request.
Declaration of interests
The authors report no conflict of interest.


 Open access