


1. Introduction
Free trade agreements (FTAs) contain product-specific rules of origin (ROOs) to determine the economic ‘nationality’ of traded goods. This is needed so that only the products and firms complying with the ROOs are granted preferential tariff access in the destination market. Otherwise, a tariff is charged. The objective is to ensure that products which do not originate from the FTA partner, but from third countries, pay the appropriate non-preferential tariffs.
ROOs are typically determined at the detailed harmonized system (HS) 6-digit product level. They are often complex and specific to each individual FTA, making it harder to compare effects across FTAs. Comparing the recently signed UK–Australia and UK–New Zealand agreements, across over 5,000 products, the ROOs differ in more than 2,000 cases.Footnote 1 In each case, the trader must decide whether or not to comply with the ROOs and incur the associated administrative costs, in order to claim preferential tariffs. If the ROO compliance cost is higher than the potential duty saving from claiming the preferential tariff, the firm may opt for paying the most-favoured-nation (MFN) tariff. Therefore, the degree to which firms make use of preferential treatment will depend in part on the trade-off between the MFN tariff which would need to be paid and the restrictiveness of the ROOs that apply.
On the 23 June 2016, the United Kingdom (UK) voted to leave the European Union (EU). Withdrawal took place on the 31 January 2020, followed by a transition and negotiation process, which led to the enactment of the Trade and Cooperation Agreement (TCA). Since the 1 January 2021, the UK–EU trade relationship has been governed by the TCA, which provides tariff-free access to UK exports to the EU and vice versa, subject to compliance with the ROOs where the degree of restrictiveness varies across products.
In this paper, we examine how access to preferential tariffs by UK firms in the EU market under the TCA, measured by the preference utilization rate, is impacted by the underlying ROOs.Footnote 2 For that purpose, we construct a Rules of Origin Restrictiveness Index (ROO − RI), which varies across HS 6-digit products. This index constitutes an important contribution, which we use in our empirical approach to control for the cost of ROO compliance but can also be used in further research comparing restrictiveness across FTAs.
To construct the ROO − RI, we build on previous work by Estevadeordal (Reference Estevadeordal2000), Estevadeordal and Suominen (Reference Estevadeordal and Suominen2006), and Cadot et al. (2006). We extend the Cadot et al. (Reference Cadot, Carrère, De Melo and Tumurchudur2006) restrictiveness index in order to consider the wider variety of ROO combinations and allowances under TCA. Thus, while their original index is on a 1–7 scale, our index ranges from 1 to 10. We apply the index to the TCA, which enables us to construct summary measures of ROO restrictiveness by industry and sector.
We find that the TCA has a moderate degree of ROO restrictiveness, with an average score of 4.32, with industries such as textiles, automotives, and materials being those with the most complex rules. Using country-level Eurostat data on EU imports from the UK, we observe that the preference utilization rate (PUR) has risen since January 2021, with the highest levels of utilization in agrifood activities. We also observe a positive correlation between the PUR and the tariff margin, expressed by the EU Common External Tariff, at the chapter (HS 2-digit), heading (HS 4-digit), and product (HS 6-digit) levels.
Our empirical approach finds that a higher ROO restrictiveness score is associated with a lower degree of preference utilization. Such an effect is more evident for consumption goods and, to a lesser extent, for capital and intermediate goods. Conversely, a larger benefit of complying with ROOs, expressed by the potential duty savings, is associated with a larger preference utilization rate at the product–country–month level.
The remainder of the paper is organized as follows. Section 2 provides a description of our ROO-RI. Section 3 presents the data and some descriptive statistics. Section 4 describes our econometric model and main results. Section 5 presents additional results, controlling for variables constructed on a firm-level basis. Section 6 concludes.
2. The Rules of Origin Restrictiveness Index
The ROO − RI is based on the five major ROO categories existing in the TCA (and typically found in most FTAs).Footnote 3 These are:
• Wholly Obtained (WO): goods that are entirely produced within the country. This rule is largely applied to agricultural products and some processed foods.
• Value-Added (VA): refers to the maximum amount of non-UK or non-EU value in the product being exported. Note that in the TCA bilateral cumulation is permitted, meaning that both UK and EU content are considered as having domestic originating status.
• Change in Tariff Classification (CTC): this rule tracks the transformation process of imported inputs into exported products. It requires that if a good being exported to the partner country uses intermediate inputs sourced from a non-partner country, then those inputs need to be from a different tariff line to the good being exported, for that good to be granted originating status. That ‘different tariff line’ can then be specified as being from a different HS 2-digit chapter (ΔCC), from a different HS 4-digit heading (ΔCTH), or from a different HS 6-digit sub-heading (ΔCTSH). In line with the previous work of Estevadeordal (Reference Estevadeordal2000) and Cadot et al. (Reference Cadot, Carrère, De Melo and Tumurchudur2006), we assume that the change of chapter rule (ΔCC) is harder to comply with than the change of heading (ΔCTH), which is likewise more restrictive than the change of subheading (ΔCTSH).
• Specific Production Processes (SP): this rule grants originating status depending on whether a given production process has been undertaken. Following consultation and discussions with UK policy makers, we allow the ROO − RI to vary across some sectors to which the SP rule applies, since the degree of difficulty to comply with this rule can be highly industry dependent.
• Any Heading (AH): imports from any product heading can be used in a good's production process.
These major categories are ranked according to their difficulty of compliance. We assume the WO and AH rules are the easiest to comply with, and they are assigned a score of 1. This decision is based on sector-specific factors characterizing products subject to these rules. The WO rule, for instance, is mostly used in the agrifood industry, composed of fresh-from-the-ground fruits and vegetables for which the rule is straightforward to fulfil.Footnote 4 As stated above, we assume that ΔCC is harder to fulfil than ΔCTH, which is likewise more restrictive than ΔCTSH. Hence, in our ROO − RI with a 1–10 scale, we assign a score of 9 to ΔCC, 6 to ΔCTH, and 3 to ΔCTSH. We also assign a baseline score of 6 to the SP rule.Footnote 5
Regarding the value-added (VA) rule, in the TCA the percentages of maximum non-originating value-added content range from 15% to 70%. We assume that the mid-range of the CTC rule (the change in heading) is equivalent in terms of restrictiveness to the 40% value-added rule. Hence, we assign a score of 6. The higher the amount of non-originated value-added allowed, the lower the restrictiveness. Thus, for instance, 15% has a score of 8.5, whereas 70% has a score of 3.Footnote 6
A couple of caveats: First, it is important to acknowledge that this index is an approximation and that it is hard to compare across different types of ROOs, and across products and sectors. Whether one type is easier to meet than the other will also in part depend on the product and the production process involved. Even within a given rule, the degree of restrictiveness is likely to vary across products and supply chains. While recognizing these limitations, our aim is to construct an index that, ceteris paribus, captures different levels of restrictiveness to a reasonable degree.
Second, the extent to which ROOs may or may not be ‘restrictive’ will also depend on other provisions, with regard to origin, in any given FTA. These are the provisions regarding cumulation of origin bilaterally or diagonally, duty-drawback provisions, as well as tolerance or de-minimis rules. However, such rules do not vary across products, and our aim in this paper is to consider the impact of the product-specific ROOs as opposed to the overall impact of ROOs on trade and preference utilization.
Lastly, our approach differs from the work of Gourdon et al. (2023), where restrictiveness is measured by estimating the effect of the main broad ROO categories on product-level bilateral trade, considering a wide panel of preferential trade agreements over time, and comparing trade flows subject to a product-specific rule under a preferential trade agreement with MFN trade flows. They find a wide heterogeneity of ROO effects attached to the preferential margin, with more flexible rules associated with more trade compared to more restrictive rules.
In practice, and increasingly over time, the five broad categories of ROOs identified above are either used in combination with each other or with additional modifications. Hence, for some products there may be a requirement to meet both a CTC rule and a VA rule; for others, there may be a choice between either a CTC rule or a VA rule. For other products, it might be that the ΔCC rule applies, except in certain cases where the ΔCTSH rule. In consequence there are well over 100 different rules applied in the TCA.
As a second step, therefore, we identified a list of the variants and combinations, which also need to be scored, using the following principles:
-
Principle 1: If the major ROO is accompanied by an allowance/relaxation, the rule is less restrictive and is granted a lower score. Typical examples are HS 6-digit rules starting with ‘CTH, however … ’ being given a maximum score of 5.
-
Principle 2: If the major rule is followed by an exception, that exception is an aggravating factor, making the ROO more restrictive and is scored higher. For instance, rules in the TCA starting with ‘CTH, except … ’ are given a minimum score of 6.5, whereas rules beginning with ‘CC, except … ’ are scored 10.
-
Principle 3: Where firms can choose between two or more ROOs, the presence of flexibility suggests the rule may be easier to meet. Products combining the CTC rule and the VA rule are the most typical. These are scored on the basis of the least restrictive option, as well as reducing the score to allow for the built-in flexibility. Where the score difference between the least and more restrictive rules is up to 2, we subtract one point from the easiest rule. Conversely, when that difference is over 2, we subtract 0.5 from that rule.Footnote 7
-
Principle 4: For other products, firms may be required to fulfil a combination of ROOs. In the TCA, most of these involve the ΔCTH rule, accompanied by either the WO rule or some degree of value-added. Examples include rules starting with ‘CTH, provided that … ’ or ‘CTH plus … ’. In those cases, the score should never be lower than 6, which is the ΔCTH score on its own. Adding an additional ROO implies an increase in restrictiveness. Only in an extreme case, such as adding a rule consisting of a high maximum value-added percentage such as 90%, then the score remains at 6.
-
Principle 5: Some HS 6-digit tariff lines specify different ROOs for varieties of products within that line, typically at the HS 8 or HS 10 levels. Since our restrictiveness index is defined at the 6-digit level, we take the average of the scores of each variety to get a final HS 6-digit score.
Figure 1 shows the distribution of the different types and combinations of ROOs in the TCA, illustrating the variety and complexity of requirements.. Around 35% of all 6-digit tariff lines in this agreement provide for choosing between a CTC and the VA rule, followed by 16.6% of products involving a combination of three or more rules, and 13.4% considering only CTC.

Figure 1. The distribution of ROO under the TCA (%).
Table 1 provides the distribution of the major ROO categories across broad industries, each of which embraces a group of HS 2-digit sectors. The WE category in the last column corresponds to a rule permitting a maximum amount of non-originating content in the total weight of the product to be exported. This rule is always featured in combination with other ROOs for a single product. The CTC and VA rules are the most frequent across industries, particularly in advanced manufacturing and machinery, chemicals, manufacturing and electronics, and electronics and materials. The WO rule is the dominant one in the agrifood industry, whereas SP is frequently applied in textiles.
Table 1. ROO distribution under the TCA across industries (number of HS 6-digit products)

Source: UK–EU Trade Cooperation Agreement. Own elaboration.
3. Data and Descriptive Analysis
3.1 The Data
To construct the TCA ROO − RI, we applied the index as above to the ROOs applying to each 6-digit tariff line under the TCA signed by the UK and the EU.
To measure the preference utilization rate by UK firms in the EU market within the framework of the TCA, we rely on product–country monthly data on EU imports from the UK by Eurostat, from January 2021–August 2022. This data source categorizes UK–EU trade under two criteria: (i) the tariff regime under which a good is imported into the EU; and (ii) the product's eligibility to a particular tariff regime.
From (i) we are able to identify whether goods entered the EU by paying an MFN tariff (either zero or non-zero), or under a preferential treatment, be it a FTA or the Generalized System of Preferences (GSP). From (ii), we know whether the goods were eligible or not for each of those regimes. Most trade flows from Eurostat fall into the statistical regime 1, i.e. goods exported and not re-exported after transformation. These are the flows we focus on in this paper.Footnote 8
To account for the preferential margin, we make use of the EU Common External Tariff (EU–CET), since UK goods enter the EU with a zero tariff under the TCA. Data on the EU–CET, mostly defined at the 10-digit product level, were collected from the World Bank's World Integrated Trade Solution, which also includes an estimation of ad valorem tariffs for products subject to non-tariff measures.
For descriptive statistics and additional controls in our empirical approach, we also collect trade data from the Office for National Statistics (ONS) and Her Majesty Revenues and Customs (HMRC). The ONS provides updated data on the UK Global Tariff in force from the 1 January 2021. From HMRC, we extract complementary data on UK goods trade to the EU and the rest of the world, as well as firm-level trade data which we use to explore additional possible determinants of preference utilization.
3.2 Descriptive Analysis
Figure 2 presents the distribution of our ROO − RI across HS 6-digit products for the UK–EU TCA. The average restrictiveness score of this agreement is 4.32, which constitutes a moderate degree of restrictiveness, given the 1–10 scale of our index. The bulk of the scores are concentrated in the columns labelled 3.5, 4, and 6. Most of the high frequency value of 3.5 is accounted for by chemical products in which firms can opt for ΔCTSH, a SP process or the value-added rule at 50%. Similarly, the high frequency value 4 is accounted for by the many products ruled by the option between ΔCTH and a maximum non-originating value added of 50%. As for the score of 6, it is mostly driven by textile products subject to specific processes (SP) and the ΔCTH rule in many sectors.
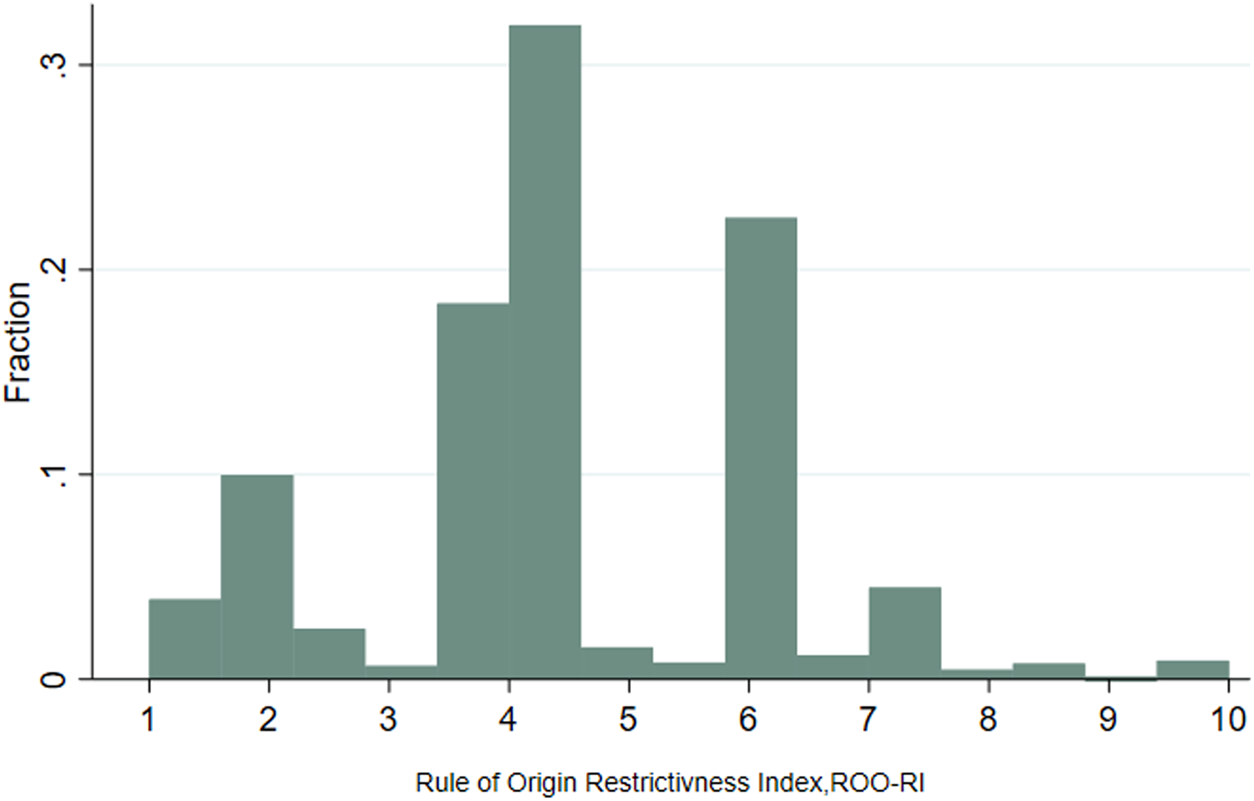
Figure 2. The distribution of the ROO restrictiveness index
Figure 3 provides the (unweighted) average degree of ROO restrictiveness across broad aggregate sectors. Note that textiles is the most restrictive sector, mostly due to its tariff lines being subject to specific production (SP) processes. Conversely, chemicals and agrifood are the sectors with the lowest degree of restrictiveness. The former, is due to many tariff lines being subject to the ΔCTSH rule; the latter, due to the prevalence of the wholly obtained (WO) rule.

Figure 3. The degree of ROO restrictiveness index across sectors
By way of comparison, we have also applied our index to other recent trade agreements signed by the UK, such as UK–Australia, UK–New Zealand, and UK–Japan. That results in an average ROO − RI score of 4.19 for UK–Australia, 3.71 for UK–New Zealand and 4.47 for UK–Japan.
In order to provide more comparative detail, Figure 4 plots the average ROO − RI at the HS 2-digit chapter level for the TCA and each of the three other FTAs. Two interesting messages emerge from this. While there are chapters and products where there is a similarity in restrictiveness across most of the agreements (such as chapters 17–19), it is also clear that there is considerable variation across the agreements. Hence, it can be seen that for HS chapters 82–89 the TCA tends to be more restrictive, while for some of the textiles and clothing chapters (61,62,64) the TCA is typically less restrictive, especially in comparison to the Australia and New Zealand deals.

Figure 4. ROO restrictiveness index across HS 2 sections and trade agreements.
It was such differences between agreements that led Bhagwati (Reference Bhagwati1995) to describe the growth of FTAs as a ‘spaghetti bowl’.Footnote 9
In order to see if there is prima facie a correlation between the restrictiveness of the ROOs and the tariff levied by the EU in case of no compliance, Figure 5 presents a scatter plot of the average ROO − RI and the average EU Common External Tariff (EU-CET) across 21 HS sectors, considering actual 2021 HMRC data on UK exports to the EU. On grounds of political economy, it may be that industries protected with high tariffs may also be protected by more restrictive ROOs and vice versa. Interestingly, however, no clear pattern can be found between the two variables. Hence, textiles, foodstuff, beverages, and tobacco, among others, face highly restrictive ROOs and high tariffs, while animal and vegetable products, which also face high tariffs, have a much lower degree of restrictiveness.

Figure 5. ROO restrictiveness index and EU common external tariff, 2021.
We are interested in the determinants of UK exporters’ use of tariff preferences in the TCA, as measured by the preference utilization rate (PUR). This is calculated as the ratio of EU imports from the UK, which access the EU market with zero preferential tariffs, relative to all imports eligible for those zero tariffs.
Additionally, we calculate the duty savings rate (DSR). This is the result of dividing the actual duty savings (ADS) by the potential duty savings (PDS). The former is the product of the EU common external tariff and the imports that actually enter the EU under preferential tariffs under the TCA. The latter, is the product of the EU-CET and total imports, regardless of the tariff regime. Potential duty savings capture the extent of possible savings which could arise from UK exports to the EU by entering under the preferential rate, as opposed to the MFN tariff. Hence, the duty savings rate is an alternative way to see the extent to which UK firms make use of EU preferences treatment, which is based on both the actual level of trade and also the tariff differential.
Both the PUR and DSR of UK goods in the EU market rise over the period of analysis (this is also true for Tariff Free Trade rate, which is the share of all imports entering with a zero tariff relative to total imports). By July 2022, the PUR is just above 80%. Agrifood industries tend to make higher use of preferences in the EU market, with PURs and DSRs above 85%. The opposite is the case for textile industries where the average PUR is 46.5%. There is also a positive correlation between the PUR and the EU's Common External Tariff across industries.
4. Empirical Approach
Our hypothesis is that preference utilization is affected by: First, the degree of restrictiveness of the ROOs. The more restrictive are the ROOs under the TCA, the more difficult it becomes for firms to fulfil all the requirements to claim zero tariffs, leading to a lower PUR. Second, the preference margin, i.e. the difference between the EU MFN non-zero tariff (the EU Common External Tariff) and the TCA zero-tariff. We expect higher preference utilization for higher preferential margins. Third, we consider the trade size or scale effect, represented by the country-product import value. Ideally, with firm-level data, the more appropriate variable here would be the size of each firm-level consignment. In the absence of firm-level information, we take the size of the flow at the product level. This is analogous to the approach taken by Nilsson (Reference Nilsson2022), in the context of the EU, and Chang et al. (Reference Chang, Hayakawa, Laksanapanyakul, Narjoko, Pyun and Quimba2022) who look at PURs between Asian countries.Footnote 10 The larger the value of trade, the larger the duty savings for a firm, thus a higher expected preference utilization.
We have merged the second and third factor into one. Recall from Section 3 that the product of the EU-CET and total trade is the Potential Duty Savings, which is a a proxy for the potential benefits of ROO compliance. Therefore, we expect a larger degree of preference utilization for larger potential duty savings, caused by either a large trade values or a high tariff rate. We have also run the regressions by separating out the preference margin from the size of the trade flow, and obtain highly consistent results.
We estimate the following equation:
 $$PUR_{ijm} = \beta _0 + \beta _1ROO{\rm \_}RI_i + \beta _2ln{\rm \_}pds_{ijm} + \delta _{\,jy} + \mu _{ijm}.$$
PUR ijm is the preference utilization rate of HS 6-digit product i in country j in month m.  $ROO{\rm \_}RI_i$ is the product-specific ROOs restrictiveness index and $ln{\rm \_}pds_{ijm}$ is the log of potential duty savings for exporting product i from the UK to country j in month m, which is in function of the trade value and the EU tariff. We also control for partner country–year fixed effects which captures the effect of time-varying demand and supply shocks in the destination market, such as pandemic lockdowns, with diverging intensities across countries for our period of analysis. Additionally, we incorporate product dummies to establish differences in effects on the PUR between intermediate, capital, and consumption goods. The latter is our base category, and these product dummies are also interacted with $ROO{\rm \_}RI_i$ to determine if the restrictiveness effect differs across types of goods.
When studying ROOs effects on levels of trade, issues of endogeneity can arise (whether less restrictive ROOs lead to more trade, or whether ROOs are framed in a less restrictive way where trade is higher). In this paper, we consider the relationship between PURs and ROOs, and we find that less restrictive rules are associated with higher PURs. The analogous endogeneity question is whether less restrictive rules lead to higher PURs; or whether firms lobby for less restrictive ROOs in order to have higher PURs. This is of course possible. However, even if it is the latter, then less restrictive ROOs lead to higher PURs. Hence, it does not matter whether or not less restrictive ROOs are driven by political economy considerations (e.g. lobbying), or whether these are set completely independently by policy makers – the question is: Is there any evidence that higher PURs are associated with less restrictive ROOs?
The above specification is estimated with three different econometric approaches where in each case the regressions are run as a monthly panel from January 2021 to August 2022. First, we apply ordinary least squares (OLS) with the aforementioned fixed effects, and the results are presented in Table 2. Secondly, we carry out a double-censored Tobit estimation procedure. The rationale behind opting for this approach is that our dependent variable, the preference utilization rate, is censored at 0 and 1. Finally, we make use of the fractional response logistic (FL) model, ideal for bounded continuous dependent variables which vary between 0 and 1.Footnote 11
Table 2. Estimation results – OLS (January 2021 – August 2022)

Robust standard errors in parentheses.
*Denotes statistical significance at the 10% level;
**Denotes statistical significance at the 5% level;
*** Denotes statistical significance at the 1% level.
The results from Table 2 indicate that the coefficient of the  $ROO{\rm \_}RI_i$ is negative and significant at 1% across all specifications. It implies that for a one-point increase in the restrictiveness of the ROO of a product, preference utilization decreases by between 1.3 and 2.5 percentage points. The results also give support to the role of potential duty savings, given the positive and significant coefficients for $ln{\rm \_}pds_{ijm}$. This suggests that a 1% rise in potential duty savings, arising from either larger export values or higher EU tariff rates, is associated with a larger degree of preference utilization by 0.05 percentage points, approximately.
Columns (5) and (6) of Table 2 present the results from the inclusion of the intermediate and capital goods dummies and their interactions with  $ROO{\rm \_}RI_i$. The dummies on their own indicate that both intermediate and capital goods tend to have a larger degree of preference utilization than consumption goods (by up to 14.2 percentage points for the former, and 12.3 for the latter).
When it comes to the interaction with the ROOs restrictiveness index the coefficient of  $ROO{\rm \_}RI_i$ on its own is the effect of restrictiveness on PUR for consumption goods only. The corresponding effects for intermediate and capital goods are derived by adding that coefficient to their respective interactions. The restrictiveness of ROOs effects on preference utilization are negative for all categories of goods, but the effect is larger for consumption goods (1.8 percentage points), followed by capital goods (1.2 percentage points) and then intermediate goods (0.7 percentage points). These three separate effects make up to the average $ROO{\rm \_}RI_i$ negative effect of 1.3 percentage points in Column (5). A possible explanation for this is that capital goods are characterized by higher investments, and intermediate goods are essential for the production of final goods. Hence, firms trading in such goods are more likely to incur the ROO compliance costs in order to claim preferential treatment.
It is useful to compare the OLS results with the Tobit and FL approaches. In Table 3, we extract columns (4) and (6) of the OLS table to compare them with their equivalent results. We observe very high consistency across approaches and specifications in the sign and significance of the effects of all our variables of interest. The negative ROO − RI effect on preference utilization ranges between 2.5 (OLS), 2.8 (FL) to 3.1 (Tobit) percentage points. Similarly, the positive potential duty savings effect ranges between 0.056 (OLS), 0.067 (FL), and 0.075 (Tobit) percentage points.Footnote 12 The negative ROO − RI effect also remains constant over time, regardless of the type of estimation.
Table 3. Estimation results: comparison across econometric approaches (January 2021 – August 2022)

Robust standard errors in parentheses.
*Denotes statistical significance at the 10% level;
** Denotes statistical significance at the 5% level;
*** Denotes statistical significance at the 1% level.
Adjusted R-squared reported in Columns (3) and (4) (OLS);
Pseudo R-squared reported in Columns (1) and (2) (Tobit), (5) and (6) (Fractional Logit).
5. Producers, Distributors, and Supply Chains
Ideally, analysis should be undertaken at the firm level, in order to provide more accurate estimates, and also to control for firm-level variables, be this, for example, size or productivity. While we do not have access to the requisite firm-level data, we do have some information at the HS 6-digit level based on underlying firm-level trade data and firm-level characteristics.
First, we have information on the share of trade undertaken by producers and distributors. For this variable, we use HMRC firm-level trade data, concorded with the ONS Annual Business Survey, which allows us to identify for each 6-digit product exported by the UK, whether that export was undertaken by a firm which classifies itself as primarily a producer or a distributor, according to the underlying SIC class. These shares are calculated for 2015, thus capturing the structure of trade prior to the Brexit referendum. This is a potentially important factor in determining the PUR, as the ability of a UK apparel producer to satisfy the ROOs is quite likely to be somewhat different in comparison to a distributor firm. The latter may be purchasing clothing from abroad in order to send on to export markets, and hence may find it hard to satisfy either a CTC or a VA rule. Our hypothesis is that distributors are more likely to export non-originating products because insufficient further processing is carried out by those firms, and hence would not be able to utilize preferences.
The second issue concerns the degree of within-industry international supply chain integration for each product. A fairly standard approach for measuring such integration is through the use of inter-country input–output tables (ICIOs), such as the World Input–Output Database, or the OECD's Trade in Value Added Database. The advantage of these is that they allow for calculation of domestic and foreign value-added shares in exports and thus the degree of global value chain integration. However, such tables are only available at a high degree of sectoral aggregation. For example, the number of manufacturing sectors in the TiVA database is 17. This is almost certainly too high a level of aggregation for our purposes.
Instead we have constructed two alternative indicators, each of which uses detailed HS 6-digit information on firm-level imports and exports. For each firm, we look at the relationship between the imported inputs of that firm, and the exports of that firm, and then aggregate this to the HS 6-digit level:
a) Weighted Import–Export Ratio (WIER): For each firm, we take each of their 6-digit exports and for each of these we calculate the HS 4 level import/export ratio. Then, we aggregate at the 6-digit product level, weighting by the firms’ 6-digit exports, and then aggregate across firms at the HS 6-digit product level to derive our variable at the HS 6-digit level. We would expect a negative relationship between this measure and preference utilization, since the higher the share of imported inputs from within the same heading, the less likely it is that the firm may be able to conform to the CTC or the VA rule.
b) CTC Share Value: For each firm–product 6-digit export, we identify all those flows where the firm's imports within an HS 4-digit heading are 30% or more of the value of its exports of the 6-digit product which falls within that 4-digit heading.Footnote 13 For each 6-digit category, we then aggregate this firm-level information and calculate the share of exports for which the CTC share value is 30% or more. Similar to the WIER, we expect that the larger this share value, the lower the preference utilization for a particular HS 6-digit product.
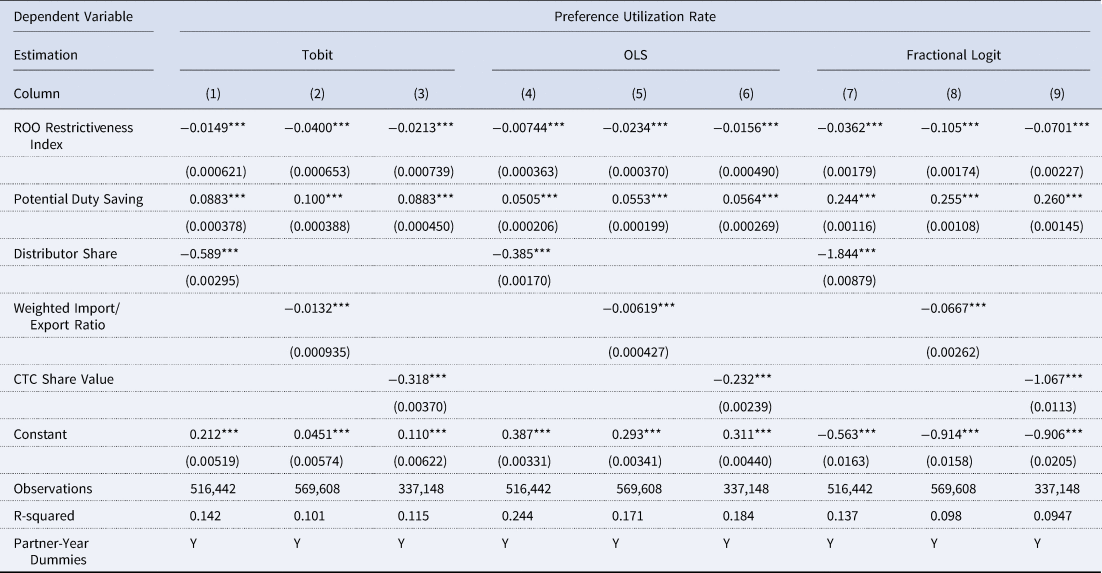
Table 4 presents the results from these ratios comparing across econometric approaches as previously. Each of the three variables confirm the hypothesized negative and significant coefficients. A 1 percentage point larger distributor share at the 6-digit product level is associated with a lower preference utilization rate, with an effect of up to 0.45 (FL) percentage points. A similar interpretation can be given for the ratios controlling for international supply chain integration, with negative effects up to 0.016 (FL) percentage points for the weighted import/export ratio, and up to 0.265 (FL) percentage points for the CTC share value. Note that our main determinants of preference utilization,  $ROO{\rm \_}RI_i$ and $ln{\rm \_}pds_{ijm}$, maintain their sign and significance, albeit with a slightly smaller magnitude. Note too that our sample becomes reduced by including those ratios into our specifications, since they are not available for all HS 6-digit products.
Table 4. Estimation results: producer, distributors and supply chains (January 2021 – August 2022)
Robust standard errors in parentheses.
*Denotes statistical significance at the 10% level
**Denotes statistical significance at the 5% level;
*** Denotes statistical significance at the 1% level.
Adjusted R-squared reported in Columns (4)–(6) (OLS); Pseudo R-squared reported in Columns (1)–(3) (Tobit), (7)–(9) (Fractional Logit).
6. Conclusions
ROOs are complex and hard to compare across FTAs. If a firm aims to trade with a country offering preferential treatment to its products, it must decide whether or not to bear the cost of complying with ROO requirements, thereby claiming preferential tariffs. If that cost is higher than the potential duty savings, it may decide to pay the MFN tariff. Hence, the degree to which firms request preferential treatment will depend on the restrictiveness of the ROOs.
Using monthly product-country level data on EU imports from the UK, we examine how the restrictiveness of the ROOs that came into force under the TCA has impacted on the use of preferential tariffs by UK firms in the EU market. For that purpose, we construct a ROO − RI at the HS 6-digit product level, ranging from 1 to 10, thus extending the exercise undertaken by Cadot et al. (Reference Cadot, Carrère, De Melo and Tumurchudur2006).
Overall, we find a moderate degree of ROO restrictiveness across HS 6-digit products under the TCA (score of 4.32), with industries such as textiles, automotive, and materials having products with the largest degree of complexity in their rules. Preference utilization, measured as the ratio of UK imports actually enjoying zero preferential tariffs in the EU market relative to all UK imports eligible to preferential zero rates in the EU, has risen since January 2021. Agrifood products tend to have the largest PUR. Such rates are also positively correlated with the EU Common External Tariff that firms must pay if not complying with ROOs.
Our econometric estimations find that higher ROO − RI scores are associated with lower PURs, that relation being more evident for consumption goods and, to a lower extent, for capital and intermediate goods. Conversely, larger potential duty savings, as a proxy for benefits of complying with ROO, are associated with a larger degree of preference utilization.
We are aware that the ROO–RI, as with any index, is an approximation and the same rule may well have a different degree of restrictiveness across products or even across firms for a given product. This will depend on several factors such as the product's nature, the production process involved and firm characteristics. This may be particularly so for the wholly obtained (WO) and SP processes rules.
While the TCA is notionally a tariff free and quota free agreement, this is only to the extent that firms are able to and choose to demonstrate compliance with ROOs. It is therefore not surprising that restrictiveness of ROOs impacts on preference utilization rates. Our results give some indication of the extent to which this is the case, suggesting that increasing the degree of restrictiveness by 1 point (on our scale of 1–10) reduces utilization by between 1.3 and 3.1 percentage points.
There is more that needs to be understood and explored with regard to the impact of ROOs on trade. From a policy perspective, it would be interesting to understand better the restrictiveness of different ROOs for the same product or industry. For any given FTA, such as our focus here on the TCA, this is impossible to assess empirically, and such an analysis requires comparison across agreements where the ROOs vary for any given product. A key further step would be to undertake the analysis using more detailed firm level data. We leave this to future research, as well as the issue of understanding better the costs of compliance and their impact, over time, on the use of preferences by firms arising from FTAs.
Acknowledgements
We are very grateful for feedback and comments on earlier drafts of this work, which has greatly helped to improve the final product. This includes colleagues participating in seminars at the UK Trade Policy Observatory, Sussex University; UK government policy makers in the Department for Business, Energy and Industrial Strategy (BEIS); participants at the conference held in Florence in September 2022 which underpins this special issue, and with special thanks to Jaime de Melo for his written feedback; and of course to the referees and editors of this special edition whose input was extremely useful. We are particularly grateful to Alan Winters for his advice, encouragement, and support not just with regard to this paper, but our broader research as well.


 Open access