


Introduction
Ideology has long been understood to play an important role in executive behavior. Spatial models of legislative policy making hold a large role for executive preferences (Krehbiel Reference Krehbiel1998), and at both the state and federal levels, there is reason to believe executives wield more influence still over the bureaucracy (Clinton, Lewis, and Selin Reference Clinton, Lewis. and Selin2014; Woods and Baranowski Reference Woods and Baranowski2007; Wood and Waterman Reference Wood and Waterman1991).
However, two realities have kept scholars from exploring the effect of executive ideology fully. Measurement challenges are the primary obstacle, rooted in the fact that executives make distinct decisions from other actors. They do not cast votes, for example, on the same bills as legislators do, decide on the same cases as judges do, or answer the same survey questions as constituents do. This makes placing them on a common ideological scale difficult. Recognizing this problem, a handful of scholars have proposed workarounds (Bailey Reference Bailey2007; Poole and Rosenthal Reference Poole and Rosenthal2011; Treier Reference Treier2010; Zupan Reference Zupan1992). Nevertheless, the literature on executive ideology remains thin compared to parallel literatures on judicial and legislative preferences, and most studies omit ideology as a predictor of executive behavior, instead of focusing on differences by party (see Barrilleaux and Berkman Reference Barrilleaux and Berkman.2003; Kelly and Witko Reference Kelly and Witko2014; Leigh Reference Leigh2008). A governor’s party may be a reasonable proxy, but it assumes away within-party ideological differences, which in turn may leave scholars with an incomplete picture of executive behavior.
The secondary reason for our lack of knowledge stems from the discipline’s greater historical emphasis on the presidency as opposed to subnational executives (Klarner and Karch Reference Klarner and Karch2008; Squire and Fastnow Reference Squire and Fastnow.1994). While the president’s power and profile may justify this emphasis, the fact that only one president serves at a time makes it difficult to counterfactually estimate the effect of ideology on executive behavior. As Kousser and Phillips (Reference Kousser and Phillips2012, 6) have previously argued, studying governors is an effective way of learning about executives in general. Their offices are similar enough in nature to facilitate cross-sectional analysis, and high enough in profile that data on their behaviors and governing contexts are accessible to researchers. These features allow us to examine the correlates of executive behavior and the conditions and issue domains under which executive power is greatest.
In the first part of this article, I review five ways in which researchers can measure gubernatorial ideology. Of them, two stand out as most promising. Scores derived from governors’ annual addresses to their state legislatures—known as State of the State speeches—provide the most distinctive information about these actors’ preferences when compared to other measures. But data on these speeches are currently limited. Rather, for researchers today, Bonica’s (Reference Bonica2014) campaign finance-based measures of ideology, or CFscores, emerge as the most accessible and versatile option. CFscores provide data coverage for the largest share of governors from 1991 onward, and they are constructed to allow direct comparisons between governors and other actors of interest—such as state legislators, judges, and big-dollar donors.
The second part of the article addresses concerns that scholars have had with CFscores. Prior research has questioned whether they are powerful enough indicators to distinguish among members of the same party (Tausanovitch and Warshaw Reference Tausanovitch and Warshaw2017). In the gubernatorial context, I demonstrate that they are by associating CFscores with other measures of ideology and governors’ decisions while in office. Notably, however, the scores appear to be more indicative among Democrats than Republicans.
Finally, I turn to a substantive question: is executive ideology worth studying independently of partisanship? Four models of state policy liberalism suggest that executive ideology may be central to the policy-making process. Gubernatorial preferences explain as much or more variation in state policy liberalism as legislative ideology, and two to eight times more than public opinion.
Taken as a whole, this article encourages further research on executive ideology in state politics. In CFscores, the data to conduct this research are available and of good quality. They exist on a common scale with scores for other actors, allowing scholars to test spatial models that have been rarely applied beyond the federal level. Opportunities for further data collection and curation (e.g., of State of the State speeches) are relatively clear-cut. The substantive justification for this work is clear, as executives appear to have considerable influence over policy outcomes. The pieces are in place for scholars to learn much more than was previously possible about how executives function.
Measuring Executive Ideology
Ideology plays a central role in formal models of political behavior and policy making (e.g., Arrow Reference Arrow1951; Downs Reference Downs1957; Krehbiel Reference Krehbiel1998). Today, political science features an abundance of ideological measures for actors as disparate as legislators (McCarty, Poole, and Rosenthal Reference McCarty, Poole and Rosenthal2001), judges (Bailey Reference Bailey2013), political parties (Bakker et al. Reference Bakker, De Vries, Edwards, Hooghe, Jolly, Marks and Vachudova2015), and the public at large (Berry et al. Reference Berry, Ringquist, Fording and Hanson.1998; Enns and Koch Reference Enns and Koch.2013).
But scholars have found it relatively more difficult to create measures of executive ideology. The main challenge is a lack of immediate comparability. By definition, executives are at the head of a system of government, whether that system is national, state, or local in scope. As a result, each executive operates in his or her own political context, which makes comparing them with one another difficult, to say nothing of the task of comparing them with other actors.
In this section, I review a handful of options that are available to scholars interested in measuring executive preferences. Some are more developed than others; some cover a wider set of years and actors than others. A discussion of their strengths and limitations—particularly as they apply to the gubernatorial setting—leads me to two conclusions.
The first is that CFscores appear to be the most viable measure of executive ideology today. These scores provide good data coverage and are unique in their ability to place of executives on the same scale as other actors. Because of this, the sections that follow are devoted to exploring, validating, and applying CFscores.
The second conclusion is more forward-looking, urging scholars to explore another option for measuring ideology: text analysis of State of the State addresses. To date, this approach has only been applied to a small set of speeches. But the ideological measures derived from these analyses appear to capture a distinct element of executive preferences, suggesting that additional work can yield large dividends when it comes to understanding state politics and executive behavior.
Measurement Options
Before arriving at recommendations on what scholars “should” do, it is worth reviewing what they can do in terms of measuring executive ideology. A small handful of options exist for scholars interested in gauging executive preferences. These options can be loosely sorted into two categories: those that derive from direct observations of executive behavior, and those that place executives on a scale based on the informed perceptions of others (such as donors, media, or citizens).
Research on the US presidency, which accounts for the bulk of American politics research into executives, has taken the direct observation approach. McCarty and Poole (Reference McCarty and Poole1995) consulted Congressional Quarterly records to identify bills on which the White House had expressed a “yea” or “nay” option, and estimated DW-NOMINATE scores for the president as if these statements were votes. Treier (Reference Treier2010) augmented this approach by incorporating bill signings and vetoes as votes in favor and opposed, respectively.
For the study of subnational executives, this approach may not be ideal. Theoretically, this approach takes as missing data the subset of legislation that executives neither sign nor veto nor comment on, and it is highly unlikely that these data are missing at random. Practically, applying this approach at the subnational level—to allow cross-sectional comparisons between executives—would constitute a gargantuan data collection task.
For state politics scholars wishing to directly observe executive preferences, a very different source of data has emerged as promising. Each year, governors across the country deliver speeches to their state legislatures, outlining their priorities for the year ahead. Most commonly referred to as State of the State speeches, scholars have used these documents to quantify gubernatorial ideology (Coffey Reference Coffey2005), policy priorities (Heidbreder Reference Heidbreder2012; Kousser and Phillips Reference Kousser and Phillips2012), and conformity with the national parties (Weinburg Reference Weinberg2010). The strength of these data is that they provide indicators “from the horse’s mouth” about a governor’s preferences. They also allow reasonable comparisons across executives, because speeches are delivered at roughly the same time of year, in the same national political, social, and economic contexts. Of course, variation across states is where the direct comparison breaks down: two governors with exactly the same preferences may still deliver different speeches if one’s state has a strong economy and the other’s is lagging; if one has unified control of government and the other must work with the opposition; if one suffers from low approval ratings and the other is popular, and so forth.
Further, on a practical note, relatively few speeches have been collected and analyzed for use by other scholars. In this article, I borrow from the work of Coffey (Reference Coffey2005) and Kousser and Phillips (Reference Kousser and Phillips2012), who identified liberal and conservative proposals in State of the State speeches in 2000, 2001, and 2006. Put together, these data contain enough observations to see how such text-based measures “hang together” with other measures. But for scholars to use these speeches to make generalizable inferences about executive behavior across time, more data collection and curation are required.
A final option for directly observing gubernatorial preferences is via legislative roll-call votes from before they ascended to the governor’s mansion. Even though these estimates are based on politicians’ behavior before they became governor, there is reason to believe their ideology should remain consistent over time. Ambition theory holds that politicians “act today in terms of the electorate [they] hope to win tomorrow” (Berkman Reference Berkman1994; Schlesinger Reference Schlesinger1966), and more generally, scholars have observed consistency in elite ideology; politicians are said to “die with their ideological boots on” (Poole Reference Poole2007). Nevertheless, although this approach directly observes the politician’s preferences, those preferences are a step or more removed from the context in which we are interested, and the data coverage is limited to former legislators. In the data, I work with, from 1991 to 2013, only about one-quarter of governors have DW-NOMINATE or NPAT scores from their service in Congress or state legislatures, respectively (Poole and Rosenthal Reference Poole and Rosenthal2011; Shor and McCarty Reference Shor and McCarty.2011).
Data based on indirect observation—the informed perceptions of others—are more numerous and accessible to scholars. These data come in a few forms, and each is likely to contain similar sources of noise: some individuals are better able to perceive ideology than others and some governors are more easily perceived than others. This noise has the potential to create bias insofar as it systemically leads some types of politicians to be placed to the left or right of their true ideal points.
Two measures provide good data coverage and have received considerable attention from scholars across the subfields of American politics. The first is the campaign finance-based measures of ideology, or CFscores, developed by Bonica (Reference Bonica2014) and made available through DIME, the Database on Ideology, Money, and Elections. CFscores draw on 103 million contributions to state and federal candidates as expressions of ideological preference, and use them to estimate ideology scores for politicians and donors alike based on patterns of “who donates to whom?” Because contributors often donate to candidates in different districts or at different levels of government, these scores theoretically place politicians across a variety of offices on the same ideological scale.
The validity of these scores hinges on the extent to which donor contributions are a reflection of ideological preferences. This has been the subject of discussion. Bonica (Reference Bonica2014) initially demonstrated that, when comparing donor behavior to baseline expectations about purely strategic giving (McCarty et al. Reference McCarty, Poole and Rosenthal2006), almost no donors are uninfluenced by ideology, and ideology-based models of giving are most predictive of behavior. On the other hand, Hill and Huber (Reference Hill and Huber2017) collected survey responses from donors and paired them with CFscores, and found that within parties, CFscores only weakly correlated with a single-factor scaling of donors’ policy positions. In response, alternative models run on the same data have found stronger and more theoretically consistent results (Bonica Reference Bonica2019; Warner Reference Warner2021).
When applied to executive politics, CFscores carry two main benefits. The first is in terms of data coverage. For the period from 1991 to 2013, CFscores are available for 68% of individuals who served as US governors, and most of the missing data is clustered in the 1990s, before campaign finance disclosures were universally required at the state level. Second, CFscores allow governors to be placed on a common scale with other actors for whom ideology scores are generally less accessible, such as state legislators, mayors, and judges. Cross-sectional analyses can allow scholars to test spatial models (e.g., Cooper, Knotts, and Ragusa Reference Cooper, Knotts and Ragusa2016) with a degree of statistical power that is unattainable to scholars focused exclusively on the federal-level politics.
A second option available to scholars is the survey responses of voters who are asked to place candidates on an ideological scale. The Cooperative Election Survey (CES) has included a survey question about the ideology of state governors in most of its waves.Footnote 1 Responses can then be aggregated to create mean voter placements for each governor due to the “wisdom of the crowds” effect (Erikson and Romero Reference Erikson and Romero1990). So long as voter estimates are unbiased and contain a nonzero amount of information, aggregated measures should asymptotically converge on the true value. Of course, the former of these assumptions is unlikely to hold true. For example, in the Trump era, voters conflated ideological moderation among Republicans with a willingness to buck the erstwhile president, even as roll-call votes remained staunchly conservative (Hopkins and Noel Reference Hopkins and Noel2021).
Comparing Measures
When selecting between measures of ideology, two considerations that scholars face are those of data availability and quality. To the former, the review above yields useful answers. Data based on indirect measures—CFscores and voter placements—provide superior data coverage, the former being available from 1991 onward,Footnote 2 and the latter from 2006. As for direct measures, only a few years of State of the State speeches have been analyzed, and roll-call scores are necessarily limited to the minority of governors who have served as legislators.
But what of data quality? Even if one grants that each of these methods is a theoretically sound way of measuring ideology, they likely draw on different elements of that concept. One way of assessing whether measures provide distinct information about a concept is to see how they correlate or “hang together” (Battista Reference Battista2011).
In Table 1, I present the pairwise correlations between the measures of gubernatorial ideology discussed above. For governors with more than one type of measure, I standardized the observations and averaged them together.Footnote 3 While strong correlations may suggest convergent validity (Campbell and Fiske Reference Campbell and Fiske.1959), the value of this exercise is to identify measures that give us substantially different information about governors’ preferences. Where pairwise correlations are strong, we may expect that two measures are providing similar information. Where they are weaker, we may infer that they are providing different information, so long as both are theoretically viable ways of measuring the concept.
Table 1. Pairwise correlations between measures of gubernatorial ideology

Note. Cells indicate Pearson’s r correlations. Data collected on governors from 1991 to 2013 with CFscores.
* p < 0.05.
The results in Table 1 indicate that the pairwise correlations between CFscores, voter placements, and legislative roll-call are all very strong. This does not mean that their biases or the information they provide are necessarily the same, but that what we can tell from one measure, we can probably also tell from the others.
By contrast, the scores derived from governors’ State of the State addresses only moderately correlate with the others. This suggests that the policies proposed in those speeches constitute information about executive ideology that may be missing from the other measures.
Combining Measures
One option that scholars may wish to consider is to combine measures to maximize the amount of information about gubernatorial ideology in a single metric. This does, however, involve a trade-off. Because the data coverage of these measures is incomplete, and particularly so for the State of the State scores, the added information must offset the information lost by excluding some observations.
In the Supplementary Materials, I explore this trade-off by alternatively combining CFscores with voter placements and State of the State scores. I find that the combined measures generally do no better at explaining a small set of behavioral and policy outcomes than do CFscores alone. These models are too few and limited to provide a clear or direct interpretation. But they do suggest that CFscores are efficient enough as measures that they capture the “true” relationship between ideology and these outcomes at relatively small sample sizes.Footnote 4 Reducing the sample size to combine measures may not be a worthwhile trade-off unless a scholar’s research design provides a known reason for which the information in CFscores ought to be supplemented.
Of course, this trade-off can be avoided entirely by additional data collection work on the part of state politics scholars. State of the State speeches are in the public record, and transcripts are usually (but not always) available on state government websites or from local media outlets.Footnote 5 Analysis of these documents can allow scholars to create a more complete set of State of the State-based ideology measures.
CFscores: Availability and Versatility
At present, however, CFscores provide the best data coverage of available measures. For the period running from 1991 to 2013, in which Bonica (Reference Bonica2014) collected data on state-level elections, a total of 223 individuals served as governors of US states. Of these, 152 have CFscores. There are a few reasons why governors may not be assigned scores. First, it was not until 2001 that all states required that candidates for state and local offices disclose their contributions. Without these disclosures, no CFscores are possible. Second, in some cases, governors are not elected to the office, but rather ascend to it after their predecessor dies or resigns. If those individuals do not then seek reelection, they are not assigned a CFscore. In addition, it is feasible that a fully self-funded candidate would not have a CFscore, but none exists among the governors in this timespan (Table 2).
Table 2. Availability of CFscores for governors (1991–2013)

a And did not run for reelection.
Imperfect data coverage can be a problem if there are systemic differences between governors with and without CFscores. To test this, I conducted a series of t-tests that can be found in the Supplementary Materials. I find that the groups are the same in terms of partisanship, gender, and race. The only minor difference that exists is by region: governors from the American West are somewhat more likely to have CFscores than those from elsewhere.
In addition to the superior data coverage of CFscores over other measures, they also claim the unique benefit of placing governors on the same scale as state legislators and judges. If validated, this would allow scholars to conduct cross-sectional analyses of spatial models (e.g., Krehbiel Reference Krehbiel1998) that have primarily been tested at the federal level only.
But the question of validity looms large. Previous research has cast doubt on the usefulness of CFscores for distinguishing between members of the same party (Tausanovitch and Warshaw Reference Tausanovitch and Warshaw2017, but see Bonica Reference Bonica2019). The construction of state-level CFscores may accentuate those concerns. As such, I proceed by examining whether CFscores can meaningfully between moderates and extremists within each party.
Validating CFscores for Members of the Same Party
Because donors give money in part for instrumental reasons, CFscores promise to be a theoretically viable way of measuring elite ideology. Even within parties, as Bonica (Reference Bonica2019, 332) has contended, “the decision to donate to Elizabeth Warren rather than Joe Manchin (or to Ted Cruz rather than Susan Collins) is an informative signal.” When applied to gold-standard indicators of ideology, such as Congressional roll-call votes, this face validity has translated to convergent validity. Within each party caucus in Congress, CFscores and DW-NOMINATE scores correlate at levels ranging from r = 0.56 and r = 0.72.
But as other scholars have noted, in a polarized era, partisanship may be explaining more and more of elite behavior (Andris et al. Reference Andris, Lee, Hamilton, Martino, Gunning and Selden2015), to the point that a very sensitive and precise measure of ideology may be needed to ascertain its role in explaining outcomes. Tausanovitch and Warshaw (Reference Tausanovitch and Warshaw2017) questioned whether CFscores were up to this task, showing that when used to predict roll-call votes, the resulting classification rate was only a 1% improvement over that which was achieved using partisanship alone (but see Bonica Reference Bonica2018).
The construction of CFscores for governors, in particular, may give scholars additional pause. CFscores are created via multiple rounds of scaling based on matrices that indicate how much donor i contributed to candidate j. The first scaling focuses only on federal candidates; then, CFscores for state-level candidates are tied to those of federal candidates from the same state. Although later rounds scale across states, the paucity of donors who give to state or local races in multiple states—as well as the centrality of federal elections in CFscore construction—raise the question of whether CFscores are as informative for governors as they are for members of Congress.
To address the concern that CFscores are valid measures within each party, I turn to two forms of validation. The first is convergent validation, or comparing a measure with others that purport to measure the same concept. If the measures correlate, they provide evidence to one another that the same concept is indeed being quantified (Campbell and Fiske Reference Campbell and Fiske.1959). Another method of validating a measure is to determine whether it predicts future behavior in the way we would expect (Cronbach and Meehl Reference Cronbach and Meehl.1955). CFscores are based on donation patterns that occur before a politician has assumed office.Footnote 6 Do they predict the politician’s behavior once they become governor?
I begin with convergent validation, turning back to two of the alternative measures of gubernatorial ideology that I presented in the last section. These are legislative roll-call ideology scores and voter placements on the CCES.
Fifty-nine governors with CFscores served in either Congress, a state legislature, or both before entering the governor’s mansion and were assigned either a NOMINATE score (Poole and Rosenthal Reference Poole and Rosenthal2011) based on their Congressional roll-call votes, or an NPAT score (Shor and McCarty Reference Shor and McCarty.2011) based on their state legislative votes.
Meanwhile, 102 governors with CFscores have been placed on an ideological scale by respondents to the Cooperative Election Study. I separate these voter placements out based on the scale that was used. As of 2006, the CES asked citizens to place their governor on a scale of 0–100; from 2010 onward, it asked them to use a seven-point ideology scale with one being the most liberal and seven most conservative.
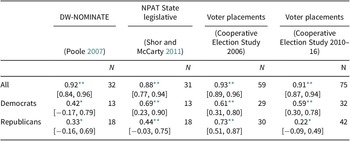
To compare these measures to CFscores, I calculate the Pearson’s correlation coefficient between them, and the corresponding 95% intervals. The results of these exercises are presented in Table 3. The headings indicate the source and data used in each of the four exercises. The first row indicates the Pearson’s r when calculated among all governors for whom data were available. We can see that the average correlation appears to be around r = 0.9 and even the smallest lower-bound estimate is 0.77. This indicates that CFscores distinguish between liberal and conservative governors very well.
Table 3. Pearson’s correlations between governors’ CFscores and alternative ideological measurements

Note. Brackets contain 95% confidence intervals.
* p < 0.10;
** p < 0.05, one-tailed.
The second row indicates the Pearson’s r coefficients among only Democratic governors. The average correlation is r = 0.58, and despite the small sample sizes, all of the correlations are significant at p < 0.10 and three of them at p < 0.05 (one-tailed). These results indicate that CFscores do a good job of distinguishing between moderates and extremists among Democratic governors. The third row focuses on Republican governors. This set of results is the weakest, with an average correlation of r = 0.43, but all demonstrate some degree of significance that the correlation is greater than zero. This tells us that CFscores likely capture at least some of the heterogeneity among these executives.Footnote 7
Studies of predictive validity can tell us more about whether CFscores are useful measures of ideology when partisanship is held constant. First, I use CFscores to predict the balance of liberal and conservative policy proposals in State of the State speeches. As discussed previously, two scholarly treatments have analyzed these speeches for the ideological direction of their proposals. Coffey (Reference Coffey2005) studied 93 speeches given in 2000 and 2001, coding each proposal as a −1 if it was liberal or a 1 if it was conservative, and averaging proposals together to create a policy score. Kousser and Phillips (Reference Kousser and Phillips2012) coded speeches given by 48 governors in the years 2001 and 2006, and I have used their dataset of State of the State proposals to create a policy score similar to Coffey’s (Reference Coffey2005).Footnote 8 To augment my sample size, I standardized both of these scores and treated them as the same measure, averaging them together for governors whose speeches were studied in both pieces.
Table 4 gives us a different look at how CFscores operate within parties. The coefficients indicate the effect of a one-unit shift rightward, as measured by CFscores, on the standardized balance of State of the State policy scores, where higher values indicate greater conservatism. As in the convergent validation, we see that CFscores tell us more about Democrats than Republicans, as an extra point corresponds with 0.78 standard deviations of conservatism in State of the State policy proposals. On the Republican side, the coefficient is not significant, but points in the expected direction. With a greater sample size, it seems reasonable to expect that CFscores would predict Republican proposals significantly, but this also suggests that the scores are only somewhat indicative of executive preferences within the GOP.
Table 4. Linear relationship between CFscores and State of the State policy scores

Note. Numbers indicate OLS coefficients. Dependent variable refers to standardized policy scores, derived from mean of speech proposals where liberal was coded as −1, conservative as 1, and neutral as 0.
* p < 0.05, one-tailed.
My second source of data examines CFscores in comparison to a governor’s actions on LGBT rights. Sellers’ (Reference Sellers2017) examined the conditions under which governors signed laws or orders to protect the LGBT community from employment discrimination.Footnote 9 His dataset provides an indication of gubernatorial action or inaction on the issue for each state-year from 1971 to 2013.
I compare CFscores to a dummy variable for whether (1) or not (0) a governor signed LGBT protections into law, given that none were in place when they took office. Sellers (Reference Sellers2017) breaks these protections into two types, both of which protect citizens from employment discrimination. The first protects individuals on the basis of sexual orientation (LGB citizens), and the second protects them on the basis of gender identity (trans citizens). These issues provide useful examples for validating ideology because they confound partisan divides to a degree. A large minority of Democrats declined to protect LGBT rights, while a small handful of Republicans and independents did so against partisan expectation.
Table 5 presents the linear relationship between CFscores and signing legislation or an executive order to protect LGBT employment rights. The models are run as OLS despite the binary dependent variable for ease of interpretation; all results replicate when a logit is used.
Table 5. Linear relationship between CFscores and action to protect LGBT rights

Note. Cell entries indicate OLS coefficients. Dependent variable is whether (1) or not (0) a governor signed a bill or executive order to protect citizens from employment discrimination on the basis of sexual orientation or gender identity.
* p < 0.05.
** p < 0.10, one-tailed.
Because CFscores get higher with greater conservatism, the negative relationships we see are as expected. Ideology appears to be particularly influential on the subject of sexual orientation, where a one-unit shift to the right in CFscores led Democratic governors to be roughly 73% less likely to sign protections, and Republicans to be 42% less likely. Notably, the relationships across all four models are significant at p < 0.05 in the expected direction.
Taken as a whole, what do these exercises in convergent and predictive validation tell us? Even when separating out by party, CFscores can help scholars to distinguish between liberal, moderate, and conservative governors. Each of these exercises produced significant results in the expected directions. Across them, a partisan asymmetry did appear. CFscores seem to be more indicative for Democrats than for Republicans. Scholars interested in the behavior of GOP executives, in particular, then, should attempt to construct models with a large enough sample size that the “true” effect of ideology can be seen, given that CFscores may be a less efficient measure for this subgroup.
Having established their validity within parties, it is now time to establish what CFscores can tell us about gubernatorial ideology, and its relative importance in the policy process.
What Do CFscores Tell Us About Gubernatorial Ideology?
Because CFscores provide good data coverage from the 1990s to early 2010s, and have proven to be indicative of preferences even within parties, a descriptive analysis of these scores gives us the first glimpse at how gubernatorial ideology has been distributed and has changed in recent decades.
To provide some context, CFscores for are scaled from −2 (most liberal) to +2 (most conservative), but the range observed among governors is narrower, from −1.45 (Howard Dean of Vermont) to +1.35 (Jack Dalrymple of North Dakota).
The distribution of governors between these extremes is presented in the histogram in Figure 1. Blue bars indicate the number of Democratic governors whose CFscores fall in each interval of 0.25. Red bars indicate the number of Republican governors whose CFscores fall in each interval, and the yellow bars do the same for the four independent governors in this dataset.Footnote 10

Figure 1. CF scores of US governor by party, 1991–2013.
Looking at Figure 1, one notices that although ideology and partisanship correlate, they are not one and the same. The parties’ modal intervals are equidistant from the centerpoint of 0. The largest number of Democrats have scores between −0.75 and −1.0, and the largest number of Republicans have scores between 0.75 and 1.0. However, many governors have CFscores well to the left or right of their party’s modal interval. Finally, we observe some ideological overlap between the parties. Eight Republicans have more liberal scores than the most conservative Democrat, and 13 Democrats are more conservative than the most liberal Republican. These include GOP governors of traditionally Democratic states, such as George Pataki of New York and M. Jodi Rell of Connecticut, and Democratic governors of more conservative states, such as Kathleen Blanco of Louisiana and Phil Bresden of Tennessee.
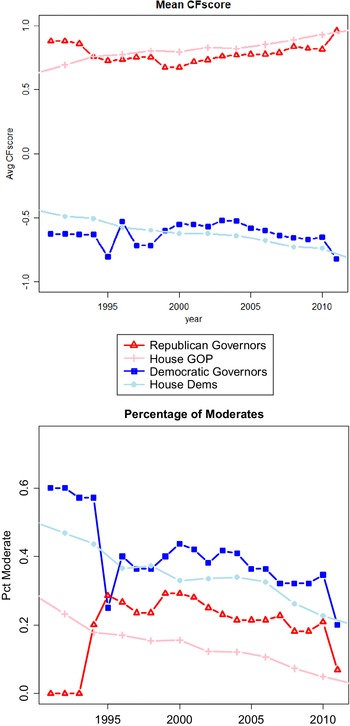
CFscores can also tell us how gubernatorial ideology has changed over time. In Figure 2, I present ideological trends for governors and (by way of comparison) members of US House, separated out by party. The left-hand panel presents the mean CFscore for each group by year, and the right-hand panel presents the percentage of moderates in each group, operationalized as a CFscore between −0.50 and 0.50.

Figure 2. Ideology of governors and US house members by party.
Note. “Moderate” operationalized as CFscore greater than −0.50 for Dems and less than 0.50 for Republicans. Gubernatorial CFscores are only available for a handful of states from 1991 to 1995; full coverage begins in 2002.
A look at mean CFscores, on the left of Figure 2, shows that polarization in Congress was a steadier trend through the late 1990s and 2000s than it was in US governor’s mansions. But, at the end of the time series, we see governors of both parties “catching up” to the mean member of Congress in terms of ideological extremity.
Mean values, however, can only tell us so much. The right-hand panel gives us a glimpse of the ideological distribution of governors; particularly, the percentage in any year who can be considered “moderate.” From 1994 to 2010, a larger share of governors was moderate than US House members, but this changed abruptly after the 2010 midterm elections, when the number of moderate governors to win election plummeted to fewer than one-in-four Democrats and one-in-six Republicans.
It is also notable that, throughout the time series, there were consistently fewer Republican than Democratic moderates among governors. This mirrors findings of asymmetric polarization in Congressional roll-call votes (Butler Reference Butler2009), showing that from the 1980s to the 2000s, Republican members of Congress veered to the right faster than Democrats moved left. From the graphics, it appears likely that this trend may have occurred at the state level as well.
Having now observed the heterogeneity in CFscores, even within parties, and how this has changed over time, it is now time to ask the bigger substantive question: “Does executive ideology matter when it comes to shaping policy outcomes?”
Is Executive Ideology Important for Understanding Policy?
In the previous sections, I provided an overview of the options available for measuring executive ideology. After identifying CFscores as the best option for scholars, I then demonstrated that they can distinguish between members of the same party, and used that knowledge to present descriptive statistics about the distribution of gubernatorial ideology and how it has changed over time.
For scholars wishing to research this issue specifically, the above analysis will be valuable. But for a broader audience, the “so what?” question remains unanswered. This question can take both broad and specific forms. Broadly speaking, are we sure that executives are central to the policy-making process, such that it is worth paying attention to their ideology? More narrowly, can it tell us that much more than partisanship, to the point that scholars should add measures of ideology into their models of elite behavior or policy outcomes?
To respond to these questions, I run models that explain state policy liberalism as a function of executive, legislative, and public ideology. The models are separated out based on gubernatorial partisanship, so that only Democrats are compared to Democrats, and likewise with Republicans.
If executive ideology emerges as central to explaining policy liberalism, then we can at once make a claim about the general importance of executives in policy making, and the specific value of incorporating ideology into models alongside partisanship. If the results are null or underwhelming, then executive ideology may not have a large direct impact, at least not independently of partisanship.
The data on policy outcomes are from Caughey and Warshaw’s (Reference Caughey and Warshaw2016) measures of state policy liberalism from 1936 to 2014. Their scores are based on a scaling of 148 policies, separated into economic and social policy domains. As the authors note, year-over-year changes in policy are generally very small—and in all but two states, governors serve four-year terms—so I limit my analysis to even-numbered years between 1991 and 2011 for which data on gubernatorial, state legislative, and citizen ideology are available.Footnote 11 To assist with interpretability, I then standardize all policy and ideology scores to have a mean of 0 and standard deviation of 1, and reverse measures of gubernatorial and legislative ideology so that positive values indicate liberalism across all variables.
The result is a panelized dataset reflecting the policy and political contexts in 50 states. Because of missing data, the panel is unbalanced. Each state is represented by between three and nine timepoints, and the median has seven.
I estimate four models using random effects. A random effects model is one that offers a middle ground between a pooled OLS, which considers all observations together even if they represent the same year or state, and a fixed-effects model, which estimates a separate intercept for each state and thereby limits the analysis to within-state variation. Random effects models are given by the following equation:
 $$ {y}_{\mathrm{i}\mathrm{t}}-\lambda {\overline{y}}_{\mathrm{i}}=\beta ({X}_{\mathrm{i}\mathrm{t}}-\lambda {\overline{X}}_{\mathrm{i}})+({v}_{\mathrm{i}\mathrm{t}}-\lambda {v}_i), $$
where y
it and X
it represent values of the dependent and (all) independent variables, respectively, for unit i at time t, and ȳi and $ {\overline{X}}_{\mathrm{i}} $
are the mean values for unit i across all times. The unit-specific intercept, or fixed effect, is represented by vi and the ordinary error term by v
it. The key to these models is the parameter λ (“lambda”). When λ is close to 0, the model becomes a pooled OLS, because unit-level means are multiplied by 0 and thus ignored by the model, and observations are freely compared across units. When λ is close to 1, it becomes a fixed-effects model, because a within-unit intercept is included at full strength, and observations are only compared to within-unit means.
$ {\overline{X}}_{\mathrm{i}} $
are the mean values for unit i across all times. The unit-specific intercept, or fixed effect, is represented by vi and the ordinary error term by v
it. The key to these models is the parameter λ (“lambda”). When λ is close to 0, the model becomes a pooled OLS, because unit-level means are multiplied by 0 and thus ignored by the model, and observations are freely compared across units. When λ is close to 1, it becomes a fixed-effects model, because a within-unit intercept is included at full strength, and observations are only compared to within-unit means.
With this in mind, random effects models essentially “weigh” or “privilege” within-unit over between-unit variation to a degree specified by λ. This parameter is, in turn, calculated in such a way that as unit intercepts explain more of Y, then λ becomes larger and the model increasingly resembles a fixed-effects model.Footnote 12 This is useful in state politics research. Most dependent variables are unlikely to change much year-over-year; here, a state’s policy liberalism at t should correlate highly with its liberalism at t + 1. When this is the case, random effects models will operate with a relatively high value for λ, ensuring that within-state variation is much more important than between-state variation when calculating coefficients. Indeed, across all four models that I estimate, the median value for λ is 0.85.
In the Supplementary Materials, I discuss modeling with gubernatorial CFscores at greater length. One notable limitation is that they may not be well suited to traditional fixed-effects models. Because CFscores are not recalculated for governors after they take first office, fixed-effects models that use them may suffer bias due to dynamic misspecification (treating a quantity that changes over time as static, see Plümper and Troeger Reference Plümper and Troeger2019). Also, in expectation, the scores are relatively inefficient compared to other common covariates (it takes a more data to see “true” relationships), meaning that eliminating their across-unit variance with fixed effects is extra likely to yield null results.Footnote 13 These concerns and partial solutions are discussed in greater length in the Supplementary Materials.
Here, for transparency, I note that when I estimate the models below using fixed effects, most results return as null. This may widen the bounds of uncertainty over the exact role of executive ideology. But with λ always above 0.69 in the random effects models, we can also see the latter as acting with enough similarity to fixed-effects models that within-unit distinctions are largely accounted for.
The results of my random effects models are presented in Table 6. The dependent variable is state policy liberalism by state-year, and the independent variables reflect the state-level values for executive, legislative, and public ideology in the same year.
Table 6. The effects of executive, legislative and citizen ideology on social and economic policy

Note. Brackets contain standard errors. Policy and ideology scores standardized to mean = 0 and standard deviation = 1, with positive scores indicating greater liberalism. Model estimated with random effects. Data represent policy, politics, and public opinion in 50 states, measured biannually from 1991 to 2011.
* p < 0.05, one-tailed.
In all four models, executive ideology explains significant variation in public policy across the 50 states in this analysis. More importantly, executive preferences seem to explain more policy variation—at least in some contexts—than those of the legislature and mass public. Across all four models, the governor’s ideology is estimated to have between 2 and 8 times greater an effect on policy than that of the mass public. Executive influence relative to that of the legislature is more conditional. When Republicans are in office, executive and legislative ideologies appear to wield roughly equal influence. But when Democrats control the governor’s mansion, a one-standard-deviation shift in executive ideology associates with twice as much policy change as a similar shift in the legislature.
What can we take away from these models? On one hand, they are suggestive of a blind spot in American politics research. For the scores of studies that have been published on measuring the effects of legislative and citizen ideology on policy, there is at least topline evidence to suggest that executive preferences carry as much or greater weight.
On the other hand, it is important to highlight the preliminary nature of this analysis. The models are not intended to exhaustively explain state policy, but rather simply to compare executive preferences to those of other important actors. Other forces from interest groups to citizen demographics to institutional features are known to play a major role in policy outcomes. Future studies should incorporate some of these factors to see how they affect the significance of executive ideology. If the governor’s influence wanes when other factors are considered, then it may provide evidence for interesting narratives about how executives are constrained by constituent groups or coalition partners. If executive ideology remains a strong force, or even zaps the significance of other factors, then the literature should devote greater attention yet to the role of executives over the policy process.
Conclusion
This study advocates for greater attention to the role of executives generally, and to their ideological preferences in particular, as a determinant of policy and political outcomes. Previous efforts to study executive ideology have been limited by the challenge of measuring executive preferences. Because executives are at the head of their own level of government, and often make decisions unilaterally, it is hard to compare them to one another or to other actors. I review a variety of solutions to this problem, and focus on CFscores as providing ample data coverage and quality. Using these scores, I provide a preliminary comparison of how executive preferences compare to those of the legislature and the mass public in terms of predicting policy. Across four models, executives appeared to wield greatest influence relative to the other groups.
Future work on this subject may take two tracks. The first, proposed in the previous section, is to incorporate additional factors into models of policy making to examine the conditions under which executive preferences wax or wane. Scholars may also wish to use CFscores to create more sophisticated models of interbranch relations, seeing as the scores provide measurements of legislative and judicial preferences as well. The second, which relate to the limitations of CFscores, may seek to explore why they meet expectations or predict behavior better for some governors than others. Given the scores’ limitations, there is also value in the development of additional measures. An expansion of State of the State-based policy scores (Coffey Reference Coffey2005; Kousser and Phillips Reference Kousser and Phillips2012) can provide an alternative method of measuring executive preferences that is available for all governors over a long stretch of time.
Taken as a whole, this piece intends to facilitate further research into the executive preferences and power. Given their apparent impact and the growing availability of data regarding executives, it seems likely that political science will experience a windfall of insights about these politicians in the near future.
Supplementary Materials
To view supplementary material for this article, please visit http://doi.org/10.1017/spq.2021.34.
Data Availability Statement
Replication materials are available on SPPQ Dataverse at https://dataverse.unc.edu/dataset.xhtml?persistentId=doi:10.15139/S3/NK8O3Z (Warner Reference Warner2022).
Acknowledgments
I would like to thank Eric Plutzer for providing multiple rounds of feedback on this manuscript, Ray Block for his help in the publication process, Justin Phillips for making available his data on State of the State speeches, the Graduate Studies Committee at Penn State for supporting this project with a summer research grant, and the reviewers and editors for their helpful comments.
Funding Statement
The author received no financial support for the research, authorship, and/or publication of this article.
Conflict of Interest
The author declared no potential conflicts of interest with respect to the research, authorship, and/or publication of this article.
Author Biography
Seth Warner is a PhD candidate in the Department of Political Science at Penn State University.


 Open access