

Introduction
The Chinese welfare system has undergone dramatic changes over the past thirty-five years. Recent research into its size, structure and redistributive effects suggests that the Chinese welfare system has diverged into three divided systems: the more generous and progressive urban system, the minimal and regressive rural system and the growing yet still small and regressive migrant system (Shue and Wong, Reference Shue and Wong2007; Shi, Reference Shi2012; Gao, Yang et al., Reference Gao, Yang and Li2013; Frazier, Reference Frazier2014; Li and Sicular, Reference Li and Sicular2014).
One challenge faced by most existing studies is the lack of information on health and education benefits in survey data. Health and education are two of the largest and most important components of social welfare systems across countries. However, different from cash transfers, they are mostly in-kind and difficult to capture in monetary form through surveys (Smeeding, Reference Smeeding1982). Garfinkel et al. (Reference Garfinkel, Rainwater and Smeeding2010) found that health expenditures accounted for about 5–10 per cent and education for about 5–8 per cent of GDP for most rich nations. These estimates challenge the conventional approaches that ignore these important in-kind benefits when studying the social welfare systems.
Most existing studies of the Chinese system have focused on the redistributive effects of pensions and social assistance (Gao and Riskin, Reference Gao, Riskin, Davis and Wang2009; Lu et al., Reference Lu, Lin, Vikse and Huang2013; Cai and Yue, Reference Cai and Yue2016; Wang et al., Reference Wang, Long, Jiang and Xu2016), but few have examined the effects of health and education benefits, despite their very important roles. Recent years have seen a surge of good quality, large-scale household surveys in China, enabling analysis of social welfare and family well-being at the micro level. However, the lack of precise measurements of health and education benefits in survey data remains a hurdle when including them in welfare analyses on China.
To overcome this deficiency and present a complete picture of the Chinese social welfare system, in this article we quantify the size, structure and redistributive effects of the Chinese welfare system using microsimulation to impute health and education benefits based on macroadministrative data. In so doing, we provide new evidence on whether the inclusion of these two vital components of in-kind social benefits might change the overall story. Understanding the Chinese welfare system can add important information to the global debate on the sustainability of the welfare state, especially when many Western welfare states are being contested (see, for example, Hemerijck et al., Reference Hemerijck, Vandenbroucke, Andersen, Pochet, Degryse, Basso and Taylor-Gooby2012; Irving et al., Reference Irving, Fenger and Hudson2015) and the East Asian welfare states are diverging from their traditional residual and productive approaches (see, for example, Hudson et al., Reference Hudson, Kühner and Yang2014; Mok and Hudson, Reference Mok and Hudson2014).
The theoretical argument for valuing in-kind benefits, especially those of health and education, has been made for nearly a quarter century, with its initial empirical application in the US case (Smeeding, Reference Smeeding1982) but increasingly in the comparative welfare state literature (e.g. Goodman et al., Reference Goodman, White and Kwon1998; Lustig, Reference Lustig2001; Gough and Wood, Reference Gough and Wood2004; Grosh et al., Reference Grosh, del Ninno, Tesliuc and Ouerghi2008; Barrientos, Reference Barrientos2013; Furuto, Reference Furuto2013). Conceptually, these benefits are essential for human well-being, and access to these benefits is increasingly considered a basic human right (Dean, Reference Dean2007; Fisher et al., Reference Fisher, Shang and Blaxland2011). Therefore, from a theoretical point of view, a measure that captures in-kind benefits is superior to, and more comprehensive than, the measures that omit them. Empirically, a growing set of studies are applying such measures in welfare analysis to capture all cash and in-kind benefits and to estimate their redistributive effects (Lindert, Reference Lindert2004; Garfinkel et al., Reference Garfinkel, Rainwater and Smeeding2010). As is well argued and documented in the literature, both cash and in-kind benefits are explicit redistributive mechanisms that aim to enhance not only certain subgroups’ economic well-being but also overall social justice (Titmuss, Reference Titmus1958; Lampman, Reference Lampman1971; Barr, Reference Barr2001; Alesina and Glaeser, Reference Alesina and Glaeser2004; Hills, Reference Hills2004). In this article, we apply this theoretical argument to empirical analysis of the Chinese case, and include health and education benefits as essential components of the social welfare system.
The Chinese social welfare system
Embedded in the Household Registration System (Hukou), the Chinese social welfare system has always been divided along the urban–rural lines. Urban China used to have a full employment policy under which all urban citizens had secure jobs. The jobs came with low wages but generous and comprehensive social benefits, such as pensions, health care, housing, food and education (Hussain, Reference Hussain1994; Saunders and Shang, Reference Saunders and Shang2001). This system, however, was cut back alongside the market economic reforms and rising unemployment. Housing, as part of the urban social benefit package, was gradually privatised. Social insurance – mainly pensions and health insurance – which had previously been the sole responsibility of employers, shifted to be shared among employers and employees (Hussain, Reference Hussain1994; Saunders and Shang, Reference Saunders and Shang2001). The Minimum Livelihood Guarantee (or Dibao) program was established in 1999 to provide cash subsidies to poor urban families (Wu and Ramesh, Reference Wu and Ramesh2014). Meanwhile, rural citizens had access to the farmland for production purposes, and had to be self-reliant or turn to their extended families when in need. Only those without the ability to work, or who lacked family support, could apply for assistance from the government. As a result, the rural social welfare system was minimal and covered only a fraction of rural residents (Wong, Reference Wong1998).
Since 2003, the Chinese government has undertaken a series of actions to address the needs of the previously uncovered or under-covered populations. Emphasis has been placed on unifying the welfare systems across the urban–rural–migrant populations (Carrillo and Duckett, Reference Carrillo and Duckett2011; Frazier, Reference Frazier2014; Mok and Lau, Reference Mok and Lau2014; Ngok and Huang, Reference Ngok and Huang2014). In rural China, agricultural taxes were eliminated nationwide in 2006; the Dibao program was expanded to rural areas nationwide in 2007; and, in 2008, the rural cooperative medical insurance that had collapsed during the market reforms was restored and expanded to provide health insurance to most rural residents. In urban areas, a new health insurance scheme for non-employees was piloted in 2007 and implemented in 2009. The 2008 Labour Contact Law mandated all employers to sign labour contracts with employees, including migrant workers, and to provide social insurance coverage for them.
More recently, several new regulations were issued to further broaden the social welfare coverage. The 2010 Social Insurance Law stipulated the establishment of a unified old-age and health insurance system for all urban and rural citizens, regardless of employment status. In February 2014, the government issued the Social Assistance Regulations to provide cash and in-kind assistance to those with low incomes and/or with specific health, education or housing needs. In July 2014, the State Council launched fundamental reforms of the Hukou system to enable greater mobility between rural and urban areas and broader social benefit coverage for all citizens.
Health and education systems and inequalities
Despite the recent expansions in the Chinese social welfare system, there continue to be substantial multidimensional inequalities in health and education in China. The most persistent inequalities exist across the urban–rural division. With regard to health, rural residents have substantially fewer healthcare providers and poorer access to facilities, leading to their poorer health conditions, as compared to their urban peers. In 2014, the ratio of medical providers (including professional physicians and nurses) in rural versus urban areas was 1:5.22, and there were 3.54 hospital beds for every 1,000 rural residents versus 7.84 beds for urban residents (National Bureau of Statistics [NBS], 2016). In 2011, rural hospitals accounted for only 27.4 per cent of inpatient treatments, compared to 70.6 per cent for urban hospitals, with the remaining 2 per cent of inpatient treatments occurring in urban community health centres (Hu et al., Reference Hu, Ljungwall and Wikstrom2013).
Such disparities lead to significant differences in the health conditions of residents. Compared to their urban peers, elderly people in rural areas have poorer physical functional status (Zimmer et al., Reference Zimmer, Wen and Kaneda2010) and rural children are nearly three times more likely to suffer from malnutrition and be underweight than urban children (Tang et al., Reference Tang, Meng, Chen, Bekedam, Evans and Whitehead2008). In 2013, the rural infant mortality rate and the under-five mortality rate were both 2.4 times that of the urban rates (UNICEF, 2015). The life expectancy of rural residents (72.29 years) was estimated to be five years shorter than their urban peers (77.33 years) in 2009 (Hu, Reference Hu2010).
Other dimensions of health inequalities also exist, most notably by gender and socioeconomic status. Female elders are more likely to have lower cognitive function (Smith et al., Reference Smith, Strauss and Zhao2014) and to be physically dependent than their male counterparts. Conversely, however, female elders are more likely to survive from health risk factors, mainly due to their richer coping strategies (Kaneda et al., Reference Kaneda, Zimmer, Fang and Tang2009). Those with lower socioeconomic status are more likely to have limited access to health services and worse perceived health conditions in both urban and rural areas (Vedom and Cao, Reference Vedom and Cao2011).
Similarly, inequalities in education in China are also multifaceted. Large differences in educational investment, facilities and teacher training exist between urban and rural areas, contributing to substantial disparities in the quality and outcomes of education (Rong and Shi, Reference Rong and Shi2001; Brown and Park, Reference Brown and Park2002). Rural children are much more likely to drop out of school (Wang, Reference Wang2014), less likely to enrol in high school which is non-compulsory (Liu et al., Reference Liu, Zhang, Luo, Rozelle, Sharbono and Shi2009; Loyalka et al., Reference Loyalka, Liu, Song, Yi, Huang, Wei, Zhang, Shi, Chu and Rozelle2013) and more likely to have poorer outcomes in all subjects, especially English and mathematics (Connelly and Zheng, Reference Connelly and Zheng2003; Wu, Reference Wu2007; Huang, Reference Huang2009; Chen et al., Reference Chen, Shi, Mo, Chu, Loyalka and Rozelle2013). Even if rural children attain the same level of education as their urban peers, the returns to education on the job market and in career trajectories are much lower (Hannum et al., Reference Hannum, Park, de Brauw, Rozelle, Hannum and Park2007).
There also exist significant education inequalities by socioeconomic status and gender. Students from low-income families are more likely to drop out of school, less likely to enrol in high school and are more likely to have poorer academic outcomes than their middle- and high-income peers (Wang, Reference Wang2014). Girls, especially those from rural and migrant families, suffer from lower parental expectations, lower educational investment and poorer short- and long-term academic outcomes as compared to boys (Buchmann, Reference Buchmann2000; Yu and Su, Reference Yu and Su2006; Hannum and Park, Reference Hannum and Park2007; Kim et al., Reference Kim, Sherraden and Clancy2013).
These longstanding inequalities are embedded in China's health and education benefit systems. The current health insurance system in China consists of three main schemes: the Urban Employee Basic Medical Insurance (UEBMI), the Urban Resident Basic Medical Insurance (URBMI) and the New Rural Cooperative Medical System (NRCMS), as shown in Table 1. In addition, civil servants and employees of government-affiliated institutions are covered by the largely free Government Insurance Scheme (GIS, gongfei yiliao), though this scheme has recently been gradually merged into the UEBMI system.
Table 1 Overview of the three health insurance programs in China

Sources: Barber and Yao (Reference Barber and Yao2010), Eggleston (Reference Eggleston2012), Huang (Reference Huang2015), Ministry of Health (2013, 2014), National Bureau of Statistics (2013, 2014).
The UEBMI has been mandatory for employees in all urban firms, government institutions and not-for-profit organisations since 1998. Usually the employer contributes 6 per cent and the employee contributes 2 per cent of the employee's wage toward the premium. Benefits are capped at a certain level, ranging from 30 to 300 thousand yuan annually according to local policies (Fang, Reference Fang, Fan, Kanbur, Wei and Zhang2013). Initially only covering employees with urban Hukou, the UEBMI expanded during 2009–11 to cover migrant workers (Hu, Ljungwall and Wikstrom, Reference Hu, Ljungwall and Wikstrom2013). In 2012, UEBMI covered 199 million urban employees and 66 million urban retirees (Ministry of Human Resources and Social Security, 2013).
The URBMI was implemented nationally in 2009 to provide health coverage for urban residents not covered by UEBMI. This includes children, older adults who are ineligible for UEBMI and the poor and disabled who are not working (Ministry of Health, 2010). The premiums for URBMI are set to be much lower than those for the UEBHI and the benefits are also significantly lower. Participation in URBMI is voluntary and participants pay the premiums (Fang, Reference Fang, Fan, Kanbur, Wei and Zhang2013). By 2013, 300 million urban residents participated in URBMI, exceeding the target set by the Ministry of Health in 2011 (NBS, 2014).
Initiated by the State Council in 2002 and fully implemented nationwide in 2008, the New Rural Cooperative Medical System (NRCMS) is a voluntary health insurance program for rural residents. The annual premium is very low – usually less than 300 yuan – and over half of it is subsidised by the central and local governments (Barber and Yao, Reference Barber and Yao2010; Fang, Reference Fang, Fan, Kanbur, Wei and Zhang2013). As of 2013, 820 million people participated in the NRCMS and the coverage rate reached 99 per cent nationally (NBS, 2014).
As shown in Table 1, there exist substantial disparities across these three health insurance schemes, as reflected in their very different inpatient reimbursement rates. The inpatient reimbursement rate for UEBMI averaged 70–80 per cent of the total inpatient care expenses across cities, while that for URBMI averaged 50–60 per cent depending on the type of hospital. The benefit level for NRCMS was the lowest: its inpatient reimbursement rate averaged only 20–60 per cent, with huge variations across localities and hospital types.
China's compulsory education law stipulates that all children have the right to attend elementary and junior middle schools free of tuition charges. Although the national compulsory education enrolment rate has increased dramatically over recent decades, the urban–rural gap persisted in educational investment. In 2011, expenditure on education per rural student was 700 yuan less than for the urban student for elementary school and 900 yuan less for junior middle school (China News, 2013). These differences in educational investments partly explain the substantial disparities across the urban–rural–migrant populations and by socioeconomic status as well as gender in enrolment rates, dropout rates and educational attainment (Hannum and Park, Reference Hannum and Park2007; Li et al., Reference Li, Loyalka, Rozelle, Wu and Xie2013; Loyalka et al., Reference Loyalka, Liu, Song, Yi, Huang, Wei, Zhang, Shi, Chu and Rozelle2013; Zhang, Reference Zhang2013).
Data and methods
Data
We use data from the China Household Income Project (CHIP) 2007 survey (Li et al., Reference Li, Loyalka, Rozelle, Wu and Xie2013). CHIP is a repeated cross-sectional study considered to be among the best national surveys on household income, expenditure and program participation (Bramall, Reference Bramall2001; Riskin et al., Reference Riskin, Zhao and Li2001; Gustafsson et al., Reference Gustafsson, Sicular and Li2008; Li et al., Reference Li, Loyalka, Rozelle, Wu and Xie2013). In recent years, there has been a surge of national household surveys focusing on different aspects of the Chinese society (see, for review and comparison, Gustafsson et al., Reference Gustafsson, Li and Sato2014 and Zhang et al., Reference Zhang, Xu, Zhou, Zhang and Xie2014), yet CHIP remains the data source with most detailed questions on income and social benefits and thus is used for this study.
Samples of the CHIP study were drawn from larger NBS urban and rural samples using a multistage stratified probability method to achieve national representativeness. CHIP 2007 included 10,235 urban households, 13,000 rural households and 5,000 migrant households. Migrants are defined as those with rural Hukou but live in the cities. CHIP 2007 sampled most migrants from their workplaces, where they also tended to reside in on-site dorms. Because of this sampling method, there is some upward selection bias for the migrant sample, as indicated by their high average income levels shown below.
CHIP particularly fits the analytical needs of this study; it provides detailed information on the various cash and in-kind social benefits received by all urban, rural and migrant households, along with a detailed accounting of other income sources. Further, for the purpose of imputing health and education benefits, CHIP contains information regarding the type of health insurance that respondents had, if any, and the level and type of school attended by children in the households.
Measuring the size, structure and redistributive effects of social benefits
In this article, social benefits include three components: self-reported social benefits, imputed health benefits and imputed education benefits. Self-reported social benefits are those reported by the respondents in the dataset. These include social insurance (mainly pensions and unemployment insurance), social assistance, housing, food and other in-kind benefits. Respondents reported the values of these benefits received for the previous year. All incomes are calculated at the household per capita level and adjusted by provincial price deflators compiled by Brandt and Holz (Reference Brandt and Holz2006) and updated to 2007 using provincial consumer price indices (CPIs) reported in the China Statistical Yearbooks. Statistical weights are applied to all results. We then measure the size and structure of the social benefits in relative terms – as a percentage of their final household income – so that they can be compared across the urban–rural–migrant populations.
One of our main contributions is to capture health and education benefits through microsimulations. We impute the value of urban and rural provincial level per capita government expenditure on health insurance (by type of insurance) and on education (by grade level) to respondents who reported having such insurance and whose children attended public schools. Information on health benefits was captured by the survey data: participants were asked to report any medical expenses covered by their employers, the government or the collective, and to estimate the cash value of any in-kind health services received in addition to the covered medical expenses. We count this sum as part of the in-kind health benefits received by families, and additionally impute the value of health insurance for those with coverage.
Specifically, in urban China, we calculate per capita health expenditures at the provincial level, dividing the total UEBMI expenditures by the total number of UEBMI participants within each province (Ministry of Health, 2008), and impute this figure to those who reported contributing to their UEBMI accounts in the CHIP survey. It is important to note that both employers and employees pay for the expenditures. Following the literature (Lindert, Reference Lindert2004; Garfinkel et al., Reference Garfinkel, Rainwater and Smeeding2010), we count all of these as they are instituted based on government regulations and are thus an essential part of the welfare system. Conversely, leaving them out would discount both the size and redistributive effects of the welfare system. Because there is no publicly available data on total expenditures or the number of participants of the GIS, we assume their benefit levels are similar to those covered by UEBMI, and impute the same values for government and public institution employees, providing a conservative estimate of health benefits for this privileged group. Health benefits received by urban residents through URBMI are excluded from the calculations as this program was only piloted in 2007.
The imputation of rural health benefits is more complicated. There are no publicly available data on total NRCMS expenditures at the provincial level for 2007; instead, data are available on the total amounts of raised funds available for NRCMS use. In 2007, the national total NRCMS expenditures accounted for 81 per cent of the total raised funds. We assume that NRCMS expenditures of the various provinces as a share of the total raised funds are similar to this proportion and multiply 81 per cent to the amounts of provincial raised funds to obtain the estimated provincial total NRCMS expenditures. We then divide these values by the number of NRCMS participants within each province to estimate per capita NRCMS expenditure, and this figure is reported as the health benefit for those who reported to participate in NRCMS.
For migrants, we impute the value of per capita UEBMI expenditures in the province of their current residence if they reported participating in UEBMI at their current residence location, and impute the value of per capita NRCMS expenditures of their hometown province if they reported participating in NRCMS at their hometowns. A very small proportion of the migrants were imputed with both values as they reported participating in both programs.
Regarding education benefits, due to limited data availability for early and higher education, our imputation only captures four levels of education: elementary school, junior middle school, senior middle school and vocational high school. Both the rural and national per student education expenditures by grade are available at the provincial level; however, the urban expenditures can only be found for eight provinces. Based on the available information for these eight provinces, we estimate that the urban-to-rural per student expenditure ratios at the elementary school, junior middle school and senior middle school levels are 1.11, 1.25 and 1.43, respectively. For the provinces lacking urban education expenditure data, we apply these ratios to the rural data within each province to estimate urban education benefits per student. We assume that the ratio for vocational high schools is the same as for senior middle schools because no province has data available to calculate such a ratio for vocational high school.
Migrant children who lived with their parents mostly had poor access to publicly funded schools in the cities. Based on studies that estimated their access and benefit levels (Zhang and Zhou, Reference Zhang and Zhou2012; Wang, Reference Wang2016), we assume a 50 per cent average education benefit rate for migrant children living in the cities and impute half the local per student education expenditure according to their school level. Education benefits for children who stayed behind in their home villages are imputed with their local per student education expenditure and captured in the rural results.
These imputation methods have both pros and cons. It enables us to include important health and education benefits and have a more accurate estimate of the size, structure and redistributive effects of the Chinese social benefits. Meanwhile, it does not provide the most accurate estimation of the redistributive effects of these benefits, because our imputations are derived from provincial level per capita expenditures rather than household level data. Therefore, our results tend to underestimate individual and household level differences, and the estimated reductions in income inequality reported below reflect only partially the redistributive effects of these benefits. Future research can achieve more accurate estimates using more precise administrative data – at the county, township or village level – for imputations and/or self-reported household and individual data.
We use two measures to gauge the redistributive effects of the social benefits. First, we compare pre- and post-transfer income inequality levels measured by the Gini coefficient to see whether and to what extent social benefits helped reduce overall income inequality. Second, we calculate the economic distances between the bottom (i.e., 10th percentile, or p10) and top (i.e., 90th percentile, or p90) of the income distribution, relative to the median (i.e., 50th percentile, or p50), based on pre- and post-transfer income to evaluate the regressivity or progressivity of the social benefits. We use the p10/50 ratio to capture the lower-end of the income distribution, and the p90/50 ratio to capture the higher-end of the income distribution. The difference between the two reflects the economic distance between the bottom and top of the income distribution. To compare the results across the urban–rural–migrant populations, all analyses are done within the three respective urban, rural and migrant samples.
Results
Size and structure of social benefits
Figure 1 presents the levels and components of household per capita income in China estimated from CHIP 2007 data and Table 2 also shows the shares of these components in final household income. Overall, the large income gap between urban and rural China identified in the literature remained prominent in these results: urban final household income per capita averaged 14,809 yuan in 2007, which was 2.8 times that of the rural level (5,281 yuan). The final household income per capita for migrant families was 1,647 yuan lower than that for urban families. This is an upward biased estimate of migrant family income in the national context due to the sampling method used for the migrant sample in CHIP 2007.
Figure 1. Levels and components of final household per capita income in China, 2007
Table 2 Levels of income components and as a percentage of final household per capita income in China in 2007

Source: Authors’ calculations using CHIP 2007 data.
Among the various income sources, market income was the largest component, making up 78 per cent of urban household income and about 87 per cent of rural and migrant household incomes. Similarly, private transfer income – gifts and support from family, friends and relatives – was much higher for urban families (570 yuan or 4 per cent of final household income) than for rural and migrant families (101 yuan or 2 per cent for rural families and 165 yuan or 1 per cent for migrant families). Taxes and fees paid for families were significantly higher in urban areas than in rural and migrant families: urban families on average paid 7 per cent of their final household income in taxes and fees, while rural and migrant families only paid 0–1 per cent of their final household income in taxes and fees.
How large were the imputed health and education benefits for the urban, rural and migrant families? Our results show that the imputed health benefits further widened the urban–rural–migrant gaps in social benefit income across the three groups while imputed education benefits helped narrow the gaps somewhat. First, there existed huge gaps in self-reported social benefits, which included pensions, public assistance, in-kind housing, food and in-kind health benefits. Urban families on average received 2,802 yuan per capita in social benefits in 2007, accounting for 19 per cent of their final household income, while rural families only received 102 yuan in social benefits, accounting for 2 per cent of their final household income. Migrant families on average received 1,498 yuan in social benefits, accounting for 11 per cent of their final household income. It is important to note, however, that most of the self-reported social benefits for migrants were employer-provided food and lodgings, which could be considered in-kind wage payments, as most of these migrants lived on site. If these employer-provided food and lodging benefits are removed from the calculation, migrants on average only had 1 per cent of their final household income from self-reported social benefits.
Second, while imputed education benefits were more equally distributed across the urban–rural–migrant lines, imputed health benefits were highly unequal as suggested by the review of the three different health insurance schemes for the different populations. Specifically, urban families on average enjoyed 389 yuan imputed health benefits per capita, which accounted for 2.6 per cent of their final household income. Rural families on average enjoyed only 53 yuan imputed health benefits, accounting for 1 per cent of their final household income. The imputed health benefits for migrant families averaged 58 yuan and accounted for only 0.4 per cent of their final household income. Imputed education benefits averaged 447, 456 and 116 yuan per capita for urban, rural and migrant families, accounting for 3 per cent, 9 per cent and 1 per cent of their final household income, respectively, with the urban and rural children benefiting at about the same level but leaving migrant children behind.
As shown in Figure 2, overall, the size of the total social benefits measured as a share of final household income for rural and migrant families was only about half that for urban families. On average, nearly 25 per cent of urban final household income was from social benefits, while only 12 per cent and 13 per cent of final household income came from social benefits for rural and migrant families, respectively. Imputed health benefits supported urban families the most, while imputed education benefits helped boost the total social benefits for rural families. The majority of migrant families’ social benefits came in the form of in-kind food and housing provision from their employers, without which their total social benefits remained trivial.
Figure 2. Shares of social benefits in final household per capita income in China, 2007 (%)
Redistributive effects of social benefits
We now analyse the redistributive effects of the social benefits, differentiating the self-reported benefits versus imputed health and education benefits. Figure 3 presents the changes in the Gini coefficient within the respective urban, rural and migrant populations based on different income definitions. We start with market income only, and then incrementally add in self-reported social benefits, private transfers, imputed health and imputed education, minus taxes and fees.

Figure 3. Effects of social benefits, private transfers and taxes/fees on Gini coefficients based on final household per capita income in China, 2007
In urban areas, consistent with its large size, self-reported social benefits had the largest effect in reducing income inequality. The Gini coefficient based on market income was 0.39 in 2007, and it was lowered to 0.32 after self-reported social benefits were considered. Private transfers had virtually no effect on reducing urban income inequality as measured by the Gini coefficient. Imputed health benefits lowered the Gini coefficient from 0.3212 to 0.3164, and imputed education benefits further reduced the Gini coefficient to 0.3076. Taxes and fees had a minimal effect on the urban Gini coefficient.
By contrast, the respective rural and migrant Gini coefficients, based on market income only, were much lower than the urban Gini, and social benefits and other transfers contributed little to the reduction in income inequality. Specifically, the rural Gini based on market income was 0.36, and it was lowered to 0.33 after all public and private transfers were accounted for. The Gini coefficient for rural areas was still higher than the urban Gini, highlighting the minimal role played by social benefits in rural areas. The largest reduction in the rural Gini (from 0.35 to 0.33) was due to imputed education benefits, the largest social benefit component in rural China, signifying the equalising role played by education in rural areas. Imputed health benefits had minimal effects in reducing rural income inequality as measured by the Gini coefficient.
The Gini for migrants based on market income only was 0.2868, and it was lowered to 0.2701 after all benefits and transfers were taken into consideration. Self-reported social benefits – mostly in-kind housing and food benefits – contributed the most to the reduction (by about 0.01), followed by imputed education (by about 0.005), while imputed health, private transfers and taxes and fees had virtually no effect on the Gini coefficient. Consistent with the rural finding, imputed education played a somewhat equalising role, while imputed health had little equalising effect for migrants.
Figure 4 presents the changes in the economic distance between the low- and high-income households, with the value of the p10/50 ratio at the lower end and the value of the p90/50 ratio at the higher end. A longer bar, therefore, represents a wider gap between the poor and rich families, and the redistributive role of the social benefits and other transfers are revealed by the changes in the lengths of the bars after each benefit or transfer item is considered.
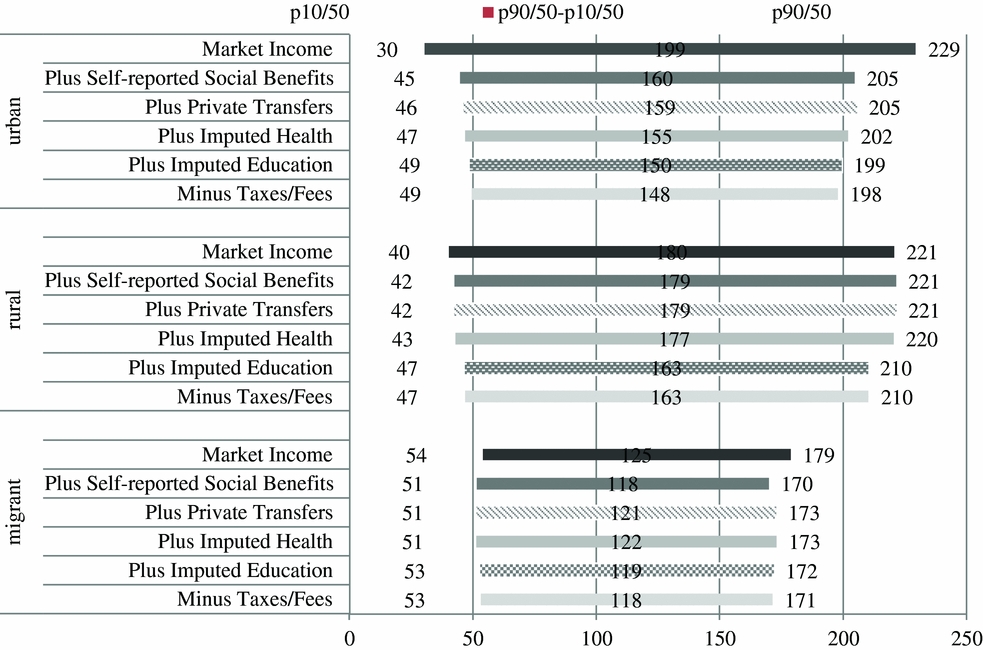
Figure 4. Impact of social benefits on economic distance between low- and high-income households based on final household per capita income in China, 2007
Figure 4 shows that all social benefits and transfers helped narrow the economic distances between the poor and rich among the respective urban, rural and migrant populations. Consistent with the results on the Gini coefficients above, for urban families, the largest contributions were made by self-reported social benefits, reducing the length of the bar from 199 based on market income only to 160, a reduction of 39 points. Imputed health and education shortened the length of the bar by 5 and 4 points, respectively, while taxes and fees helped narrow the bar by 2 points.
By contrast, in rural areas, imputed education contributed significantly to the reduction in the length of the economic distance bar (by 14 points), consistent with the findings based on the Gini coefficients. Imputed health benefits helped narrow the economic distance between the poor and rich by 2 points, a small redistributive effect.
Among the migrants, self-reported social benefits (i.e., in-kind housing and food benefits) helped reduce the length of the bar by 7 points. However, the relative positions of the poor families were further lowered rather than lifted in the overall income distribution, suggesting that these employer-provided benefits actually favoured the well-off and punished the worse-off among the migrants. Similarly, imputed health benefits widened rather than narrowed the economic distance between the poor and rich migrant families, despite only by 1 point. Consistent with the findings based on the Gini coefficients, imputed education benefits helped narrow the economic distance by 3 points and had the most significant redistributive effects for migrants. The weaker effect of imputed education benefits for migrants as compared to rural families is partly because few migrant children lived with their parents in the cities and partly because that they only enjoyed about half the education benefits received by their urban peers. The children who were left behind to reside with their grandparents and other relatives in the villages received the rural education benefits, which played a larger redistributive role than the migrant education benefits.
Conclusion and discussion
Enabled by the inclusion of imputed health and education benefits through microsimulation, this article provides new evidence on the size, structure and redistributive effects of the Chinese social welfare system using the China Household Income Project 2007 data. We find that the inequalities in social welfare systems across the urban–rural–migrant populations persisted. Imputed health benefits were larger and played a greater redistributive role in urban areas than for their rural and migrant peers. Imputed education benefits, on the other hand, played a more equalising role in rural and migrant populations as compared to the urban population. These results suggest that the Chinese social welfare system in 2007 was still predominantly employment based, where those with stable, better jobs tended to benefit from the social benefits, while those without such jobs – rural residents, migrants and urban unemployed – were left behind by both the labour market and social benefit protection. China still has a long way to go as it strives to build a more generous, universal and unified social welfare system.
In particular, findings of this article underscore the depth and persistency of the multidimensional inequalities in health and education well documented in the literature, especially across the urban–rural–migrant populations. Results based on imputed health benefits reinforce the inequalities in healthcare facilities, access and conditions across these groups, given the small redistributive effects of these benefits (Hsiao, Reference Hsiao2004; Tang et al., Reference Tang, Meng, Chen, Bekedam, Evans and Whitehead2008; Vedom and Cao, Reference Vedom and Cao2011; Pan et al., Reference Pan, Xu and Meng2016). Imputed education benefits helped reduce the economic distances between the poor and rich for all three groups, especially for rural families, but the reductions were also small relative to the overall magnitudes of inequalities (Rong and Shi, Reference Rong and Shi2001; Brown and Park, Reference Brown and Park2002; Hannum and Park, Reference Hannum and Park2007; Wu, Reference Wu2007; Huang, Reference Huang2009). Given that social benefits typically function as one of the main channels of redistribution to achieve greater social justice (Titmuss, Reference Titmus1958; Barr, Reference Barr2001; Hills, Reference Hills2004; Dean, Reference Dean2007; Fisher et al., Reference Fisher, Shang and Blaxland2011), it is important for China to recognise the extent and severity of the inequalities as well as their contributing factors and use health and education benefits effectively to mitigate such multidimensional inequalities and to enhance the life opportunities of disadvantaged citizens, especially children.
Given that the data used in this analysis were from 2007, what would be the more recent trends given the new social policy developments since then? Administrative data since 2007 have shown much greater government spending and higher participation rates for social insurance programs (Gao et al., Reference Gao, Yang and Li2012; Ngok and Huang, Reference Ngok and Huang2014; Wu and Ramesh, Reference Wu and Ramesh2014). It is therefore plausible that, if more recent micro data were available, the results would show somewhat narrower gaps across the urban–rural–migrant populations. Meanwhile, however, the fragmented and hierarchical nature of China's pensions and health insurance systems suggest that these gaps are likely to persist and their elimination is still far off (Cai and Cheng, Reference Cai and Cheng2014; Frazier, Reference Frazier2014; Huang, Reference Huang2015). Future research using CHIP 2013 and other data sources can help answer these questions empirically.
The updated evidence on China can help inform the global pursuit of a sustainable welfare state, while China can learn from other countries as it strives to build a more sufficient and equal social welfare system (Mok and Hudson, Reference Mok and Hudson2014). Among the East Asian and Pacific nations, several countries have successfully used tax policies (e.g., South Korea and Thailand) to address inequality and to support work efforts. In some societies, non-profit organisations and private enterprises have collaborated with the government to meet social needs (e.g., Thailand and Taiwan). Vietnam, another country with a sharp urban–rural division, has had a smaller but more equalising social welfare system when compared with China (Gao, Evans et al., Reference Gao, Evans, Garfinkel, Baehler and Besharov2013). These are important lessons for China as it continues expanding its social welfare system to address the challenges of population aging, urbanisation and slowing down of economic growth (Furuto, Reference Furuto2013; London, Reference London, Besharov and Baehler2013). Marten and colleagues (Reference Marten, McIntyre, Travassos, Shishkin, Wang, Reddy and Vega2014) studied the health care systems of the BRICS countries (Brazil, Russia, India, China and South Africa) and found that, despite their differences, these countries all face common challenges, such as insufficiency in public spending and inequality in health care access and quality. China is among the most aspiring countries to expand its health care as well as the overall social welfare system to address these challenges. It is important for the Chinese government to draw lessons from evidence on the redistributive effects of its own system as well as those from other countries to build a truly sufficient and effective social welfare system to serve its citizens.
Acknowledgements
An earlier version of this article was presented at the 33rd general conference of the International Association to Research in Income and Wealth (IARIW) on 24–30 August 2014 in Rotterdam, the Netherlands. We thank Anne Harrison, David Johnson, Michael Wolfson and other participants of the session on ‘What About STIK: How to Treat In-kind Government Benefits at Micro- and Macro-Levels’ for helpful comments. We acknowledge the Australian government (Australian Research Council and AusAID), the Institute for the Study of Labor (IZA) and the University of Western Ontario who funded the surveys that provided the data for this research.


