1. INTRODUCTION
Since its emergence over four decades ago, anthropometric studies have shown that the evolution of human stature can be helpful to examine human welfare and that it is a relevant indicator to calculate a human development index. Although the pioneer studies in the field examined the effects of industrialisation in Great Britain (McKeown Reference Mckeown1976; Tanner Reference Tanner1978; Floud et al. Reference Floud, Wachter and Gregory2006; Floud Reference Floud1984; Evelth and Tanner Reference Eveleth and Tanner1990) and on the institution of slavery in the United States (Steckel Reference Steckel1979, Reference Steckel1983, Reference Steckel1995, Reference Steckel1998; Margo and Steckel Reference Margo and Steckel1983; Fogel and Engerman Reference Fogel and Engerman1995; Beinkman and Druker 1988; Komlos Reference Komlos1987, Reference Komlos1993, Reference Komlos1995a, Reference Komlos1995b, Reference Komlos1998, Prince and Steckel Reference Prince and Steckel1998) shortly thereafter studies on other parts of Europe began to appear such as on France (Le Roy Ladurie and Berganeau Reference Le Roy Ladurie, Berganeau and Le Roy Ladurie1979), Germany (Komlos Reference Komlos1985), Spain, (Martínez Carrión Reference Martínez Carrión1986) and Sweden (Sandberg and Steckel Reference Sandberg and Steckel1987). By the 1990s there were contributions focused on other world latitudes, such as Korea and Japan (Kimura Reference Kimura1993; Honda Reference Honda, Steckel and Floud1997); Australia (Whitwell et al. Reference Whitwell, De Souza, Nicholas, Steckel and Floud1987) and Canada (Ward and Ward Reference Ward and Ward1984; Ward Reference Ward, Komlos and Baten1998). Latin American economic historians, too, contributed to the field with studies on Argentina (Salvatore Reference Salvatore, Komlos and Baten1998). The studies of Martínez-Carrión and Salvatore have been particularly influential for the study of anthropometric history of Ibero-America. The vast scholarship produced by Martínez-Carrión has given a template that has served as a point of departure for studies in Latin America (Martínez Carrión Reference Martínez Carrión2001; Salvatores & Baten Reference Salvatore, Baten, Komlos and Baten1998; Salvatore Reference Salvatore2004, Reference Salvatore2007). The Spanish case shared common features with its former colonies. Likewise, Salvatore's extensive work on Argentina has been useful by providing valuable insights on how to approach difficulties such as poor data sources. Since the early 2000s there have been studies that examine the anthropometric history of Mexico, Colombia, Brazil, Chile and Peru. Some of these studies look at individual country experiences and others have done comparative workFootnote 1.
In this paper, we will examine the evolution of biological standards of living of the Mexican population born during the second half of the 20th century and assess how they correlated with the evolution of inequality. This paper is divided into four sections: the first provides a background of the anthropometric history of Mexico, the second reviews the evolution of recent development policies in the Mexican economy, the third analyses the data and discusses the methods and the last section sums up our conclusions.
2. ANTHROPOMETRIC HISTORY OF MEXICO: A BACKGROUND
Although some economic historians have not been convinced of the benefits of using anthropometric measures as indicators of living standards, they have had to acknowledge that they are an indicator of health status and living standards for periods in which there has not been a systematic collection of data of other indicators like prices and wages, and that for more contemporary periods it remains a good measure in countries where there is still poor data collection (Leunig and Voth Reference Leunig, Voth, David and Thomas2006; Bodenhorn et al. Reference Bodenhorn, Guinnane and Mroz2017)Footnote 2. The problem of poor data collection could also encompass the case of countries where a large number of people operated outside of the monetised economy and/or where the informal sector constituted an important proportion of the GDP. Mexico is a country that falls into this category, hence the possibilities presented by historical anthropometry motivated scholars to assess the evolution of living standards with this methodology. The study of the biological standards of living also proved to be useful to assess inequality. Mexican economic history implicitly assumed that inequality was at the source of many of the country's ills from the colonial period to the present. While no scholar challenged this assertion, there were no systematic attempts to measure it, until 1957, when income distribution was calculated for the first timeFootnote 3.
In the past 15 years there have been studies published on the anthropometric history of Mexico that examine the second half of the 18th century and the early part of the 19th century (Challú Reference Challú2009, Reference Challú2010; Dobado-González and García Montero Reference Dobado-González and García Montero2010; Grajales-Porras and López-Alonso Reference Grajales-Porras and López-Alonso2011; Dobado-González and García-Montero Reference Dobado-González and García-Montero2014; Dobado-González and García-Hiernaux Reference Dobado-González and García-Hiernaux2017). From this scholarship a debate has arisen on whether living standards at the end of the colonial period were better or worse than in subsequent periods, or simply put, whether there was a divergence or convergence in living standards. Some argue that there was a decline in stature that started as early as the 1730s, which went until the early decades of the 19th century, and that this was due to rising prices in food. For the early decades of the 19th century, adverse climatic condition also contributed to the stunting of the populationFootnote 4. Other studies contend that the late colonial period was one of bonanza and that the stature of the Mexican population compared favourably to that of wealthy nations in other world latitudes. These studies concentrate on the military records of the 1791 Revillagigedo CensusFootnote 5. Based on the average stature of soldiers, who were the group for whom there is data on stature, at the end of the colonial period the population of Mexico enjoyed a good quality of life compared to some populations in Europe. Therefore, there was not a process of great divergence in living standards in during this periodFootnote 6.
There was also a long-term study that covers the period 1850–1950 (López-Alonso Reference López-Alonso2007, Reference López-Alonso2012). This study assessed the evolution of living standards of the Mexican population with data on stature from military and passport records. In this study, it was possible to ascertain the effects on biological standards of living of the first wave of industrialisation, the Mexican Revolution, the demographic, epidemiological and urbanisation changes. It was also possible to assess whether or not in the Mexican case there had been a synchronicity with the rates of economic growth. This study found trends that challenged the official history of the post-revolutionary period, which argued that living standards of the Mexican population deteriorated during the Porfirio Diaz administration (1876–1910) and improved afterwards with the promulgation of the social legislation in post-Revolutionary era (post 1910). By examining the evolution of living standards with a different chronology, López-Alonso (Reference López-Alonso2012) found that the evolution of living standards was heterogeneous during the 1850–1950 period. The trend in heights of the military moreover differs from that of the passport applicants. Passport applicants get taller over time. The military, on the other hand, experience deterioration and stagnation and do not recover their 1850s heights until 1950. There are regional disparities in both samples; the northerners and Bajío (centre west) dwellers are taller than their counterparts in the centre and south. Regional differences are larger in the military sampleFootnote 7. The argument of this study is that:
«Mexicans failed to grow taller during the 1850–1950 period for reasons related to the quality of institutions rather than due to exogenous calamities or a lack of natural resource endowment. Although Mexico underwent modernisation and industrialisation that promoted economic growth and development, these societal advances were attained with persistent social inequality. The vast majority of the population continued to live under preindustrial conditions—poverty, slow growth, poor health, widespread illiteracy and rural habitation—well into the 20th century»Footnote 8.
A more recent study has tried to connect historical height databases with current census databases to assess secular trends in heights of the Mexican population in a long-term perspective looking at the period 1850–1986 (López-Alonso and Vélez-Grajales Reference López-Alonso and Vélez-Grajales2015, Reference López-Alonso, Vélez-Grajales, Bértola and Williamson2017). Although the data sources were of a different nature and could not be examined in the same econometric exercise, they gave a first approximation that suggested two main points: they could be used together for a long-term analysis, and the series behaved both as an indicator of human development and of the evolution of inequality.
In a study in the late 20th century, Challú and Silva-Castañeda (Reference Challú and Silva-Castañeda2016) examine the stature of adult women from different Latin American nations. They argue that the evolution of heights over the last decades of the 20th century behave like indicators of human development and show a steady increase of 2.6 cm. Furthermore, such steady increase compares favourably to other developing regions of the world, but less so with recently developed countries. However, height gains were not evenly distributed in the region. Countries that achieved higher levels of income, such as Brazil, Chile, Colombia and Mexico, gained on average 0.9 cm per decade, while countries with shrinking economies, such as Haiti and Guatemala, only gained 0.25 cm per decadeFootnote 9. Not wanting to be too conclusive in their arguments, the authors present their findings as an invitation to test their hypothesis in more country-specific studies.
Mexican anthropometric history has revealed to this point that stature is a good measure to examine the evolution of living standards in the long run and that it has been effective for assessing inequality; indeed, it has sparked interesting debates. This paper seeks to contribute to the extant scholarship by picking up where previous studies stop and delving deeper into the questions that have been posed. We will assess whether the trends found in the period (1850–1950) persist or not when we examine the evolution of stature for the post-1950, based on social stratification and intergenerational mobility. Second, we will assess if there are sexual disparities among men and women beyond the height difference that is natural with sexual dimorphismFootnote 10. Third, we will see whether or not the evolution of height of the Mexican population moved in the same direction as GDP per capita to note the effectiveness of welfare policies throughout this period, given that the government's rhetoric emphasised its commitment to improve the well-being of the population at large.
The argument that we advance in this study is that the stature of the Mexican population increased for cohorts born in the last half of the 20th century as a result of government policies geared to increasing productivity and economic growth while it enacted social legislation, land redistribution and the creation of welfare institutions. Still, the rate of growth in stature was limited by the challenges of economic downturns and persistent structural inequality. We observe differences in the trajectory of biological standards of living standards across social strata and between men and women.
The differences are the result of a welfare system that was designed to favour a limited segment of the population who needed assistance. Although government authorities assumed welfare policies would be conducive to improving the well-being of the population at large and did establish a more egalitarian state, they created a system of social security that was limited and segmented. We therefore observe a mediocre overall improvement driven by a very meagre increase in heights among the lower strata of the population.
Starting in 1950, there is an inflexion point in the economic history of Mexico that has important repercussions for the study of the evolution of living standards of the population. The quality of data collected improved significantly due to governmental efforts; there was also interest in assessing inequality that translated into the first measurement of income inequality in the country in 1957. The data produced in conjunction with the current surveys give us information on both inputs that led to improvements in living standards, namely the resources that went into social development programmes, as well as information on the outputs. The evolution of anthropometric measures in correlation with the evolution of social stratification can show how effective were those programmes.
3. DEVELOPMENT POLICIES IN THE MEXICAN ECONOMY FROM 1950 TO 2000Footnote 11
In the last half of the 20th century, Mexico was already both a modern and backward nation. These contrasts were byproduct of the process of growth with inequality of the previous century and they would continue to impact its economy, its political system, its society and the well-being of its people. In the first decades of the post-revolutionary period policies were launched to promote domestic economic productivity, social legislation was promulgated and agrarian reform through land redistribution was implemented. Social-welfare institutions were also established: the Ministry of Health (Secretaría de Salud), the Institute of Social Security for workers in the private sector (IMSS) and the Institute of Social Security for Government Employees (ISSSTE). Government authorities then thought that these initiatives would improve the well-being of the population at large. While these changes did promote a more egalitarian state, the welfare system was designed in a way that made it segmented and stratified, hence obliterating the possibility of universal coverageFootnote 12. The second half of the 20th century was marked by profound changes. In this 50 year period, the economy experienced cycles of economic growth, stagnation and crises. It went from being a highly protectionist economy until the late 1970s, then to being a free trade model by the mid-1990s and an open economy by 2000. GDP growth declined over time. Additionally, it underwent a somewhat delayed demographic transition: infant mortality declined as a result of public health investments and vaccination campaigns, but fertility rates took a rather long time to come down until family planning initiatives were launched in the mid-1970s (see Tables 1 and 2).

Starting in the 1970s, when it became evident that the development model and social security institutions were favouring only certain sector in society, policy makers centred their debate on how to reconcile economic growth with equity through redistributive policiesFootnote 13. They decided to implement targeted programmes for populations at risk like peasants. These programmes were revamped and renamed in the different presidential administrations and involved credit to peasants and subsidies for foodFootnote 14. Although the implementation of targeted programmes was able to meet important objectives, these programmes did not have the capability to substitute benefits that would have resulted from a universal security and social protection systemFootnote 15.
By the early 1980s, some critics of these programmes pointed out that they yielded meagre results, were poorly managed and costly. In the context of the 1980s economic crises, there was a change in the development model that had assumed that orthodox economies policies would solve the main economic problems. The government reduced its intervention in the economy and reengineered the allocation of assistance to even more targeted programmes. The results from these adjustments were a deterioration in health, nutrition and education metricsFootnote 16. Despite the discouraging results for these poverty alleviation policies, the government preserved its commitment to improve the living standards of the population at large in its national development plan. In the late 1980s and early 1990s different versions of poverty reduction programmes were implemented and in 1992 the government created a specific ministry for social development, the Secretaría de Desarollo Social, to better coordinate them. Eventually, targeted assistance programmes were replaced by the end of the millennium, with conditional monetary cash transfer programmes geared to households living in extreme poverty under the acronym PROGRESA. The efficacy of these programmes has gained international recognition for its designers and yet poverty and inequality continue to be a main concern of the government.
4. DATA SOURCES, METHODS AND ANALYSIS
This study employs data from the Mexican National Health Survey of 2000 (ENSA 2000), henceforth MxNHS2000, and the Mexican National Health and Nutrition Surveys of 2006 (ENSANUT 2006), henceforth MxNHNS 2006. MxNHS2000 is a national probabilistic survey conducted at the household level between September 1999 and March 2000Footnote 17. These surveys were managed by the National Public Health Institute (Instituto Nacional de Salud Pública) and they are the first national ones to have information on stature and weightFootnote 18. These surveys were designed to obtain information on accessibility, quality, coverage and use of health services. Additionally, they included information on the prevalence of infectious, degenerative and sexually transmitted diseases. The survey was taken in all 32 Mexican states and the final sample includes 47,040 households.
MxNHNS2006 is also a national probabilistic survey with a sample design similar to the 2000 survey but with added coverage at the state level. Hence, unlike the 2000 survey, this study provided information that could be used with confidence by state governments to design health, nutrition and poverty alleviation programmesFootnote 19. Moreover, the survey collected information on health and nutrition. The survey was conducted between October 2005 and May of 2006, and also contained information on height and weight. The final sample includes 48,304 households.
We should underscore the fact that these surveys were undertaken as initiatives to have information on how to better design public health policies, not for retrospective insight; hence there are some shortcomings for the construction of historical databases. For instance, the questionnaire did not have place of birth, therefore it is not possible to ascertain regional differences or migration patterns. Regarding demography, the survey focused on reproductive health but does not provide detailed information on changes in fertility patterns across cohorts; hence with the information available it is not possible to analyse the evolution of demographic patterns. Still, the survey has information on age, education, and location which are commonly good predictors of adult heights. While both surveys used the same methodology, they do not have the same breadth of questions. The 2000 survey focused on health indicators and the 2006 added information on nutrition. However, the height data are more complete, detailed and precise than historical sources available for previous periods, especially for national level studies.
From these surveys, we were able to construct databases for adult men and women, beginning with those born in 1951. We built a longitudinal series that stops at individuals born in 1986. Following the normal procedure for historical databases, we took the heights of adults of ages ranging from 20 to 49 to ensure that we were not counting individuals who had not reached their final heights or who had begun losing heightFootnote 20. In order to control for age heaping practices and to get sample sizes that would be large enough we used 5-year cohort groups. Therefore, we work with six 5-years cohorts: 1951–1956, 1957–1962, 1963–1968, 1969–1974, 1975–1980 and 1981–1986Footnote 21.
Prior to joining the data from the 2000 and 2006 surveys we ensured that the samples are comparable. For this we do a test for equality of means for a 16 year birth cohort: 1961–1976. Therefore, if surveys are similar, the means of the corresponding 16 year birth cohort of each should be very similar. Once we tested for mean differences, the null hypothesis of equality is rejected for both males and females. We found the height difference between surveys is relatively small: 4 mm for males and 2.6 mm for femalesFootnote 22. Both surveys were representative at the national level and we wanted to avoid all potential biases; therefore, given that there was a difference in means, albeit small, we decided to use the MxNHS-2000 data for the older birth cohort, that is, the 1951–1956 cohort. For the rest of the cohorts we worked only with data obtained in the MxNHNS-2006 survey. Proceeding this way, we avoided biases from double accountingFootnote 23. Following these criteria, we constructed series with 10,479 observations for males and 17,566 for females, distributed in six 5-year birth cohorts (Table 3).

Following the methodology used in anthropometric history, we assess the quality of our height data samplesFootnote 24. As it is shown in the literature, we expect a normal distribution among homogeneous populations. The first step is a visual inspection of the distributions in order to check for shortfall or any unusual shape in the height distributionFootnote 25. A second source of potential bias is rounding problems in height samples, that is, numerically speaking, when height records show a highest proportion of measures ending in unit or half unitFootnote 26. Histograms by birth cohort and gender are presented in Figures 1A and 1BFootnote 27. A visual inspection shows that there are no shortfalls. While not all histograms match perfectly with the shape of the plotted normal distribution (line), there is no evidence of distributions skewed to the same side. Also, no «jumps-falls» of frequencies around similar measures are detectedFootnote 28. In brief, no systematic bias for the whole set of cohorts is identified.
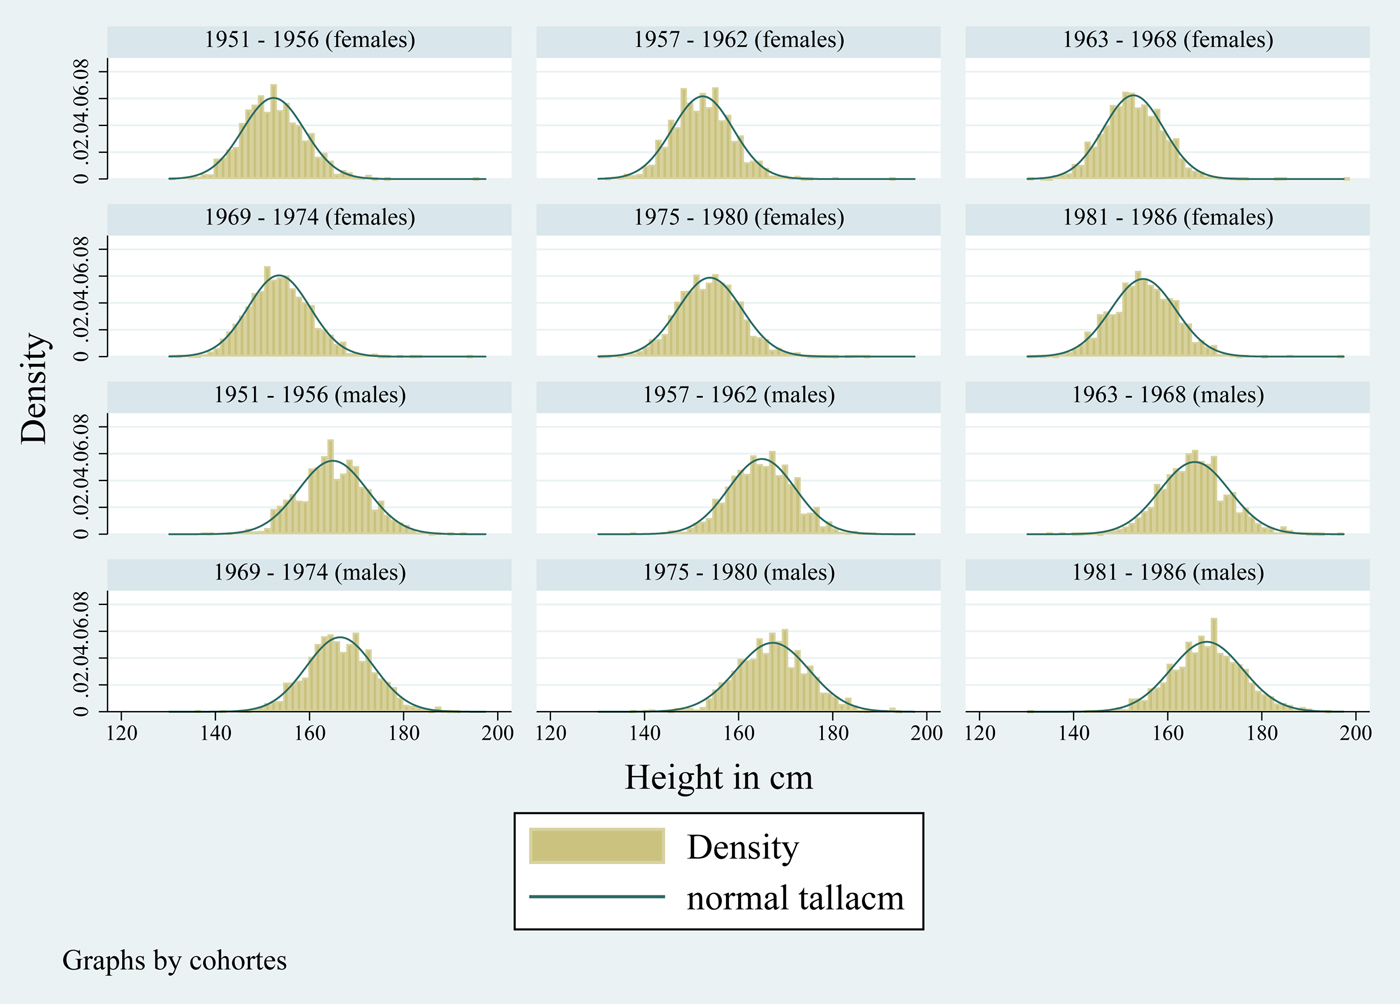
FIGURE 1 NATIONAL ADULT HEIGHT DISTRIBUTIONS BY SEX, 6 YEAR BIRTH COHORTS, 1951–1986.
Regarding the issue of rounding off, frequencies for the first decimal (millimetres) of height records are presented in Table 4. As it normally happens in these cases, frequencies are higher for those measures ending in zero or five (the sum of these frequencies accounts for more than 30 per cent). Strictly speaking, there is rounding. However, frequency levels for both females and males do not show any serious bias problem. Moreover, frequency patterns are similar among females and males. Therefore, it can be concluded that height rounding is not a source of bias for the present analysis.
4.1. Estimations and Analysis
A simple model of individual height determinants is estimated to obtain predicted average heights for the period 1951–1986. Once it is controlled for birth cohort dummies, variables for education attainment and current residence are included; the former as a proxy of economic status and the latter to assess if there was a rural or urban penalty (see Table 5)Footnote 29. The reference category is individuals born in the 1951–1956 cohort, with no schooling, living in urban areas. The regression estimates show that there is a slight decrease in heights for people born in the 1950s decade, followed by modest increase for the following decades. We observe that socio-economic differences reflected in education and place or residence are determinant of adult heights. The trends are similar for both men and women (see Figure 2). The overall improvement is nearly 2 cm for women and 2.5 cm for men. Regression results also show that men and women living in the countryside are shorter than urban dwellers. Men and women who had more years of schooling were also taller.
FIGURE 2 PREDICTED NATIONAL HEIGHT (IN CM) BY 6 YEAR BIRTH COHORTS, MEXICO 1951–1986 (NATIONAL SURVEYS).
TABLE 5 REGRESSION RESULTS FOR FEMALE AND MALE HEIGHTS
Note: OLS regression. Sample weights applied.
*P < 0.1, **P < 0.05, ***P < 0.01.
Standard errors in parentheses.
The results from the econometric analysis suggest that the increases in stature during this period were modest in light of the fact that from 1950 until 1980 GDP had the most sustained growthFootnote 30. When the economic downturns begin in the late 1970s and early 1980s, stature continued to improve at a higher rate. Thus, biological standards of living did not match GDP growth as it went from a high rate to a very modest increase at the end of the 1980s, while statures improvedFootnote 31. The results suggest that in times of sustained economic growth heights stagnated and in times of economic crisis the average Mexican got taller. This is evident for those born during the last of the birth cohorts we examine, 1981–1986, as they grew up during periods of economic stagnation. To reiterate, in the aggregate we observe in this time period the evolution of biological standards of living does not follow the cycles of economic growth. Hence it is necessary to examine other processes to assess the determinants of the trends in heights that we observe.
The coefficient that we obtain for the different independent variables suggests that current residence and education matter. There is a rural penalty. Those living in the countryside were shorter; in a period of rapid urbanisation, those left in the rural areas tended to be those worse off or those having tried their luck in the city unsuccessfully went back to their rural dwellings. This finding is consistent with public policy studies throughout the period that evaluated the groups in more need of social assistanceFootnote 32. Rural areas always scored lower in human development indicators and their participation in the economy also declined during this period.
Those with more education are taller, but education, especially higher education, takes place close to the age when people have already passed their growth spurts. In this case we argue that children of parents with more education may tend to enjoy better living conditions than those with parents with no schooling. In Figure 3 we test this hypothesis. Individuals who have less schooling tend to be shorter and women are more at a disadvantage than men.
FIGURE 3 THE EDUCATION PENALTY: NO SCHOOLING VS. OTHER EDUCATION LEVELS BY SEX.
4.1.1 Education as Mirror of Inequality
We look closer at the relevance of schooling as an indicator of human well-being and inequality. In Figure 3 we can trace the education penalty, the reference category as people with no schooling. Women with no schooling are shorter than those with incomplete primary education by 2.3 cm. The tallest individuals had more schooling, and the difference between those with graduate degrees and those with no schooling is 9.2 cm for women. Absolute differences between women are sharper than between men; the difference is larger when measured in relative terms (lines in Figure 3). This result highlights the fact that socioeconomic inequality captured by school attainment is more profound for females. This is evident that women are more vulnerable to the poverty and inequality trapsFootnote 33.
We have mentioned that throughout the period under study the government maintained a discourse of commitment to improve well-being through investment in healthcare services and education. But how effective have been these programmes at helping vulnerable populations leave the cycles of poverty and inequality? One way to measure the effectiveness of these policies is by estimating the intergenerational mobility on education. The 2013 report on social mobility in Mexico argues that «Educational coverage has widened over the recent decades, and absolute educational opportunities for the Mexican people have increased along with it. However, … it becomes apparent that educational mobility in Mexico is limited at particular levels. For the first levels of education, primary and lower secondary school, socioeconomic origin has hardly any achievement in upper secondary school and even more so in tertiary education»Footnote 34. Figure 4 shows that the educational achievement conditional on the father's education for people born in the 1947–1986 cohort is lower for women than for men. These results suggest that inequalities persist, especially for women. There is a particular barrier related to socioeconomic origins that limits the access to upper secondary education to women. Moreover, women of the lower socioeconomic strata have more obstacles to access education than men in the same strata. Interestingly, women from the higher strata also have a lower achievement than men in their same strata, suggesting that gender inequalities are pervasive at all socioeconomic levels.
FIGURE 4 EDUCATIONAL ATTAINMENT BY FATHER'S EDUCATION LEVEL IN MEXICO, BY SEX: BIRTH COHORT 1947–1986.
4.1.2 International Comparisons
We argue that a 2 cm height improvement is mediocre for post 1950 Mexico because of the size of its economy; the amount of government resources applied to improve living standards of the population as a whole; and because of data about other Latin American countries. We can compare the results with height data in Brazil and Colombia. For Colombia we have information for men and women (Table 6). The average stature of males and females of Brazilians and Colombians is higher than that of MexicansFootnote 35. The gap is larger between women. These suggests that on average the Brazilian and Colombian populations have a better biological standard of living and government efforts to improve the well-being of the Mexican population were thwarted.
TABLE 6 HEIGHT COMPARISON: BRAZIL, COLOMBIA AND MEXICO, BY GENDER, 1951–1986
Sources: Mexico: author's estimations; Colombia: Meisel and Vega (Reference Meisel and Vega2007a); Brazil: Monasterio et al. (Reference Monasterio, Nogueról and Shikida2010).
Estimated values correspond to raw means and predicted values correspond to regression values.
4.1.3 Human plasticity
We should also add that, from the point view of human biology this result could have been better in light of the fact that there was a constant stream of resources invested in improving well-being through social development programmes. Human plasticity allows for increases in stature to improve significantly within one generationFootnote 36. There is the case of the Japanese in the era of industrialisation, but closer to Mexico there is the case of Guatemalan children migrating to the United States in the same period that this study covers: for such Guatemalans, there was as much as 10 cm of height increase between cohorts due improving health and nutritionFootnote 37.
4.2. The Demographic Dynamics
We have mentioned that MxNHS-2000 and MxNHNS-2006 do not provide the data to analyse demographic trends, therefore we cannot test the effects of the demographic transition experienced on the scanty growth in stature during the period we are examining. Still, the results have a demographic explanation. Some scholarship on the disappointing performance of the Mexican economy during this period has commented about the relevance of the effects of the demographic transitionFootnote 38, following the hypothesis and findings of Williamson (Reference Williamson1998) on demographic transition that states that «demographic forces can have an impact on growth or distribution depending on the historical time and place. For demography to matter, the demographic shocks must be big, they must be exogenous with respect to growth itself and they must translate into changes in the age distribution»Footnote 39. We should clarify that Williamson referred to growth in the economic sense not in the biological one. Gómez-Galvarriato and Silva-Castañeda argue that the Mexican demographic transitions of the mid-20th century was long, deep and not fully achieved by the end of the century, resulting in an increase in the dependency ratioFootnote 40. This suggests that regardless of the evolution of the Mexican economy, which was expanding yet without good income distribution across social classes, the average Mexican household had more children to feed with the same salary. This would have repercussions in the quality of nutrition and the final height of children growing up during the last decades of the 20th century.
Márquez (Reference Márquez and Kuntz Ficker2010) also touches on the importance of demography in her study on the evolution and structure of GDP from 1921 to 2010. Márquez explains that in Mexico the growth of the service sector during the second half of the 20th century was not the byproduct of industrialisation and an improvement in per capita income as it was the case in many developed economies. In Mexico, the service sector increased at a time when the rate of growth was declining. The rapid rate of demographic growth from the mid-1960s through the 1970s resulted in an increasing number of people entering the labour force in the 1980s. Economic slowdown in the 1980s provoked by the debt crisis decreased the number of jobs available in highly productive sectors. Therefore, youth entering the labour force had to take low productivity, low wage jobs (Márquez Reference Márquez and Kuntz Ficker2010, p. 560). More schooling then did not translate into higher income or possibilities for an improvement in living conditions.
5. CONCLUSIONS
In this study, we have examined the evolution of biological standards of living of the Mexican population during the last half of the 20th century. We have shown that there was a moderate increase in stature for the population as a whole. This result can be deemed as disappointing in light of the fact that throughout the period the government discourse emphasised its commitment to improving the living standards of the entire population. While it is true that during the 1970s and 1980s the country experienced several economic downturns, the government did not terminate its social development programmes. Social-welfare policies were revised over time in search of obtaining results that could effectively decrease poverty and inequality. Nevertheless, the policies failed in light of outcomes.
In 1993, the National Institute of Nutrition (INNSZ) published a study showing preliminary results on the evolution of diabetes and overweight, arguing that at the end of the 20th century, the Mexican population was caught in an epidemiological trap, where people could be anaemic and obese at the same time: the diseases of the past were not eradicated while there were the growing perils of the diseases of modern lifestyle, derived from sedentarism and changes in dietary habitsFootnote 41. At the beginning of the millennium the MxNHS-2000 and MxNHNS-2006 of the National Health Institute (INSP) substantiated these findings. The evolution of stature during the second half of the 20th century is a product of this phenomenon despite the efforts to improve social welfare.
In 1998, Miguel Székely published an influential work on the economics of poverty, inequality, and wealth accumulation, where he stated that «[…] In Mexico, extreme poverty has not declined consistently as a natural outcome of the development process.» His assessment of the previous decades was that between 1950 and 1992 moderate poverty declined faster than extreme poverty, which suggests that the gains from development had some relation with the initial position of individuals: those who were relatively better off among the poor, were more able to improve their standard of living. This explains the expansion of the middle classes in the 1950s. In the 1960s there were significant gains for the extreme poor but this improvement was lost in the 1970s. The growth experienced until 1984 favoured some income distribution but this did not imply that the poorest of the poor were benefiting from the development processFootnote 42. On the 1984–1992 period Székely argues that it was a turn point in the inequality and poverty–development relationship. The debt crisis of the 1980s and the introduction of large economic liberalisation programmes coincided with a deterioration in income distribution that generated a substantial welfare loss for the poorest 15 per cent of the population. In 1998, Székely contended that the costs inherent in the economic liberalisation measures were disproportionately borne by the individuals at the lower tail of the income distributionFootnote 43. He shows further that the reason why some individuals were initially in a better position to benefit from the 35 per cent economic expansion registered in Mexico between 1984 and 1992 was they were better endowed with human and physical capitalFootnote 44. The MxNHS-2000 and MxNHNS-2006 surveys substantiate this argument along with the results on the evolution of stature in correlation with education that we have presented.
The evolution of heights for the population as a whole for the post 1950 period is disappointing in view the evolution of GDP growth. While the results are not catastrophic for biological standards of living during the years of crisis they do not yield the results that meet the expectations of the social policy makers. There is no one single determinant for this paucity of results but rather a combination of factors: some exogenous, such as economic crisis and lifestyle changes normally observed in urban post-industrial societies; and some are related to structural inequality stemming from the shortcomings of the social security system. Gender disparities put women at a more disadvantaged position. These results seem to be a continuation of the inequality trends observed between 1850 and 1950 across social strata. There were, however, some differences because the post-1950 population has lived longer, had more education and on average, had a higher rate of urbanisation, which could have translated into larger gains in average stature. However, persistent inequality stunted the growth in stature of the average Mexican.
Acknowledgements
The authors thank three anonymous referees and the editors for their comments and suggestions.