


Introduction
A rising global population has increased the pressures on natural resources for agriculture, livestock and livelihood needs. Concomitantly, there is a decline in productive areas in sub-Saharan Africa partly caused by flash floods, droughts, land degradation and associated declines in soil fertility (Amede et al., Reference Amede, Stroud and Aune2004). The low lying regions of Ethiopia, largely located in the Great Rift Valley, are prone to extreme events of recurrent drought and flood (Gummadi et al., Reference Gummadi, Rao, Seid, Legesse, Kadiyala, Takele, Amede and Whitbread2017). Land degradation is also a common problem in the region (Miheretu and Yimer, Reference Miheretu and Yimer2018), with more than 1.5 billion tonnes of topsoil from higher elevated areas washed away by heavy rains (Tamene and Vlek, Reference Tamene, Vlek, Braimoh and Vlek2008; Miheretu and Yimer, Reference Miheretu and Yimer2018).
In Ethiopia, the highlands, which occupy 44% of total geographical areas, have been under cultivation for centuries and are severely affected by soil erosion (Hurni, Reference Hurni1988) and deforestation (McCann, Reference McCann1997). The highlands are the source of flash floods and sediment loads to the neighboring downstream lowlands. In the decades past, flood waters were reported to have spread across the low-lying grazing lands (Hailu et al., Reference Hailu, Tolossa and Alemu2018), benefiting the rangelands which supported the livelihoods of (agro) pastoralists. With large numbers of livestocks and year-round grazings, the (agro) pastoral landscapes of Afar have degraded and the flood channels have become deep gullies (Van Steenbergen et al., Reference Van Steenbergen, Haile, Alemehayu, Alamirew and Geleta2011) with less chance for the waters to spread and irrigate natural pastures.
Pilot studies in the degraded Rift Valley areas of Ethiopia demonstrated that the effects of strong runoff and sporadic flash floods could be reversed by a holistic approach using water spreading weirs (WSW) (Elisabeth et al., Reference Elisabeth, Wolf, Jemal and Tielke2015). WSW are low retention walls commonly built in the foot slopes of mountainous landscapes, designed to regulate seasonal floodwaters, reduce runoff and minimize erosion (Haile and Fetene, Reference Haile and Fetene2012). The weirs could modify waterways, catchments and farms at scale. Improved management of land and water resources for the sustainable development through improved management of spate irrigation has been reported earlier (Gumma et al., Reference Gumma, Thenkabail, Muralikrishna, Velpuri, Gangadhararao, Dheeravath, Biradar, Acharya Nalan and Gaur2011). Several studies have proven that successful management and use of spate irrigation and broader natural resources management would require integrated approaches considering social and biophysical processes (Moore et al., Reference Moore, Grayson and Ladson1991; Vittala et al., Reference Vittala, Govindaiah and Gowda2008; Iqbal and Sajjad, Reference Iqbal and Sajjad2014; Panwar and Singh, Reference Panwar and Singh2014) and appropriate use of tools and methods.
Remote sensing is one of the low cost but effective tools for monitoring natural resources and flooded areas on timely basis. A wide range of satellites is capturing information at various spatial, spectral, temporal and radiometric resolutions. Near real time satellite imagery helps in identifying droughts and floods for quick decisions (Gumma et al., Reference Gumma, Mohammad, Nedumaran, Whitbread and Lagerkvist2017). Numerous studies have been conducted on monitoring croplands and natural resources using remote sensing and geographical information systems supported by secondary information (Rao et al., Reference Rao, Chakradhar and Srinivas2001; Gumma et al., Reference Gumma, Thenkabail, Fujii and Namara2009, Reference Gumma, Uppala, Mohammed, Whitbread and Mohammed2015, Reference Gumma, Thenkabail, Teluguntla, Whitbread, Reddy and Singh2018b; Qiu et al., Reference Qiu, Zeng, Tang and Chen2013). Several studies mapped water bodies, flooded areas and soil moisture regimes using multiple data sets including MODIS, Landsat and sentinel (Feyisa et al., Reference Feyisa, Meilby, Fensholt and Proud2014; Gumma et al., Reference Gumma, Uppala, Mohammed, Whitbread and Mohammed2015; Qiu et al., Reference Qiu, Li, Tang, Chen and Qi2015). Temporal satellite imagery and spectral analysis were successfully used in monitoring croplands and flooded areas in various studies (Gumma et al., Reference Gumma, Thenkabail, Maunahan, Islam and Nelson2014; Dong et al., Reference Dong, Xiao, Kou, Qin, Zhang, Li, Jin, Zhou, Wang, Biradar, Liu and Moore2015; Gumma et al., Reference Gumma, Nelson and Yamano2019), including at watershed and higher scales (Khan et al., Reference Khan, Gupta and Moharana2001; Gumma et al., Reference Gumma, Birhanu, Mohammed, Tabo and Whitbread2016). For instance, Sentinel-1 is most widely used to map soil moisture and floods during rainy season (Paloscia et al., Reference Paloscia, Pettinato, Santi, Notarnicola, Pasolli and Reppucci2013; Pierdicca et al., Reference Pierdicca, Pulvirenti and Pace2014; Schlaffer et al., Reference Schlaffer, Matgen, Hollaus and Wagner2015) including for assessment of flood damage.
Flood events occur where the overflow of water submerges land due to high rainfall events, an overflow of water from a water body, or in the case of the Afar region, from seasonal flows from the uplands (Flick et al., Reference Flick, Chadwick, Briscoe and Harper2012). Synthetic Aperture Radar (SAR) data has been found to effective for near real-time flood monitoring because of its ability to penetrate cloud cover which renders multispectral satellite data useless in the event of flood due to heavy rainfall. It can thus be used to map inundated areas (standing water) after heavy rainfall and to assess the flood damage, as standing water appears dark in SAR images due to specular reflection. The rough surface of fast flowing water, or that caused by rain or wind, cannot be mapped by SAR data because the roughness increases radar backscatter, giving a bright signature on the SAR image (Alsdorf et al., Reference Alsdorf, Rodríguez and Lettenmaier2007; Jung et al., Reference Jung, Hamski, Durand, Alsdorf, Hossain, Lee, Hossain, Hasan, Khan and Hoque2010). A change detection algorithm, mapping the difference between the images before and after flooding, has been shown to bring out the inundated areas effectively (Giustarini et al., Reference Giustarini, Hostache, Matgen, Schumann, Bates and Mason2013; Schlaffer et al., Reference Schlaffer, Matgen, Hollaus and Wagner2015).
Given the fact that the rift valley regions of Ethiopia are remote and data scarce, the objective of this paper is to demonstrate a method to assess and map flood prone areas to support flood-based management technologies and practices for converting flash floods to a productive use and supporting livelihoods by enhancing crop and fodder productivity across the Afar region. The paper also intends to provide quantitative estimates of flooded areas across districts of Afar that could lead to prioritization of actions and investment.
Study area
The study was carried out in the Afar region which is a sub-set of Danakil and Awash River basins of Ethiopia. The region is structured into five administrative zones and 29 districts. The altitude ranges from the lowest point of 116 m below sea level to about 2063 m above sea level (Fig. 1). As one of the hottest places on Earth, temperatures reaching 50°C are not uncommon. The annual average rainfall ranges from <100 mm in the lowland areas to >500 mm in the surrounding highlands.
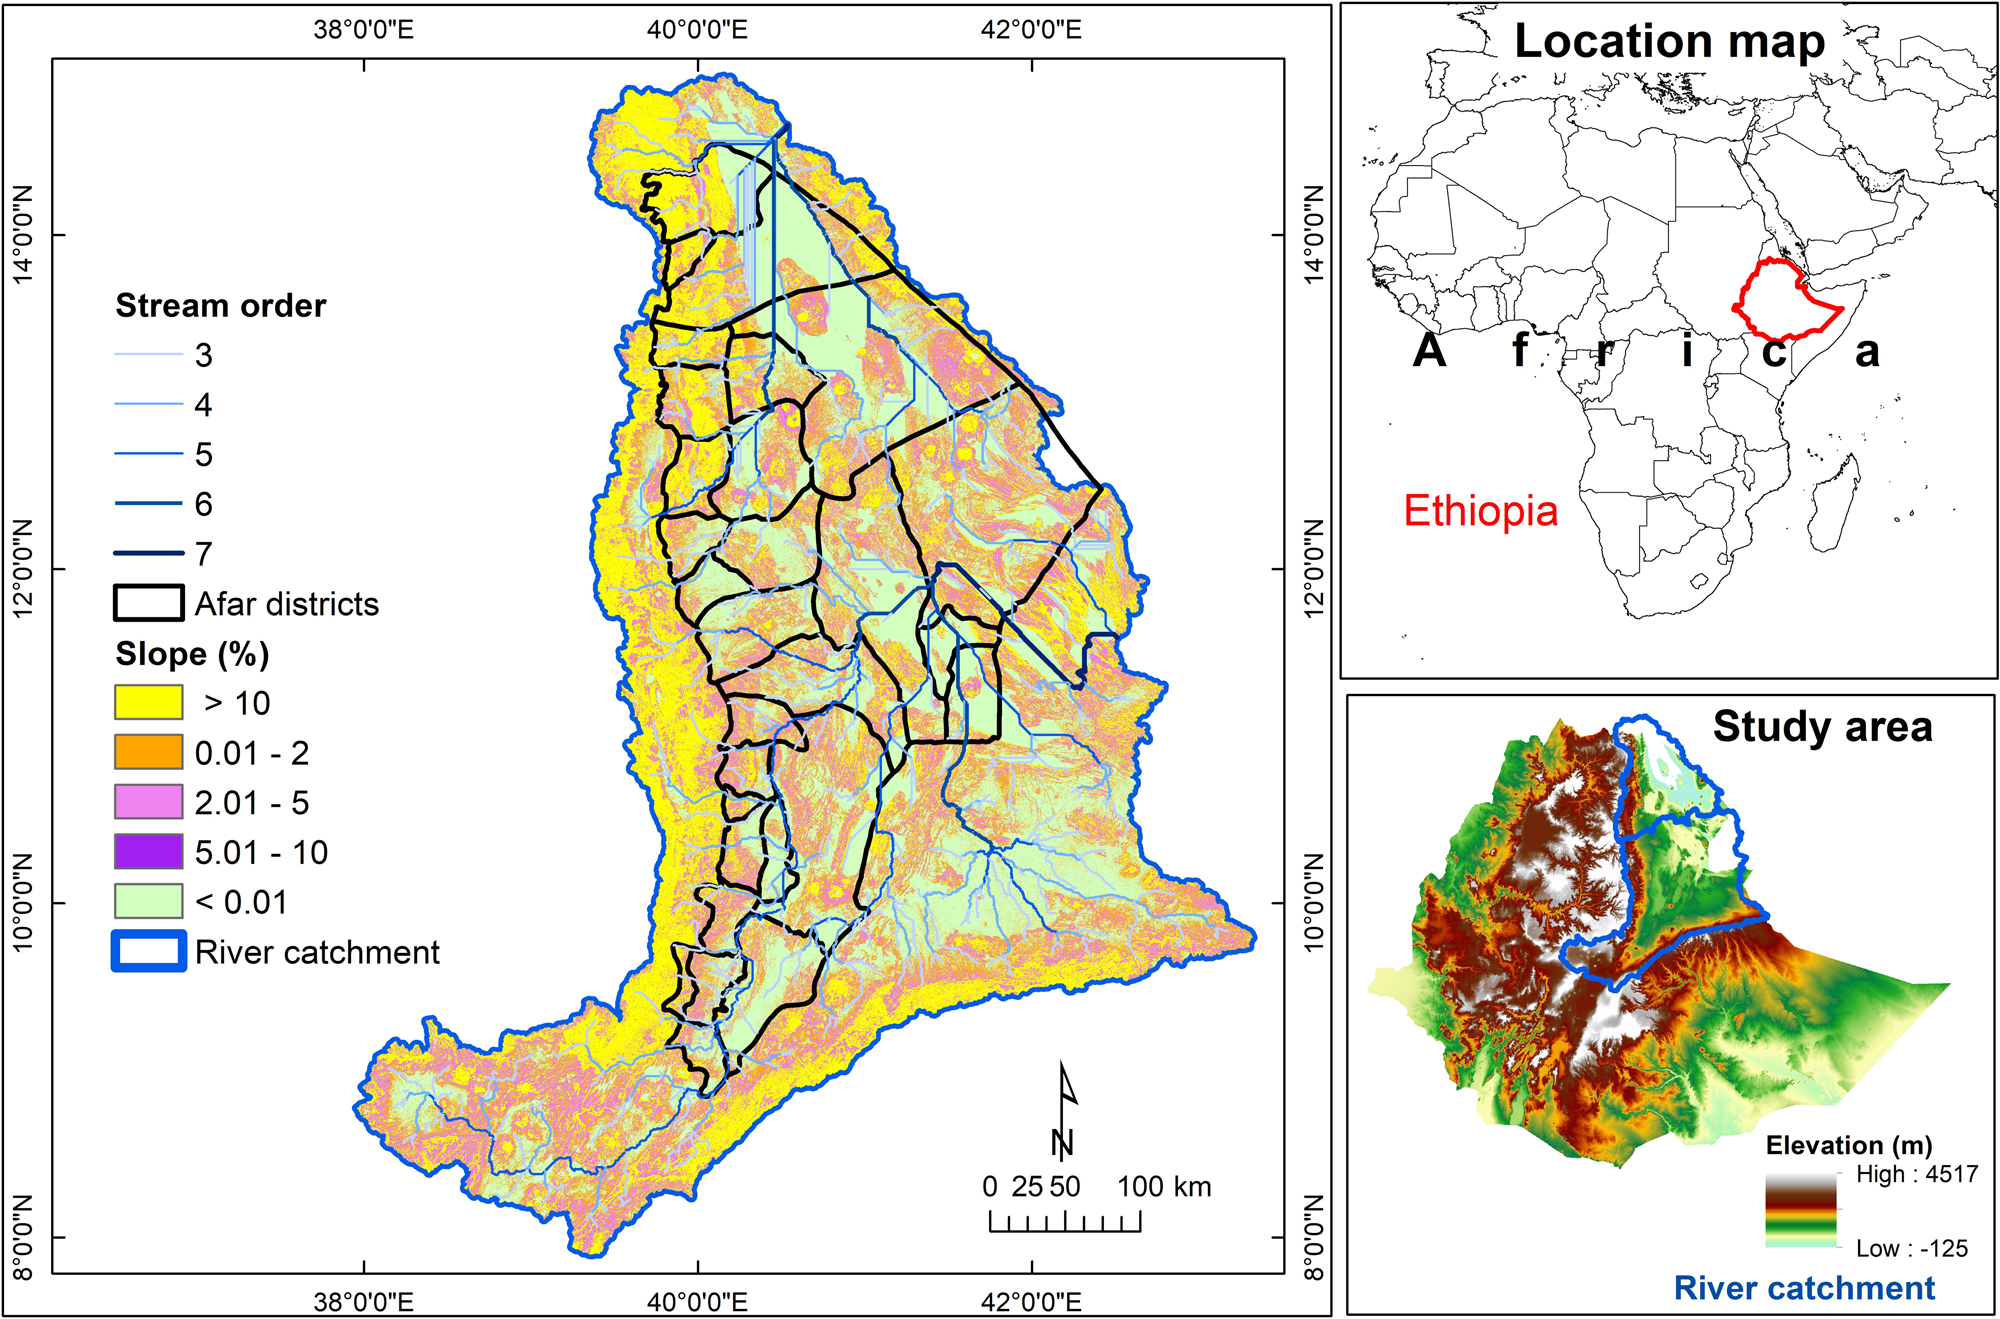
Fig. 1. Location map of the Afar region with major rivers and climate zones.
The region is found within the Danakil and Awash River Basin, which is located between 7°53′N and 12°N latitudes and 37°57′E and 43°25′E of longitudes (Taddese et al., Reference Taddese, Sonder and Peden2003), covering a total land area of 110,000 km2. The largest part of the Awash River Basin is located in the arid lowlands of the Afar Region in the northeastern part of Ethiopia which extends from semi-desert lowlands to cold high mountainous zones with extreme ranges of temperature and rainfall. There are three seasons in the Awash River Basin namely meher (rainy season/June–September), Bega (dry season/October–January) and belg (small rainy season/February–May). The region is hydrologically connected to the highlands of Oromia, Amhara and Tigray regional states from which the lowland of Afar receives floods occurring during the belg and meher seasons.
Data and methods
Satellite imagery and data preparation
MODIS NDVI 250 m
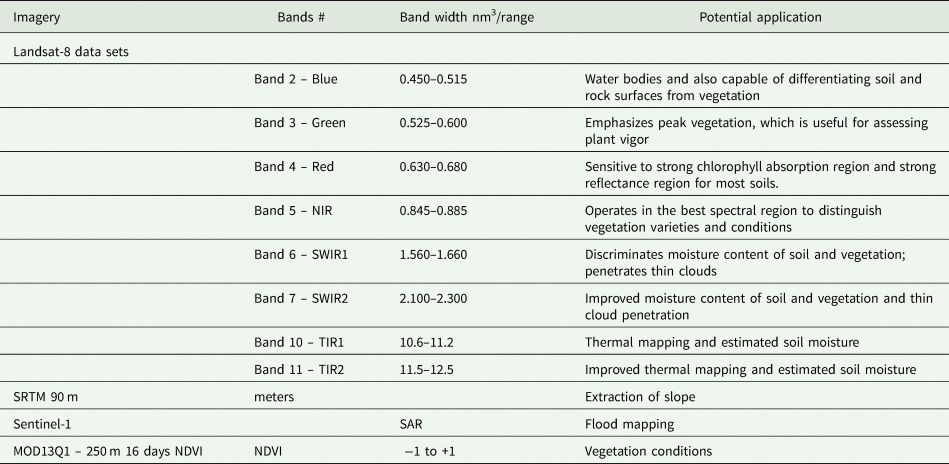
MODIS Terra Vegetation Indices 16-Day L3 Global 250 m SIN Grid V005 (MOD13Q1 product) imagery were used, which are freely available from the Land Processes Distributed Active Archive Center (https://lpdaac.usgs.gov/lpdaac/get_data/data_pool). MOD13Q1 16-day composite, four-band data for all 23 composite dates during January–December, 2017 were used in this analysis. Bands and vegetation indices contained in the MOD13Q1 product include blue, red and near infrared (NIR) and mid-infrared bands and normalized differentiation vegetation (NDVI) index (NDVI generated using NIR and red bands). The product is already atmospheric corrected and cloud contamination generated using 16-days maximum composite NDVI. Table 1 provides the data used in the study and description.
Table 1:. Data used for the present study and characteristics of satellite sensor data used in the study
Landsat-8 imagery
Landsat-8 images extracted from USGS Earth explorer (https://earthexplorer.usgs.gov/). In this study, we have used 11 Landsat 8 tiles (February 2017 and November 2017) which were captured in belg and meher seasons (Table 1). Image preprocessing start with image normalization, which means converting sensor captured digital number (DN) values to the reflectance.
Image normalization: The following equation is used to convert DN values to top of atmosphere (TOA) reflectance for OLI data
 $${\rm {\lambda }^{\prime}} = \;M_{\rho \;}Q_{cal} + \;A_\rho $$
where λ′ is the TOA planetary reflectance (without correction of solar angle), M ρ is the Band specific multiplicative rescaling factor from the metadata,  $A_\rho $is the band specific additive rescaling factor from the metadata and Q cal is the quantized and calibrated standard product pixel values (DN).
TOA reflectance with correction for the sun angle is then:
 $${\rm \lambda } = {\rm \;}\displaystyle{{{\rm {\lambda }^{\prime}}} \over {\sin ( \theta _{SE}) }}$$
where λ is the TOA planetary reflectance, λ′ is the TOA planetary reflectance (without correction of solar angle) and θ SE is the local sun elevation angle provided in the metadata (SUN_ELEVATION).
Sentinel-1 data
The Sentinel-1 mission provides data from a dual-polarization C-band Synthetic Aperture Radar (SAR) instrument. This collection includes the S1 ground range detected (GRD) scenes, processed using the Sentinel-1 Toolbox to generate a calibrated, ortho-corrected product. The collection is updated weekly. The GRD scenes either of the three resolutions (10, 25 or 40 m). It consists of combinations of four bands i.e., single band VV or HH, and dual band VV + VH and HH + HV: 1. VV: single co-polarization, vertical transmit/vertical receive 2. HH: single co-polarization, horizontal transmit/horizontal receive 3. VV + VH: dual-band cross-polarization, vertical transmit/horizontal receive 4. HH + HV: dual-band cross-polarization, horizontal transmit/vertical receive (Sentinel-1 User Handbook, 2013, ESA, 2014). The data is freely available from Copernicus Open Access Hub the open hub site or it can be accessed from cloud computing platform Google Earth Engine.
In the study in order to assess the flooded areas, the freely available Sentinel-1 GRD, single band VV polarized data during peak flood periods of the Ethiopia region i.e., February–September 2017 downloaded from open access hub site (https://scihub.copernicus.eu/dhus/).
SRTM DEM data
The Shuttle Radar Topography Mission (SRTM) – a mission of NASA provides information regarding surface topography for better understanding of geospatial features of Earth which is obtained from elevation data at 90 m spatial resolution on a near-global scale to generate the most complete high resolution digital topographic database of the Earth (SRTM technical guide). SRTM data can be downloaded from USGS Earth Explorer at 30 m (1-Arc Second) and 90 m resolutions. In this study we used DEM for extraction of a slope.
Ground survey data
A ground survey was conducted in 2 different years, the first visit was done in August 2017 and the second one was during August 2018 for the meher season. The survey was conducted as training and validation, for both classifying land use/land cover (LULC) and assessing the accuracy map. Altogether 316 locations (65 locations in 2018 and 251 locations in 2017) covering major land use/land cover areas in entire river catchment were recorded. Each location, data were collected from 90 × 90 m plots and consisted of GPS locations, land use categories, land cover percentages, cropping pattern during different seasons (through farmer interviews), crop types and watering method (irrigated, rainfed) along with other LULC areas. Samples were obtained within large contiguous areas of a particular LULC. Locations were chosen based on the knowledge of field staff and agriculture officers to ensure that the crops were grown during the belg season during the survey. Overall, 316 spatially well-distributed data points (Fig. 2) were collected; of these, 68 data points were used for identification and labeling class names while an additional 248 data points were used for accuracy assessment.
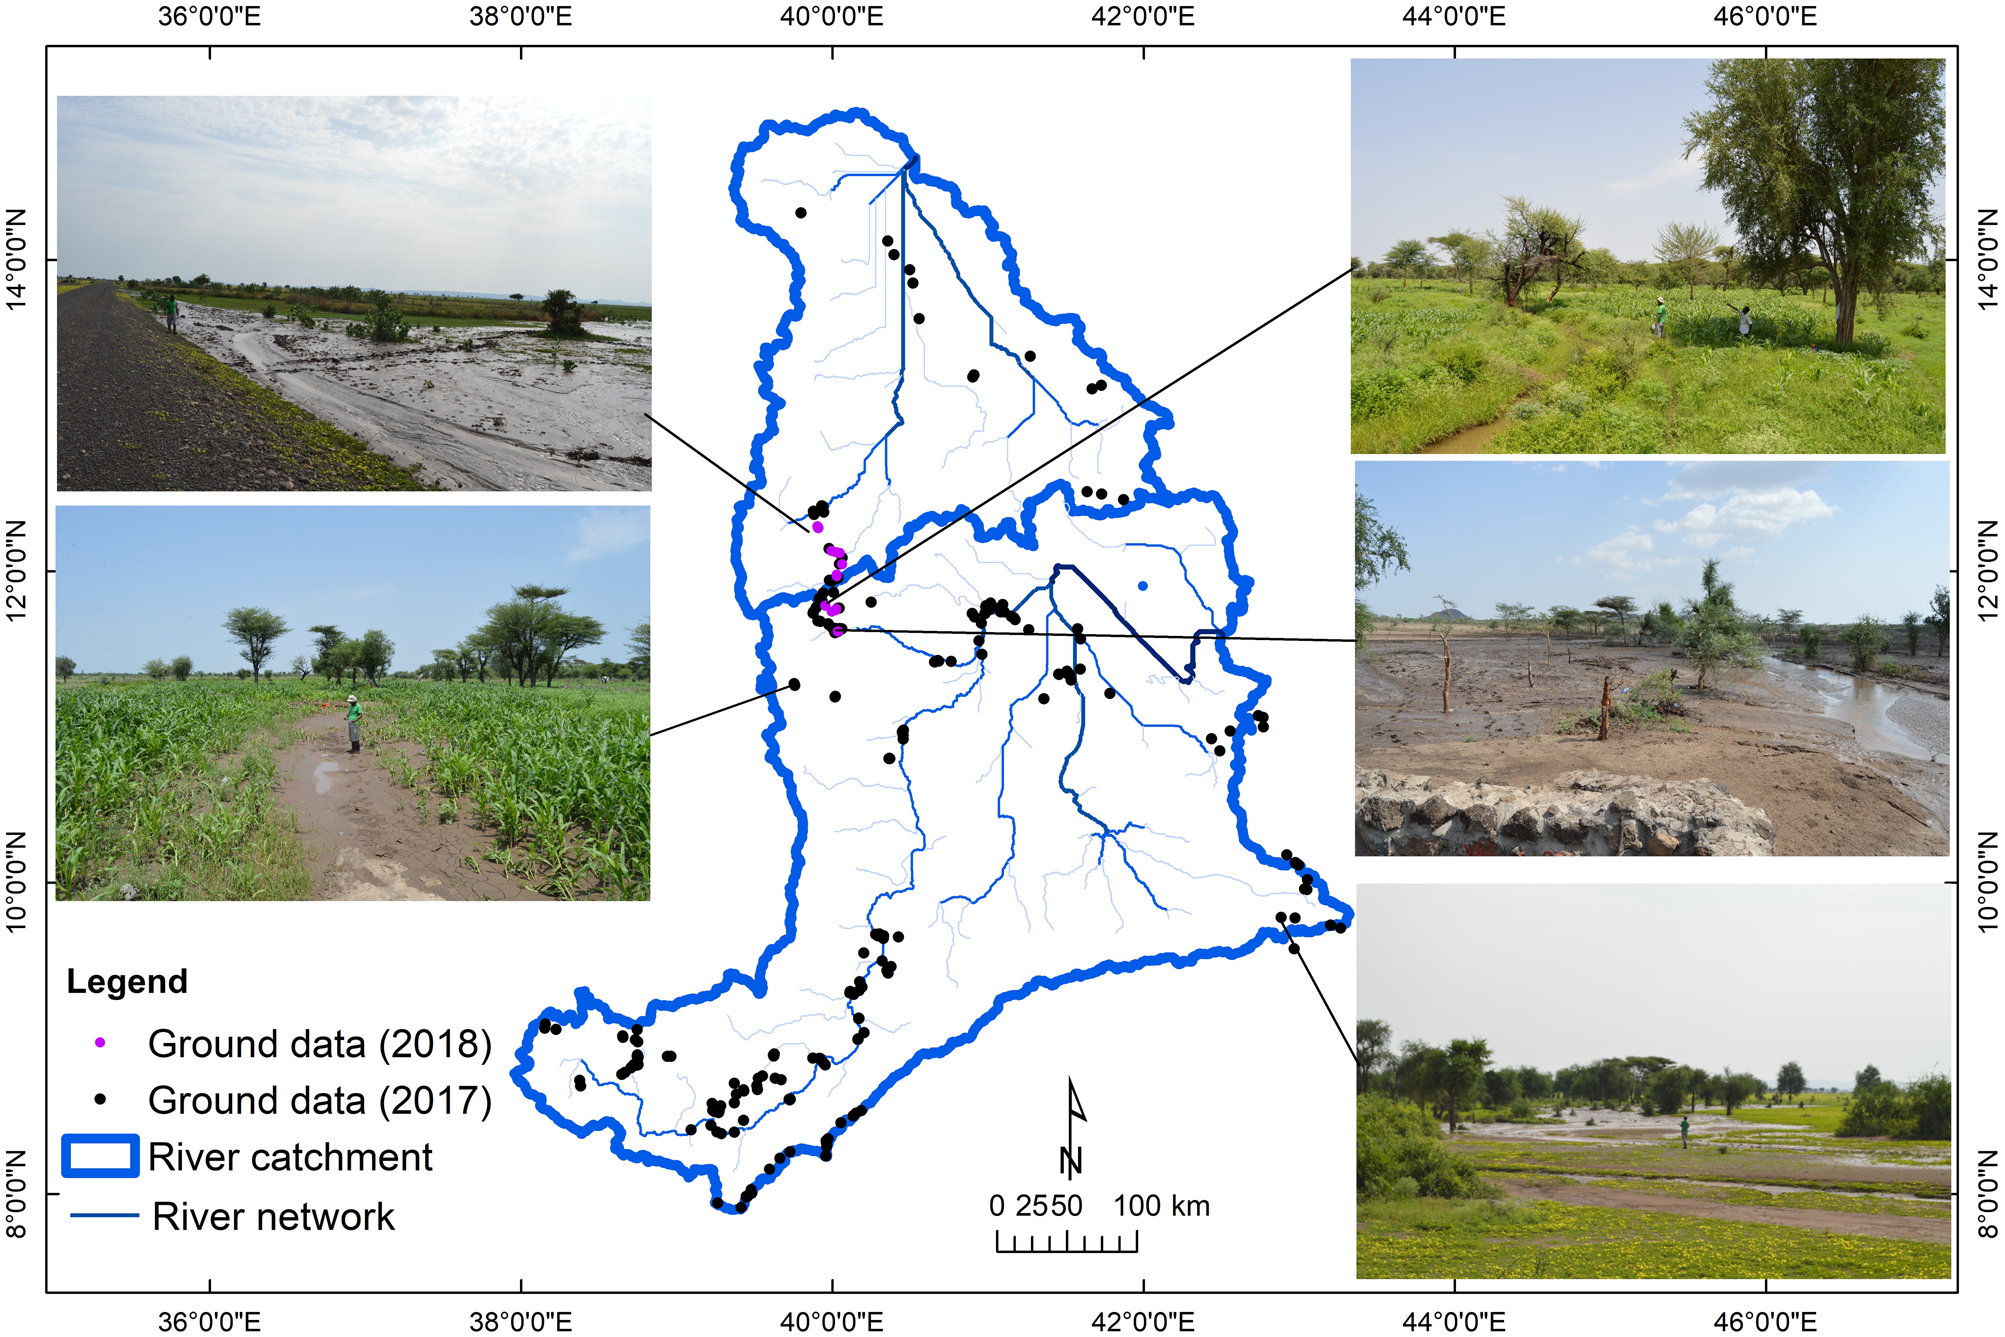
Fig. 2. Ground survey data locations in Afar regions during meher season.
The methodology for the identification and mapping of flood prone areas and areas targeting of new technologies is shown in Figure 3 and is described in the following sections. We have started the process with multi sensor image preprocessing
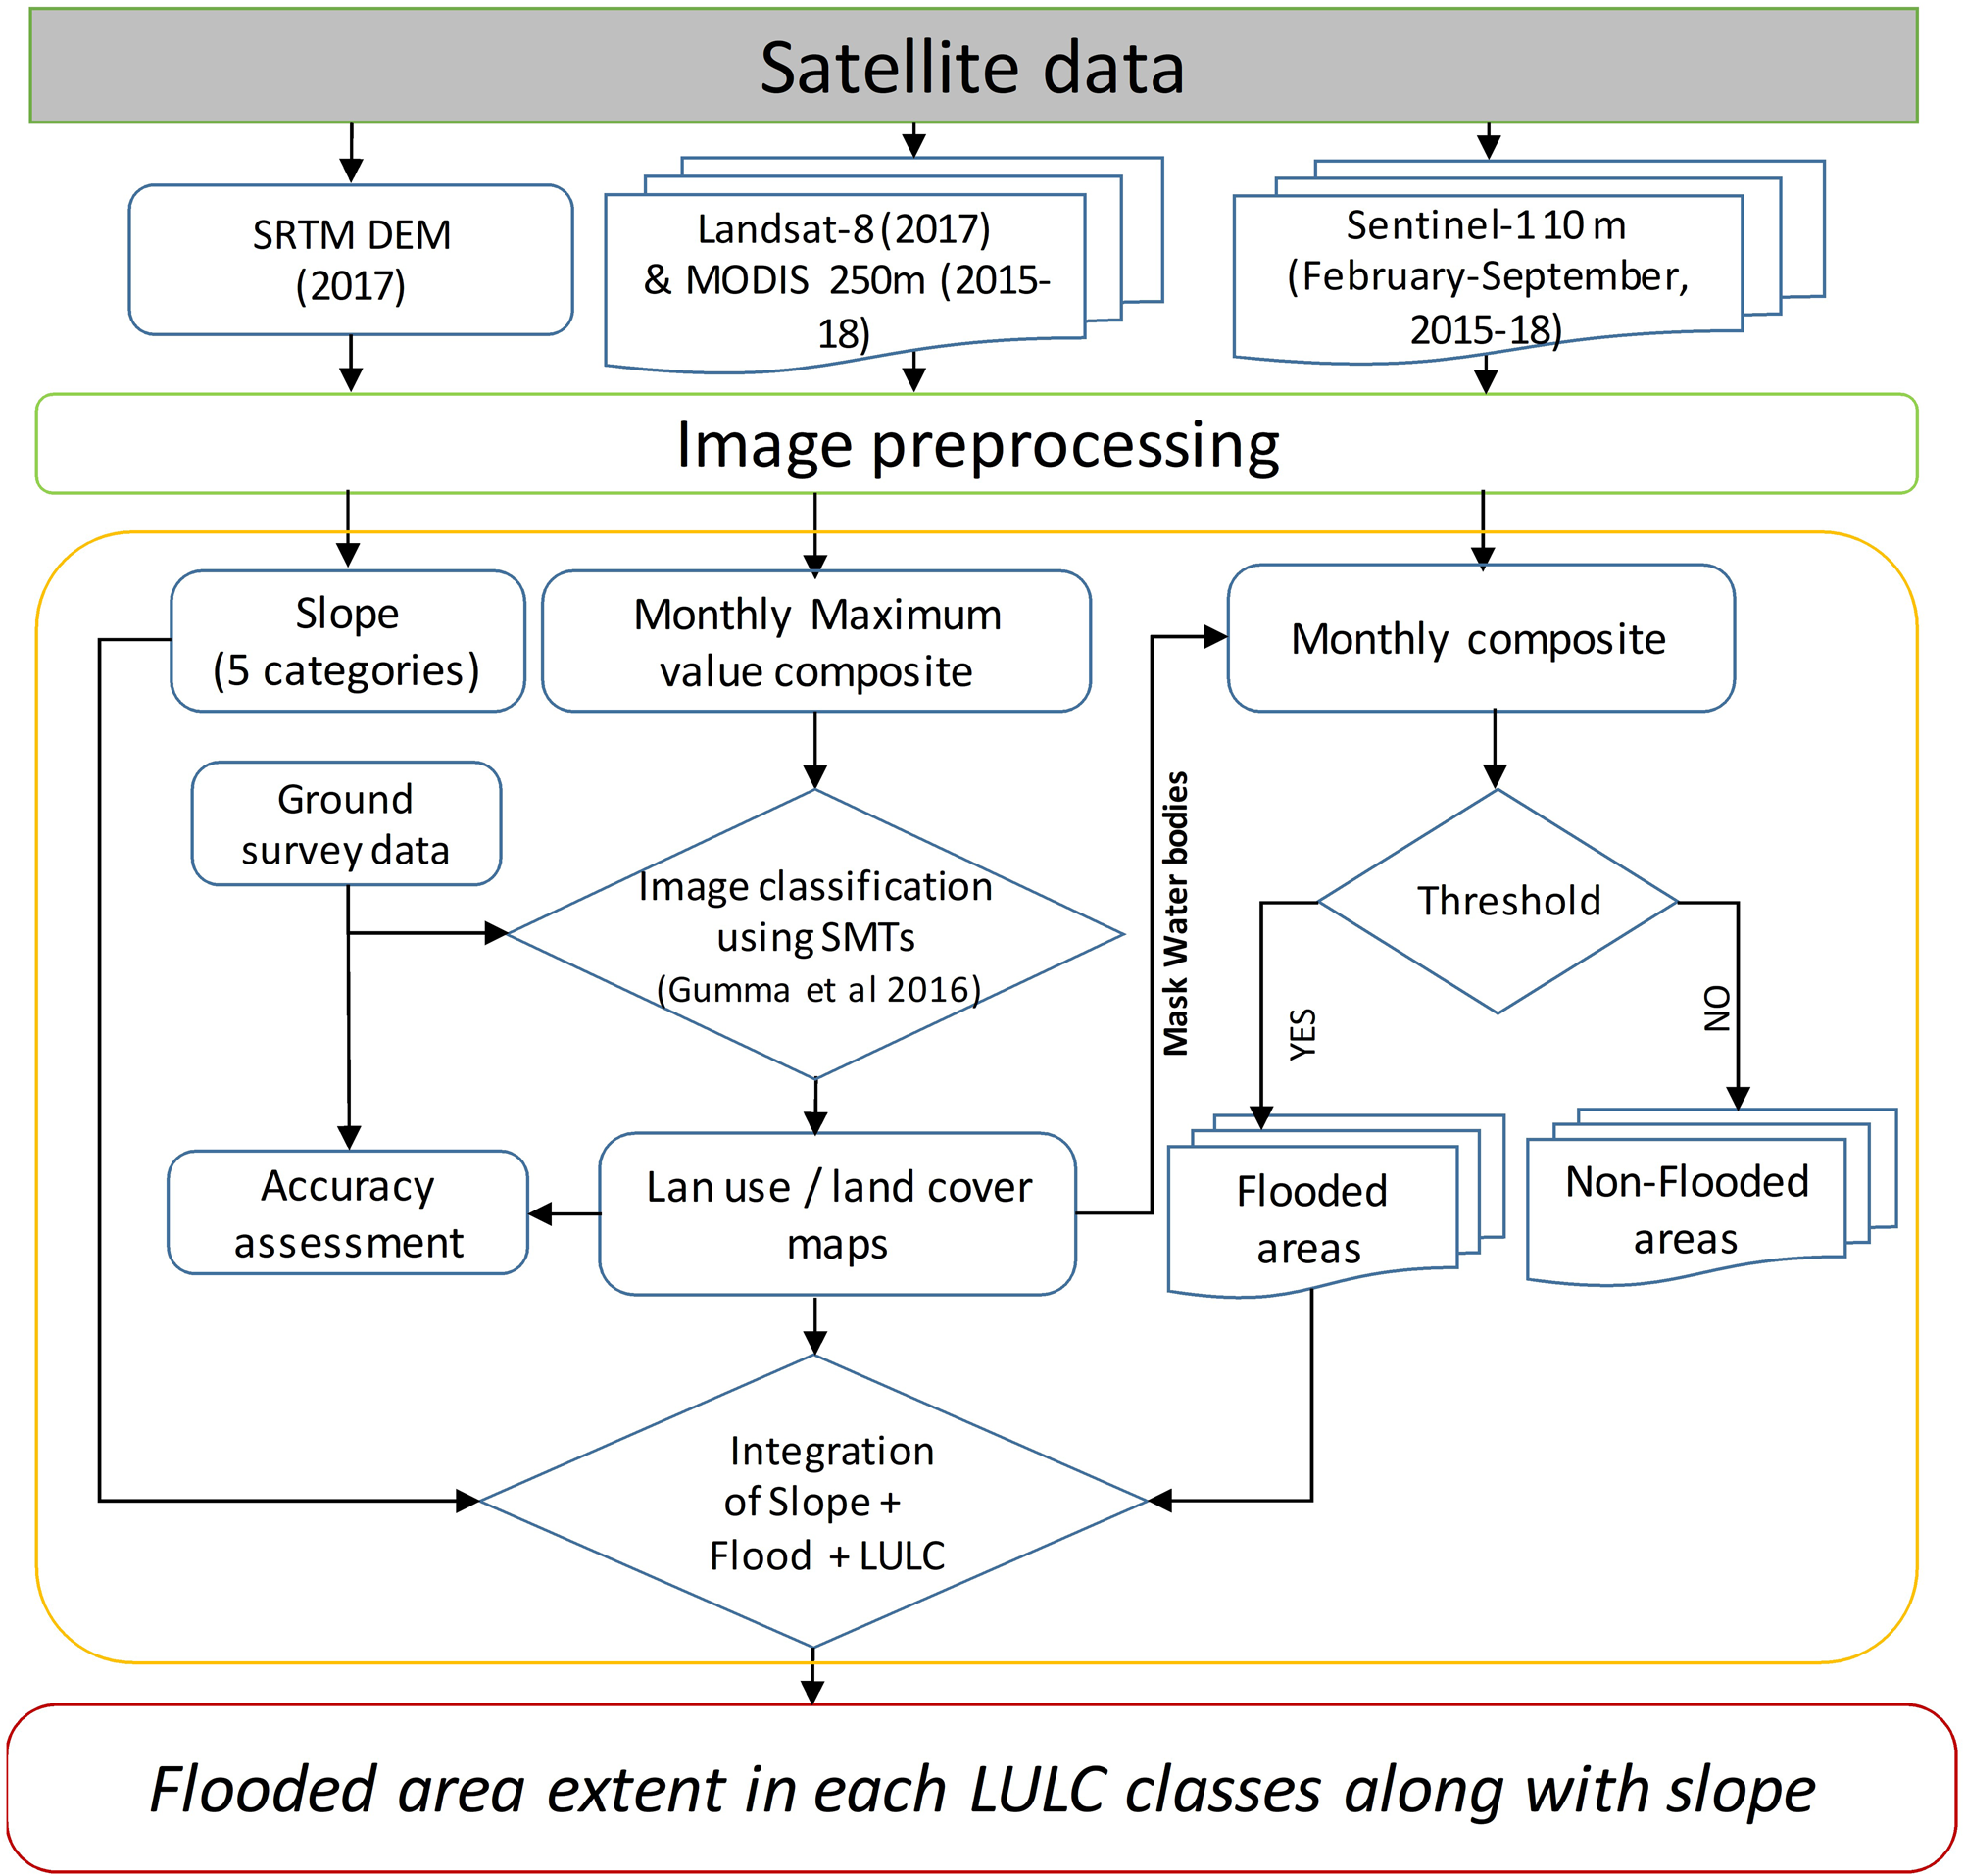
Fig. 3. Overview of the methodology for assessing flood prone areas using integrated remote sensing techniques.
Land use/land cover classification
A time series of MODIS 16-day composite vegetation index images at 250 m resolution were obtained for the period of 01 January 2017 to 31 December 2017 (MOD13Q1 data product). The 16-day composite images in the MOD13Q1 dataset are available in the public domain and are pre-calibrated (http://modis-sr.1tdri.org/html). The large scene size and daily overpass rate of MODIS makes it attractive for mapping large crop areas, and NDVI derived from MODIS has high fidelity with biophysical parameters (Gumma et al., Reference Gumma, Thenkabail, Deevi, Mohammed, Teluguntla, Oliphant, Xiong, Aye and Whitbread2018a). The 16-day NDVI images were stacked into a 23-band file for each crop year (two images per month). The monthly maximum value composites were created using 16-day NDVI MODIS data to minimize cloud effects.
Unsupervised classification as described by Cihlar et al. (Reference Cihlar, Xiao, Chen, Beaubien, Fung and Latifovic1998) was used to generate initial classes. The unsupervised ISOCLASS cluster algorithm (ISODATA in ERDAS Imagine 2014TM) run on the NDVI-MVC generated an initial 40 classes, with a maximum of 100 iterations and convergence threshold of 0.99. Though ground survey data was available at the time of image classification, unsupervised classification was used in order to capture the full range of NDVI over a large area. The use of unsupervised techniques is recommended for large areas that cover a wide and unknown range of vegetation types, (Biggs et al., Reference Biggs, Thenkabail, Gumma, Scott, Parthasaradhi and Turral2006). Based on the above methodology, we classified LULC for the entire study area.
SAR processing
Google Earth Engine's collection of Sentinel-1 data contains all the GRD images from 03rd October 2014. These are the Level-1 scenes processed to backscatter coefficients (σ 0) in decibels (dB) (Sentinel-1 User Handbook, 2013, ESA, 2014). The steps involved in pre-processing of the Sentinel-1 images in order to obtain the Level-1 backscatter images are: (1) application of orbit file; (2) removal of GRD border noise and invalid data on the scene edges; (3) thermal noise removal to remove additive noise in sub-swaths; (4) radiometric calibration to compute the backscatter intensity and (5) terrain correction to compute σ 0 on the basis of Digital Elevation Model (DEM). VV polarized images were considered as advantageous for flood mapping when using Sentinel-1 data (Gumma et al., Reference Gumma, Uppala, Mohammed, Whitbread and Mohammed2015; Twele et al., Reference Twele, Cao, Plank and Martinis2016).
Monthly composite images were computed from the pre-processed images to carry the monthly pattern of flooding during 2017 (eight images in a year). Masking of the non-water bodies from the sentinel 1 images was done using the above prepared LULC (2016–2017) as the reference map.
A well-known fact is that water bodies have low backscattering radar signals due to flat and smooth surface. A simple thresholding technique applied on the radar backscatter image, with the threshold values based on a visual inspection and expert knowledge, would effectively map the submerged areas, when these areas are open and considerably larger in size than the spatial resolution of the Sentinel-1 images. Finally, flooded areas/water bodies were mapped and non-flooded areas were masked. These steps were repeated for 3 years, 2015 to 2018, with eight independent images per year.
Submergence of flooded area
We have integrated the slope and flood files to generate the submergence of area in each of the slope category. Finally, the LULC map was integrated with the submergence (flooded) area while the extent of LULC was extracted for each class areas affected with flood. Figure 3 illustrates the overall methodology of assessing the submergence (flooded) area extent in each LULC class. A land-water threshold was manually applied to classify the images into two classes: land and water.
Assessing flood prone areas
After monthly mapping of flood for the belg and meher seasons, we quantified flood frequency during 4 years (2015–2018) considering only flood class. The ERDAS modeler was used to quantify the frequency of flood from 2015 to 2018, considering pixel wise flood. Equation (3) was used to assess flood frequency from 2015 to 2018.
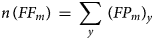 $$n\,( FF_m) \,= \,\mathop \sum \limits_y \,( FP_m) _y$$
where n (FF m) is the flood frequency for month, m = (FP m)y is flood pixel for the month for corresponding year (y = year i.e. 2015, 2016,…,2018) (m = month i.e February,….September)
Results and discussion
In this section, LULC, accuracy assessment and spatial extent of flooded areas have been generated for each district. In addition, we identified the flood frequency in each month of the belg and meher seasons. This study identified 29 administrative units affected by floodwaters.
Spatial distribution of land use/land cover
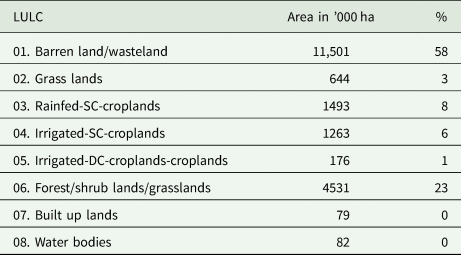
Figure 4 illustrates the spatial distribution of LULC during 2017 period for Awash basins that feed into the Afar region. The generated LULC map consisted of eight classes i.e., barren land/wasteland, grassland, rainfed-single crop (SC)-croplands, irrigated-SC-croplands, irrigated-double crop (DC)-croplands, forest/shrub lands/grasslands, built up lands and water bodies. About 85% of total area currently accounts for non-agricultural land. The majority of LULC comprises barren land/wasteland, forest/shrub lands/grasslands etc. Built-uplands and waterbodies covered the least area i.e. 79,462 and 83,013 ha, respectively (Table 2). Rainfed agriculture covers 1,275,443 ha whereas irrigated single and double croplands cover 1,451,694 ha.
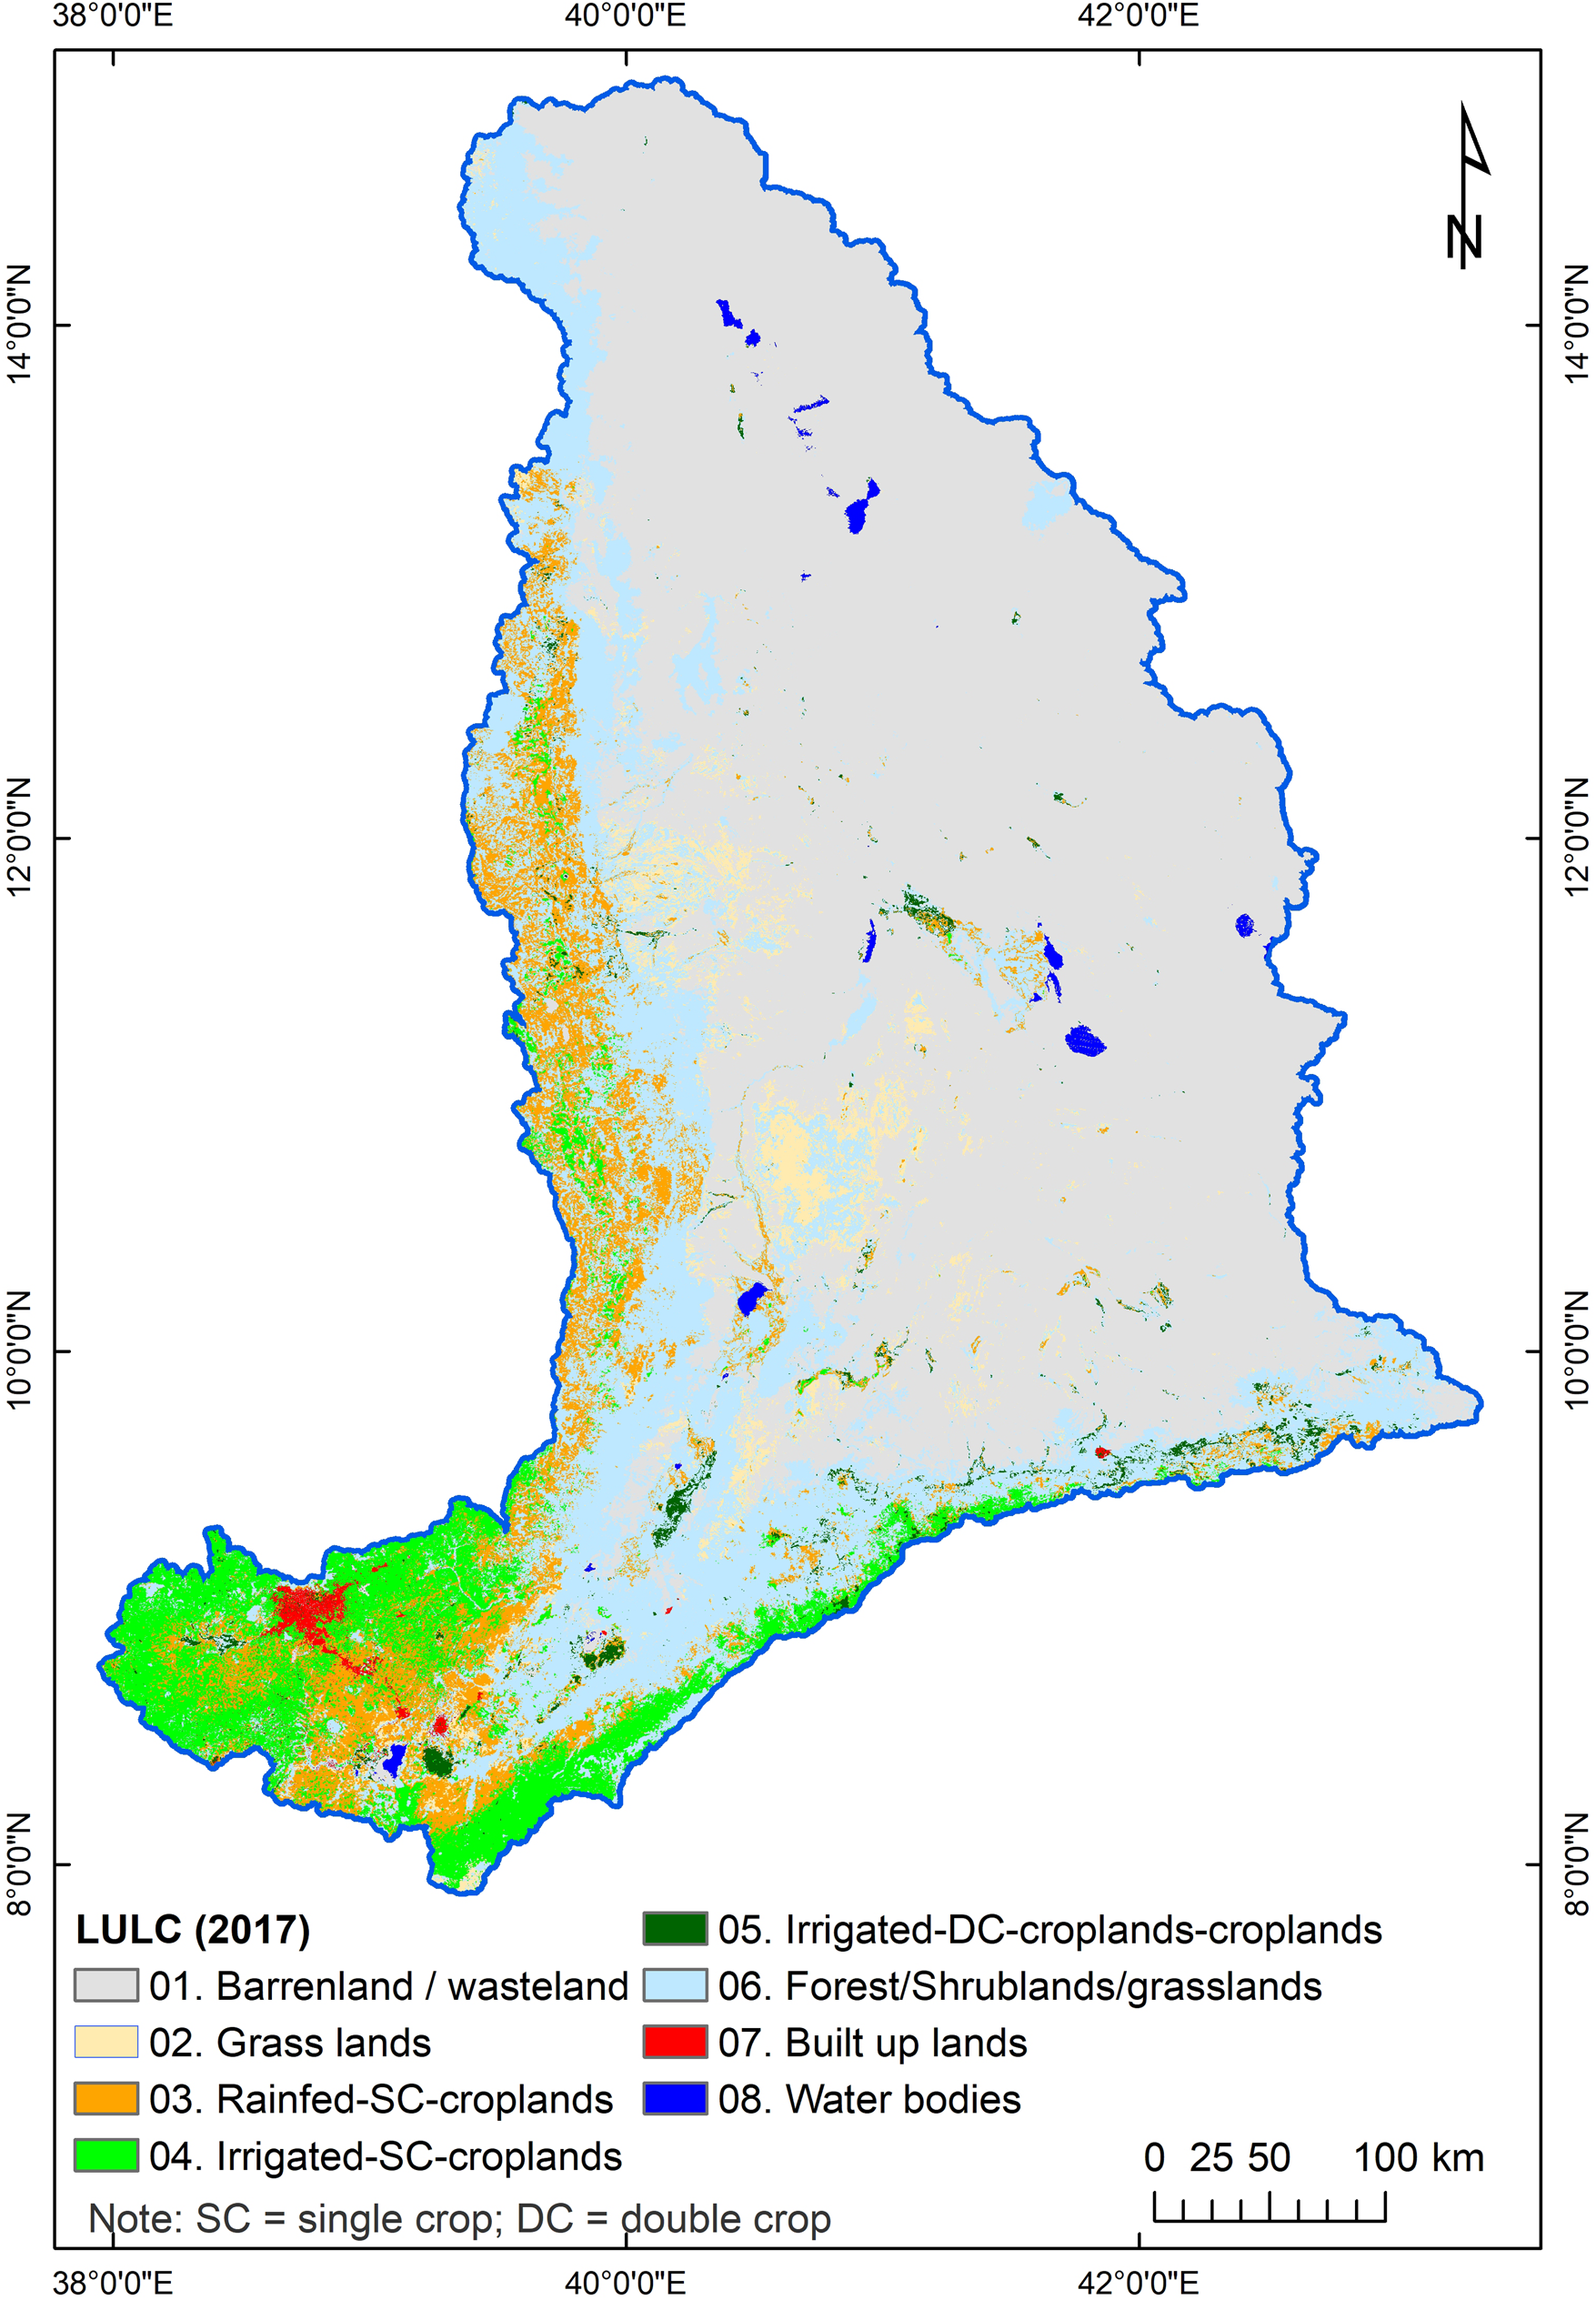
Fig. 4. Spatial distribution of LULC (derived from 2017 MODIS composite) (Note: SC, single crop; SW, surface water; DC, double crop).
Table 2. Area coverage and relative proportion of the eight LULC classes for the year 2017
Accuracy assessment
A quantitative accuracy assessment was done through an error matrix (Jensen, Reference Jensen1996) to examine LULC units. The ground survey data was based on an extensive field campaign conducted throughout the Afar region during the meher seasons for the crop years of 2016–2017. Accuracy was performed on classified LULC 2016–2017 map. The remaining 363 ground data points were used as validation to assess LULC classification accuracy. Accuracy assessment was performed with independent datasets.
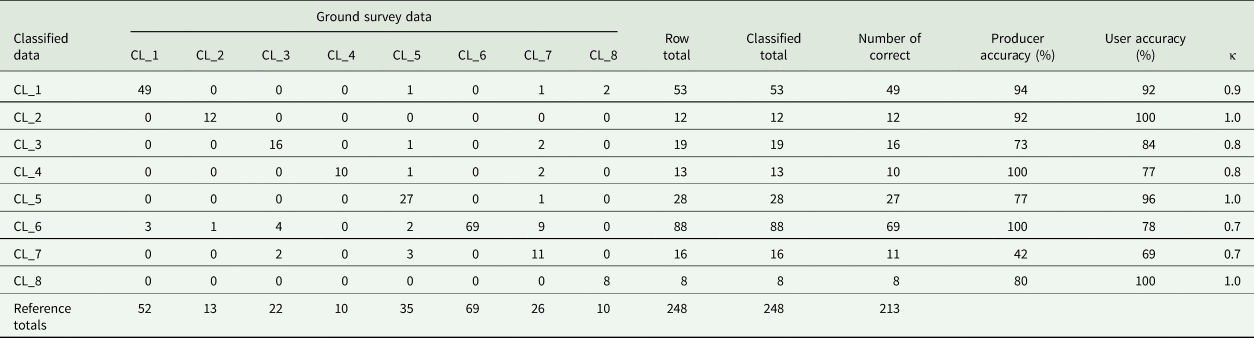
Table 3 shows the error matrix of each product. In LULC, considering non-agricultural classes (1, 2, 6, 7 and 8) out of 170 points 149 points are correct with nearby user's accuracy of 88%. For an agricultural class like rainfed-SC-croplands (cl_04) out of 22 points 16 were correct, while for irrigated-SC-croplands (cl_05) out of 10 points 10 were correct, while for irrigated-DC-croplands-croplands (cl_06) out of 35 points 27 were correct. Considering the overall agricultural classes, 53 out of 67 points were correct with user's accuracy of 80%. For all the 11 classes, 213 points out of 248 matched with the same class of reference data. The accuracy for the final eight classes of 2017 was 85.89% with a κ value of 0.8277 (Table 3). The loss of accuracy was mainly due to the coarse resolution of MODIS data.
Table 3. Accuracy assessment of Landsat derived LULC classes through error matrix using ground data
Spatial distribution of flooded areas
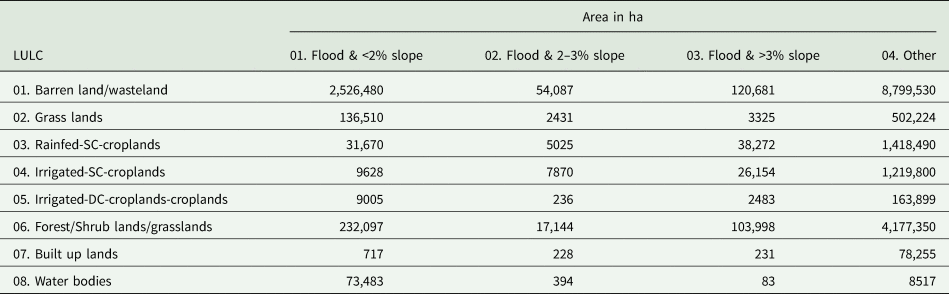
Table 4 provides the proportion of flooded area under various LULC, disaggregated by slope category. Barren land/wasteland and forest/shrub lands/grasslands LULC classes are found to be the most flood prone areas under each slope category. Areas with a slope less than 2% comprised the dominant flooded area in Afar. About 50,303, 13,130 and 66,909 ha of the cultivated (rainfed and irrigated) land under slope category of <2, 2–3 and >3%, respectively, were found to be flood prone areas. The spatial distribution and extent of flooded area varied from month to month and from year to year (Figs. 5a and 5b).
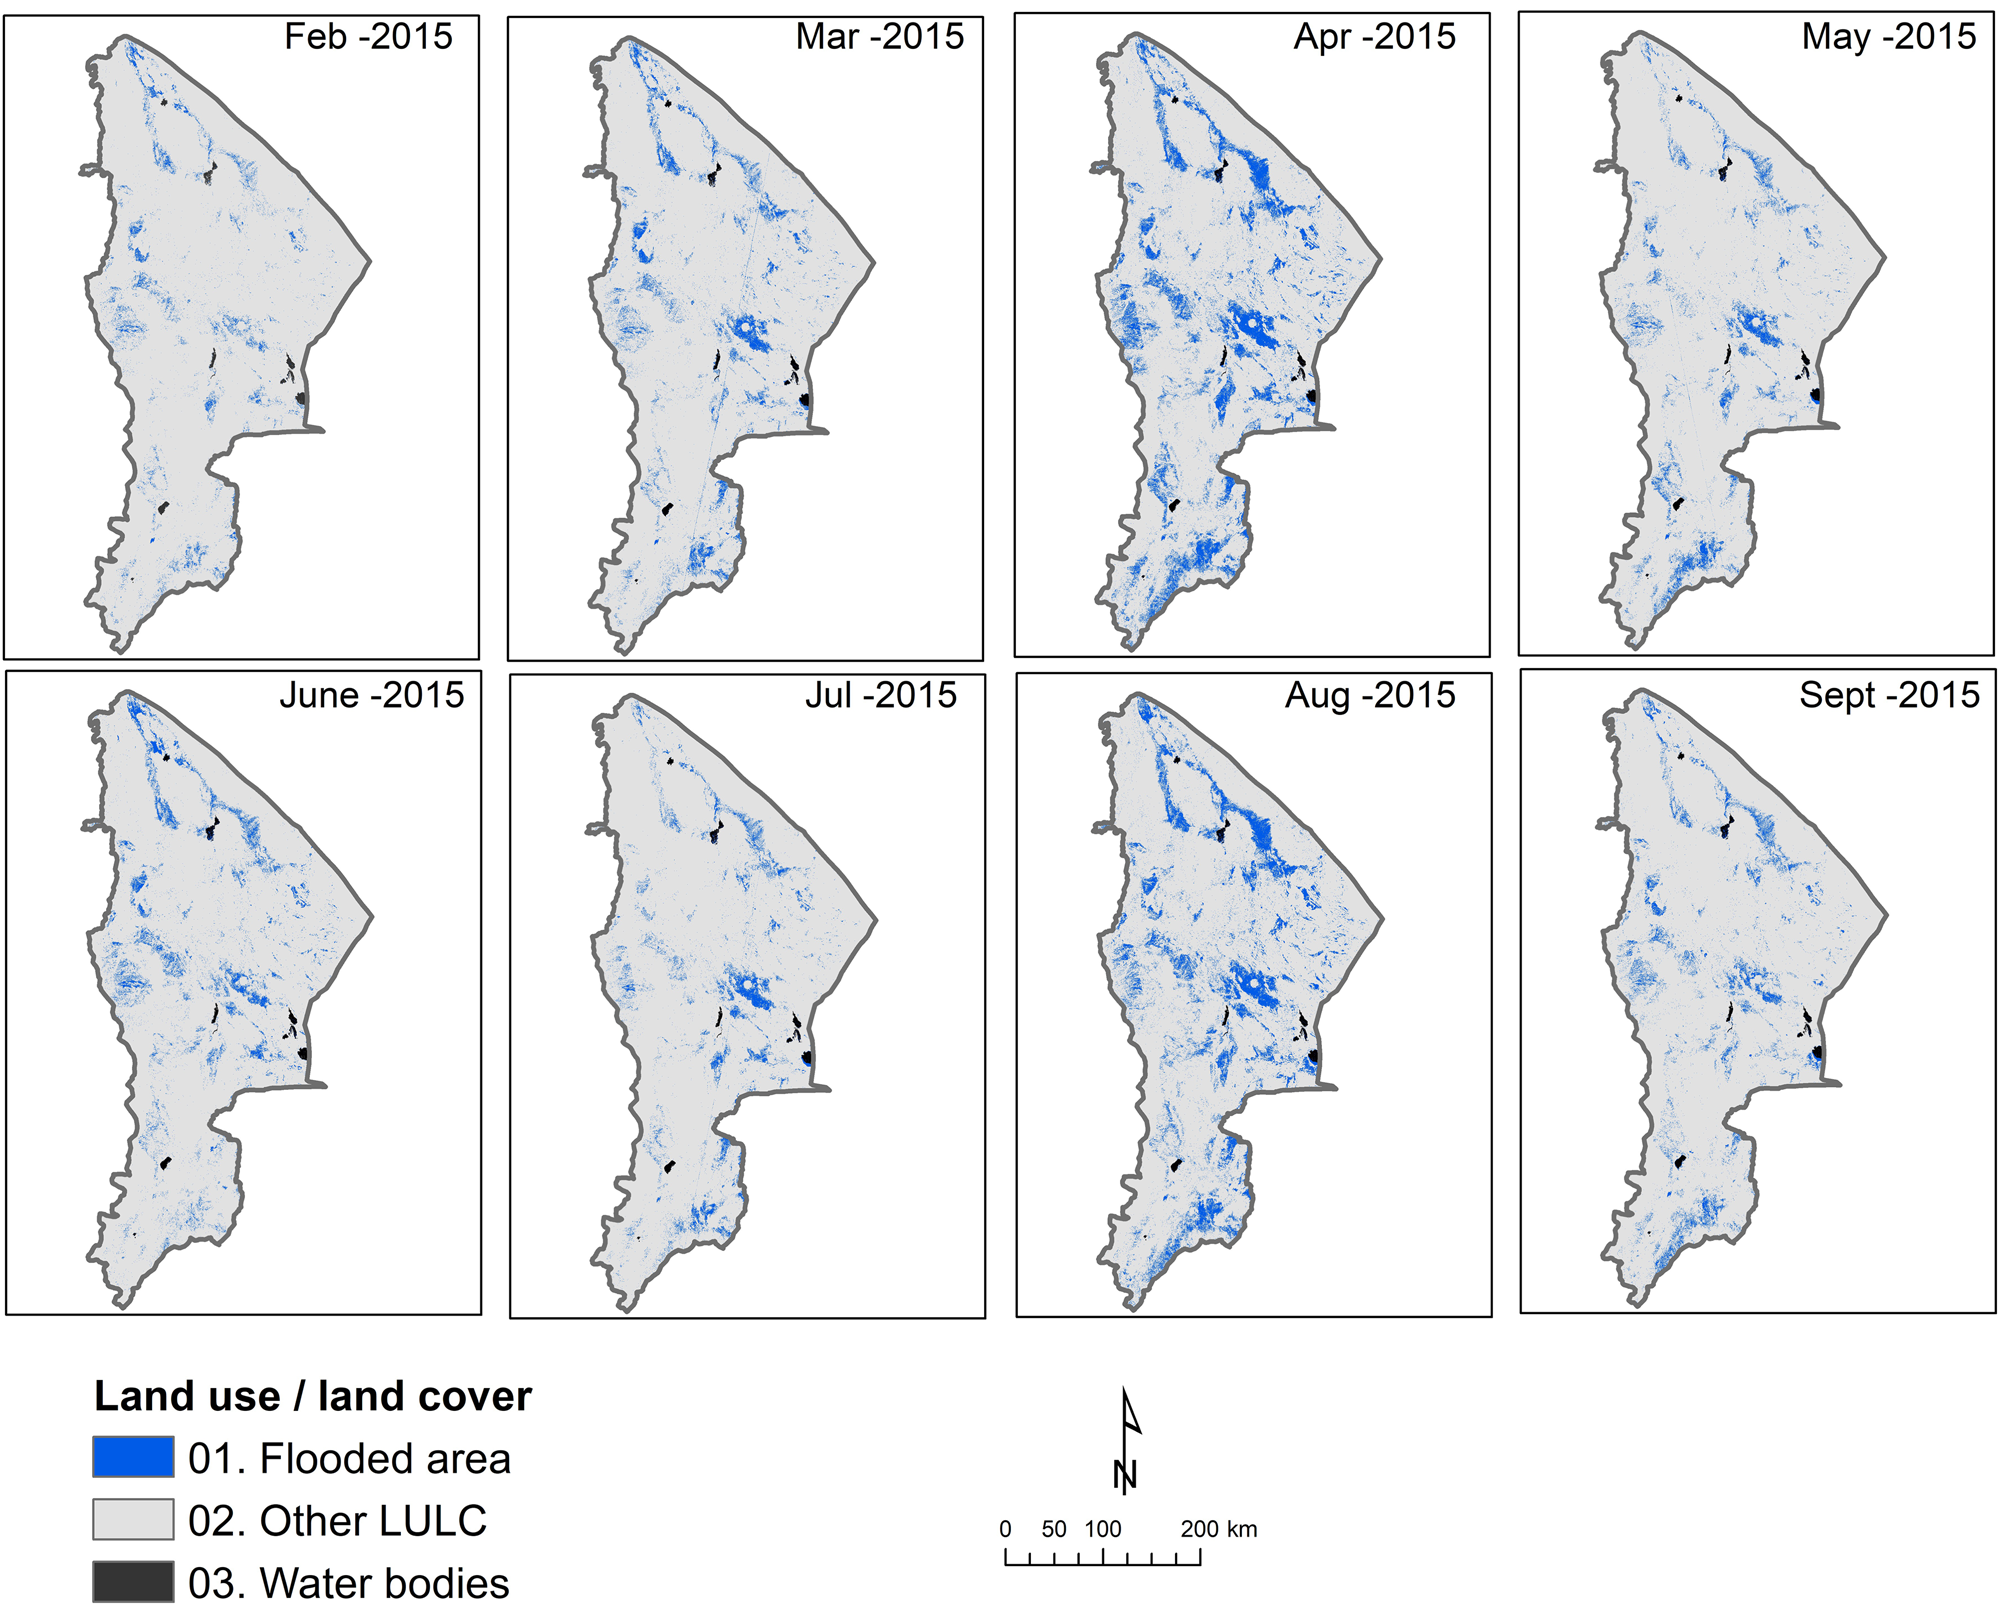
Fig. 5a. Spatiotemporal distribution of floods in the Afar administrative region during 2015.
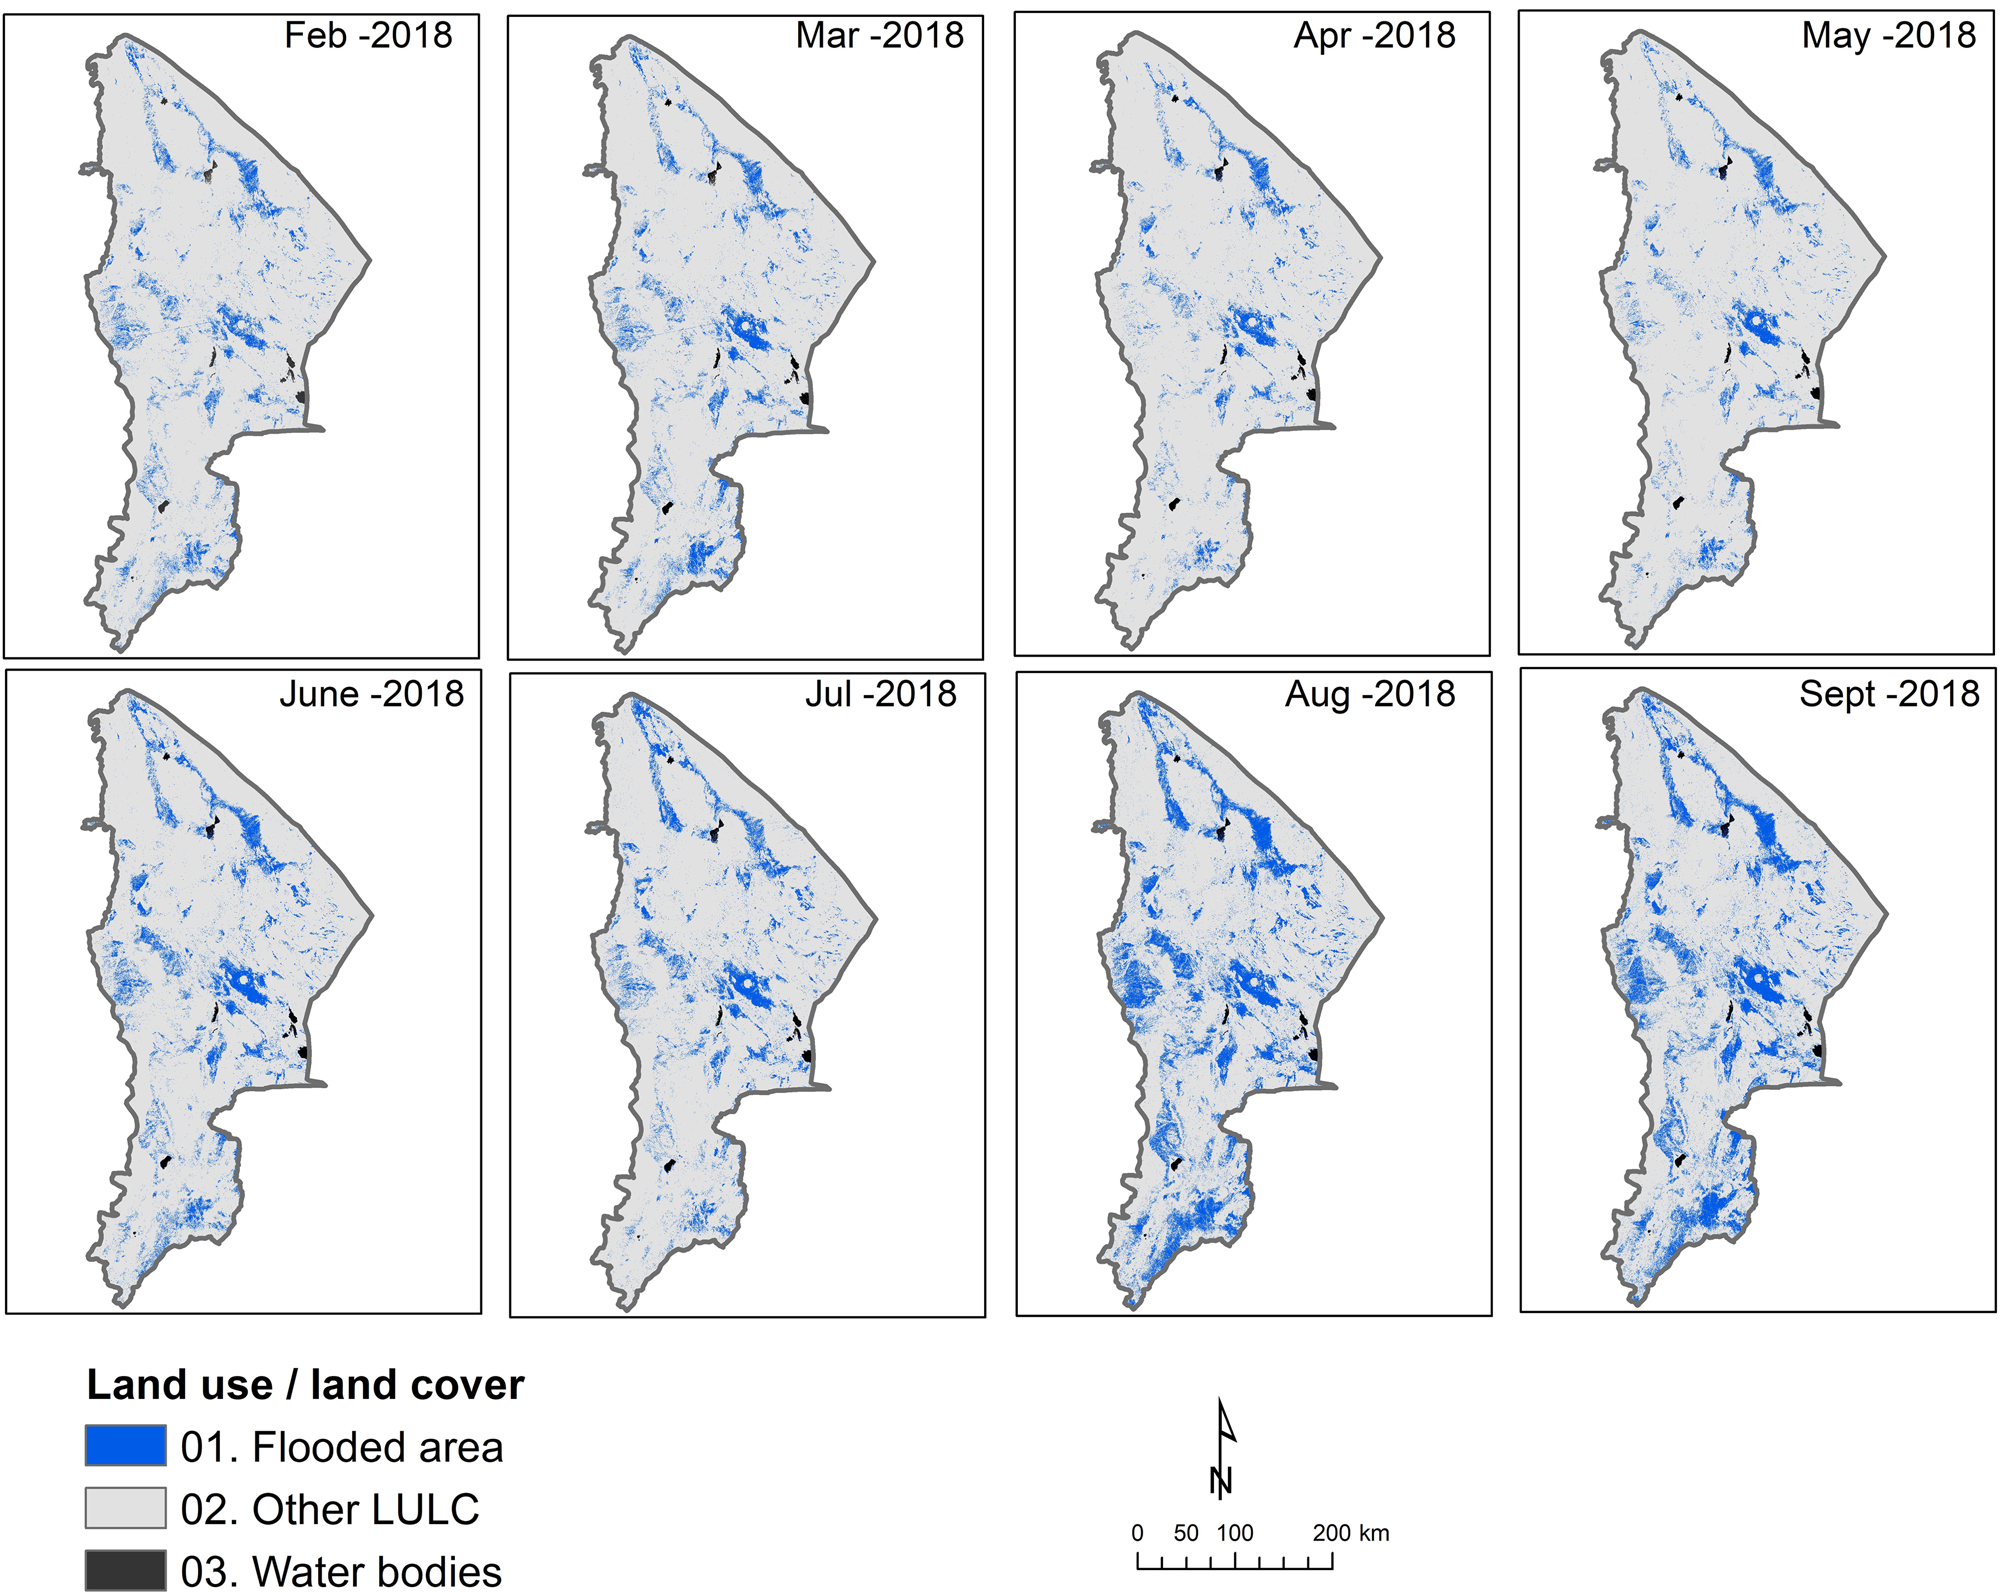
Fig. 5b. Spatiotemporal distribution of floods in the Afar administrative region during 2018.
Table 4. Flooded area extent in each LULC classes along with slope
Temporal variation of flood in Afar
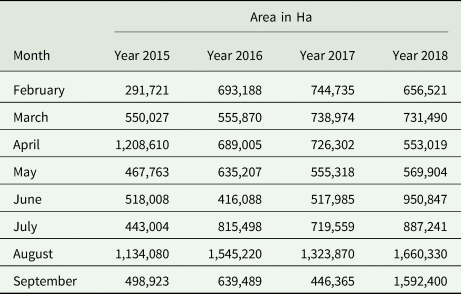
In all years but 2015, the flooded areas during the meher season were larger than the area flooded during the belg season. Ground observations also showed that the year 2015 received uniquely high belg floods and lower meher flood events compared with a ‘normal’ year. In 2015, the July flood covered the smallest area of about 443,000 ha compared to the 815,000 ha in 2016; 720,000 ha in 2017 and 887,000 ha in 2018 (Fig. 5b). July is a critical month for flood-based production system due to the fact that planting depends mainly on the flood received during this month. August is a month with a large area of flood across years as it is the peak rainy month in the upstream highlands. Regular flooding in July may allow more successful implementation of feed and food production because flood would continue to occur in the succeeding month of August, with higher confidence. Generally, a minimum of 720,000 and 550,000 ha of land could be considered for planning flood-based development in Afar using the meher and belg seasons, respectively. The actual amount of land that could be developed each season could, however, be less than the identified area due to poor soils and very high temperature in the eastern part of the basin. The socio-economic conditions, particularly the pastoral settings of the community, may not also allow farming in some grids even if flood is available. Table 5 and Figure 6 show temporal variations of flooded areas across the study region. Figure 6 clearly shows that flooding was less in 2015 compared with the other years.
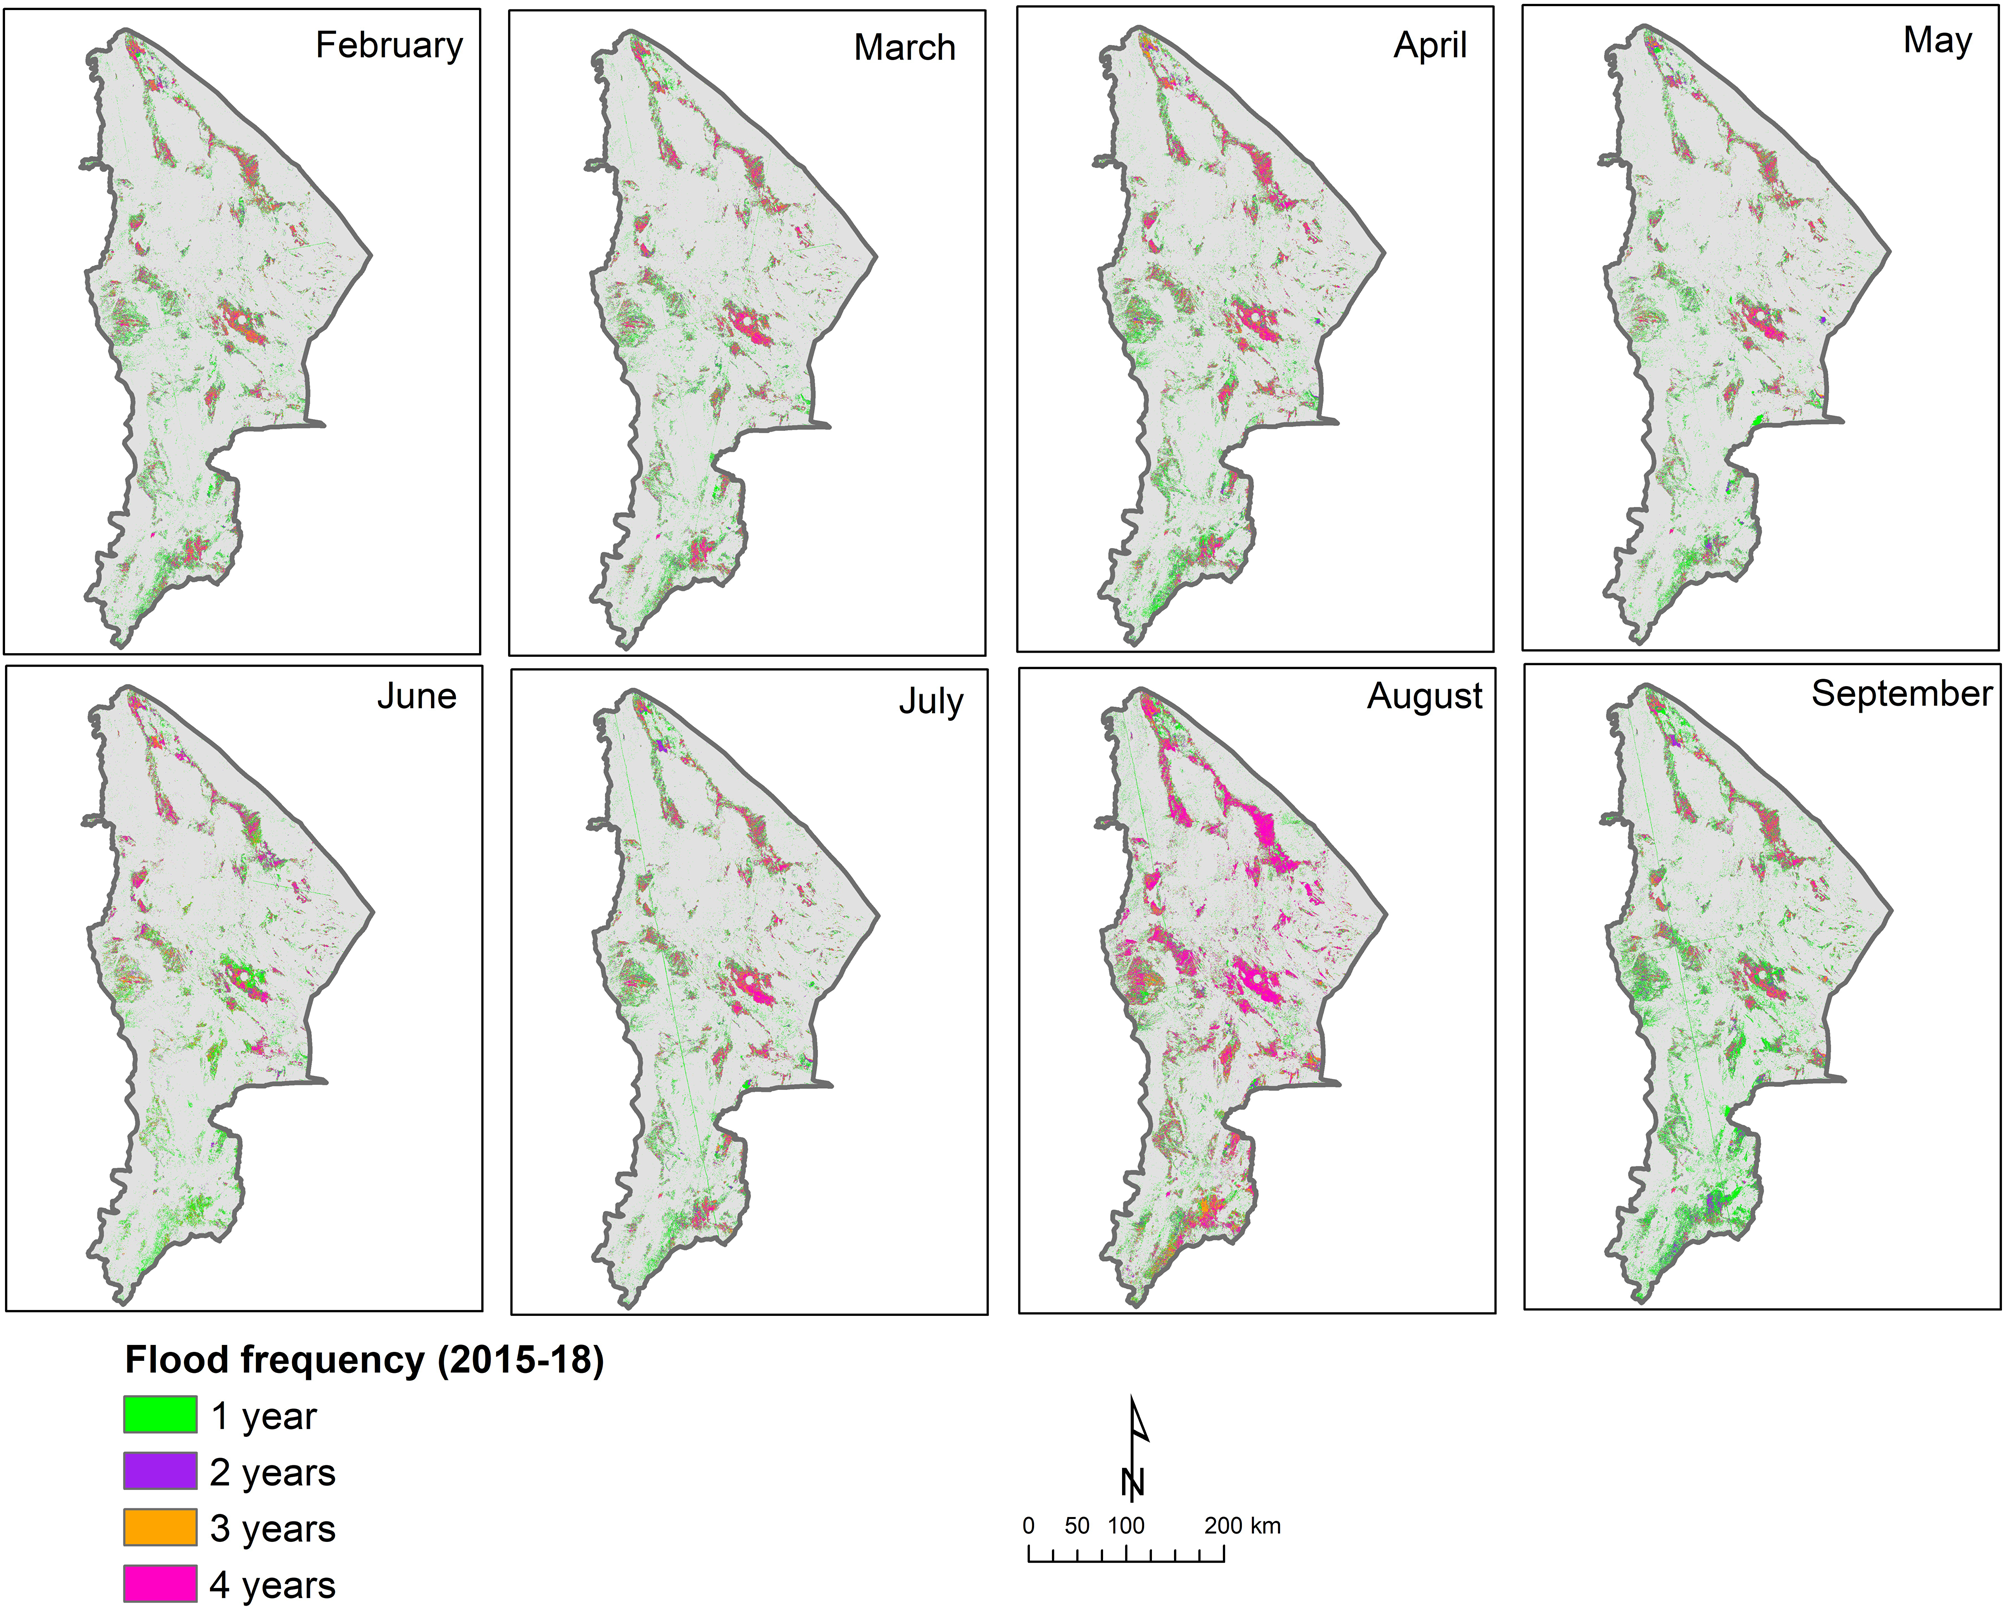
Fig. 6. Temporal changes in flooded area in the Afar region.
Table 5. Temporal flooded areas across the Afar region
Flood frequency and distribution during the belg and meher seasons
Flood frequency was determined as the number of months and years a certain grid receives out of the 4 years of the study period (Fig. 7). Consequently, March and April covered a larger area with the highest frequency of flood during the belg season whereas July and August covered a larger area with the highest frequency of flood events for the meher seasons. Areas with the highest flood frequency have the lowest risk of water scarcity for productive use across years.
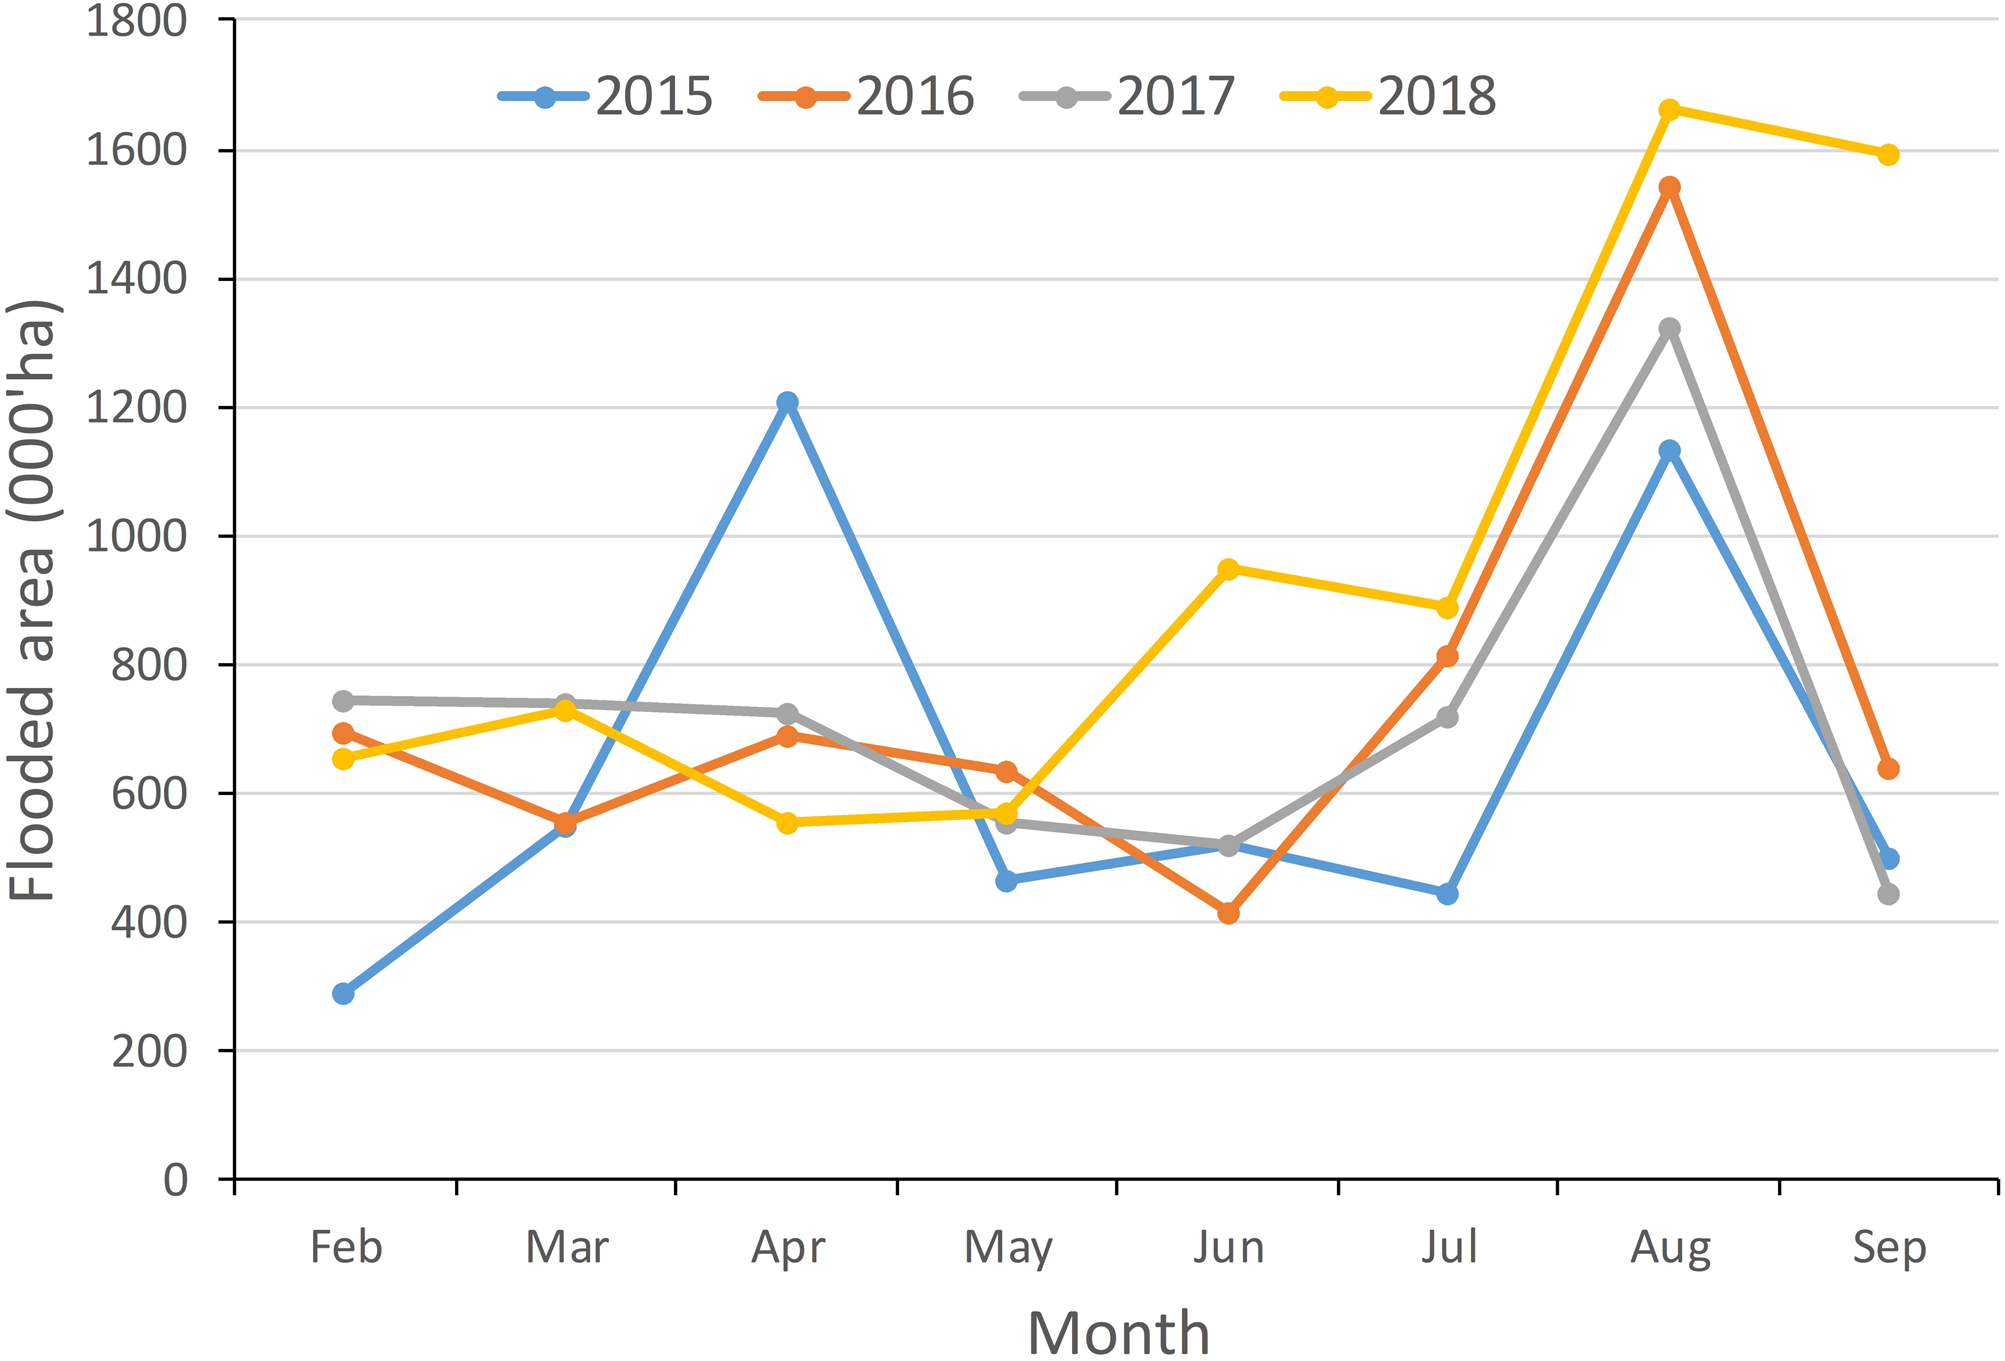
Fig. 7. Identification of flood prone areas and number of years in which flood occurred between 2015 to 2018.
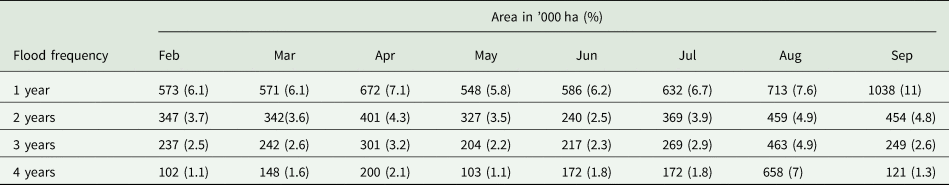
A minimum of 148,000 and 172,000 ha of land received flood in four out of the 4 years, between 2015 and 2018 for belg and meher seasons, respectively (Table 6). With a 75% chance of occurrence (three out of 4 years), the flooded area for belg and meher seasons could increase up to 242,000 and 463,000 ha, respectively. The highest the chance of getting flood every year, the lowest the area that can be flooded and vice versa. Therefore, the selection of areas for flood-based farming could be prioritized using the flood frequency across years with the premises that ‘the highest the frequency, the higher the priority’.
Table 6. Area of land in ha and percentage of the total area in Afar that received flood corresponding to various frequencies (the number of years of occurrence within 4 years) between 2015 and 2018
Flood maps
In order to ensure sustainable production, the reduce effect of floods and minimize drought risks in these drought-prone systems, the most prospective strategy appears to partially harvest the available runoff for irrigating crops and rangelands (Sharma et al., Reference Sharma, Agrawal and Marshall2006). The horrendous flood emerging from the highlands could be partly converted to productive use (Amede et al., Reference Amede, Descheemaeker, Peden and van Rooyen2009). Our research showed that these dry lowlands, which are commonly neighboring with upstream highlands receiving high rainfall amounts (>1000 mm per year) could be reliable sources of floodwaters. Furthermore, the adjacent highlands are characterized by the high frequency of intense rainfall with good flood potential compared with the lowland that receives only a few events with high intensity rainfall. Our analysis on rainfall data (1980–2010) for Chifra area and adjacent highlands depict that the lowland experienced on average 11 days of rainfall events with greater than 10 mm per day whereas the adjacent highland crossed this threshold in 32 days per year (https://public.wmo.int/en/members/ethiopia). For the higher intensity of at least 20 mm per day, the lowland receives only 2 days per year on average whereas the highland receives in 12 days per year. These demonstrate that the flood that could be available in the lowlands is a function of climate characteristics in the adjacent highlands. Therefore, the minimum area that is determined to be available for flood-based development could be affected by climate variability upstream.
Given the fact that the region is commonly inhabited by pastoral communities, the identification of potential areas should be developed in consultation with the local residents, who are commonly implementing pastoral based and mobile livelihood strategies and considering socio-economic, agro-ecological and technical aspects (Seid et al., Reference Seid, Reda, Mohammed, Bedru, Ebrahim, Teshale and Demelash2016). Therefore, once flood is received downstream, there is a huge opportunity to use it for food and feed production while at the same time rehabilitating degraded range lands (ICRISAT, 2017). Similar works have also demonstrated the use of flood for crop production (Tesfai and Stroosnijder, Reference Tesfai and Stroosnijder2001; Tesfai and Sterk, Reference Tesfai and Sterk2002; Ham, Reference Ham2008; Steenbergen et al., Reference Steenbergen, Haile, Alemehayu, Alamirew and Geleta2011). However, the utilization should not be limited to forage and crop production. Construction of reservoirs or alternative water storage tanks may allow (agro)pastoralists have access to livestock drinking water during extended dry periods. However, the feasibility of such alternatives needs to be understood in advance.
The month of April in the belg season and the month of August in the meher season are the periods that have larger area coverage of higher frequency flood (Fig. 8). In the Afar region, both seasons show an increase of intensity of flood from belg season to meher season. The majority of flood is under the slope of less than 2%. However, monthly flood distribution may not be the same from year to year following the climate variability in upstream highlands that are the major source of flood. The use of water storage facilities could buffer the impact of climate variability on downstream flood availability. It could help to utilize the excess flood that may come from highlands during wet years for use in succeeding dry periods, which on the other hand may reduce the negative impacts of floods downstream.
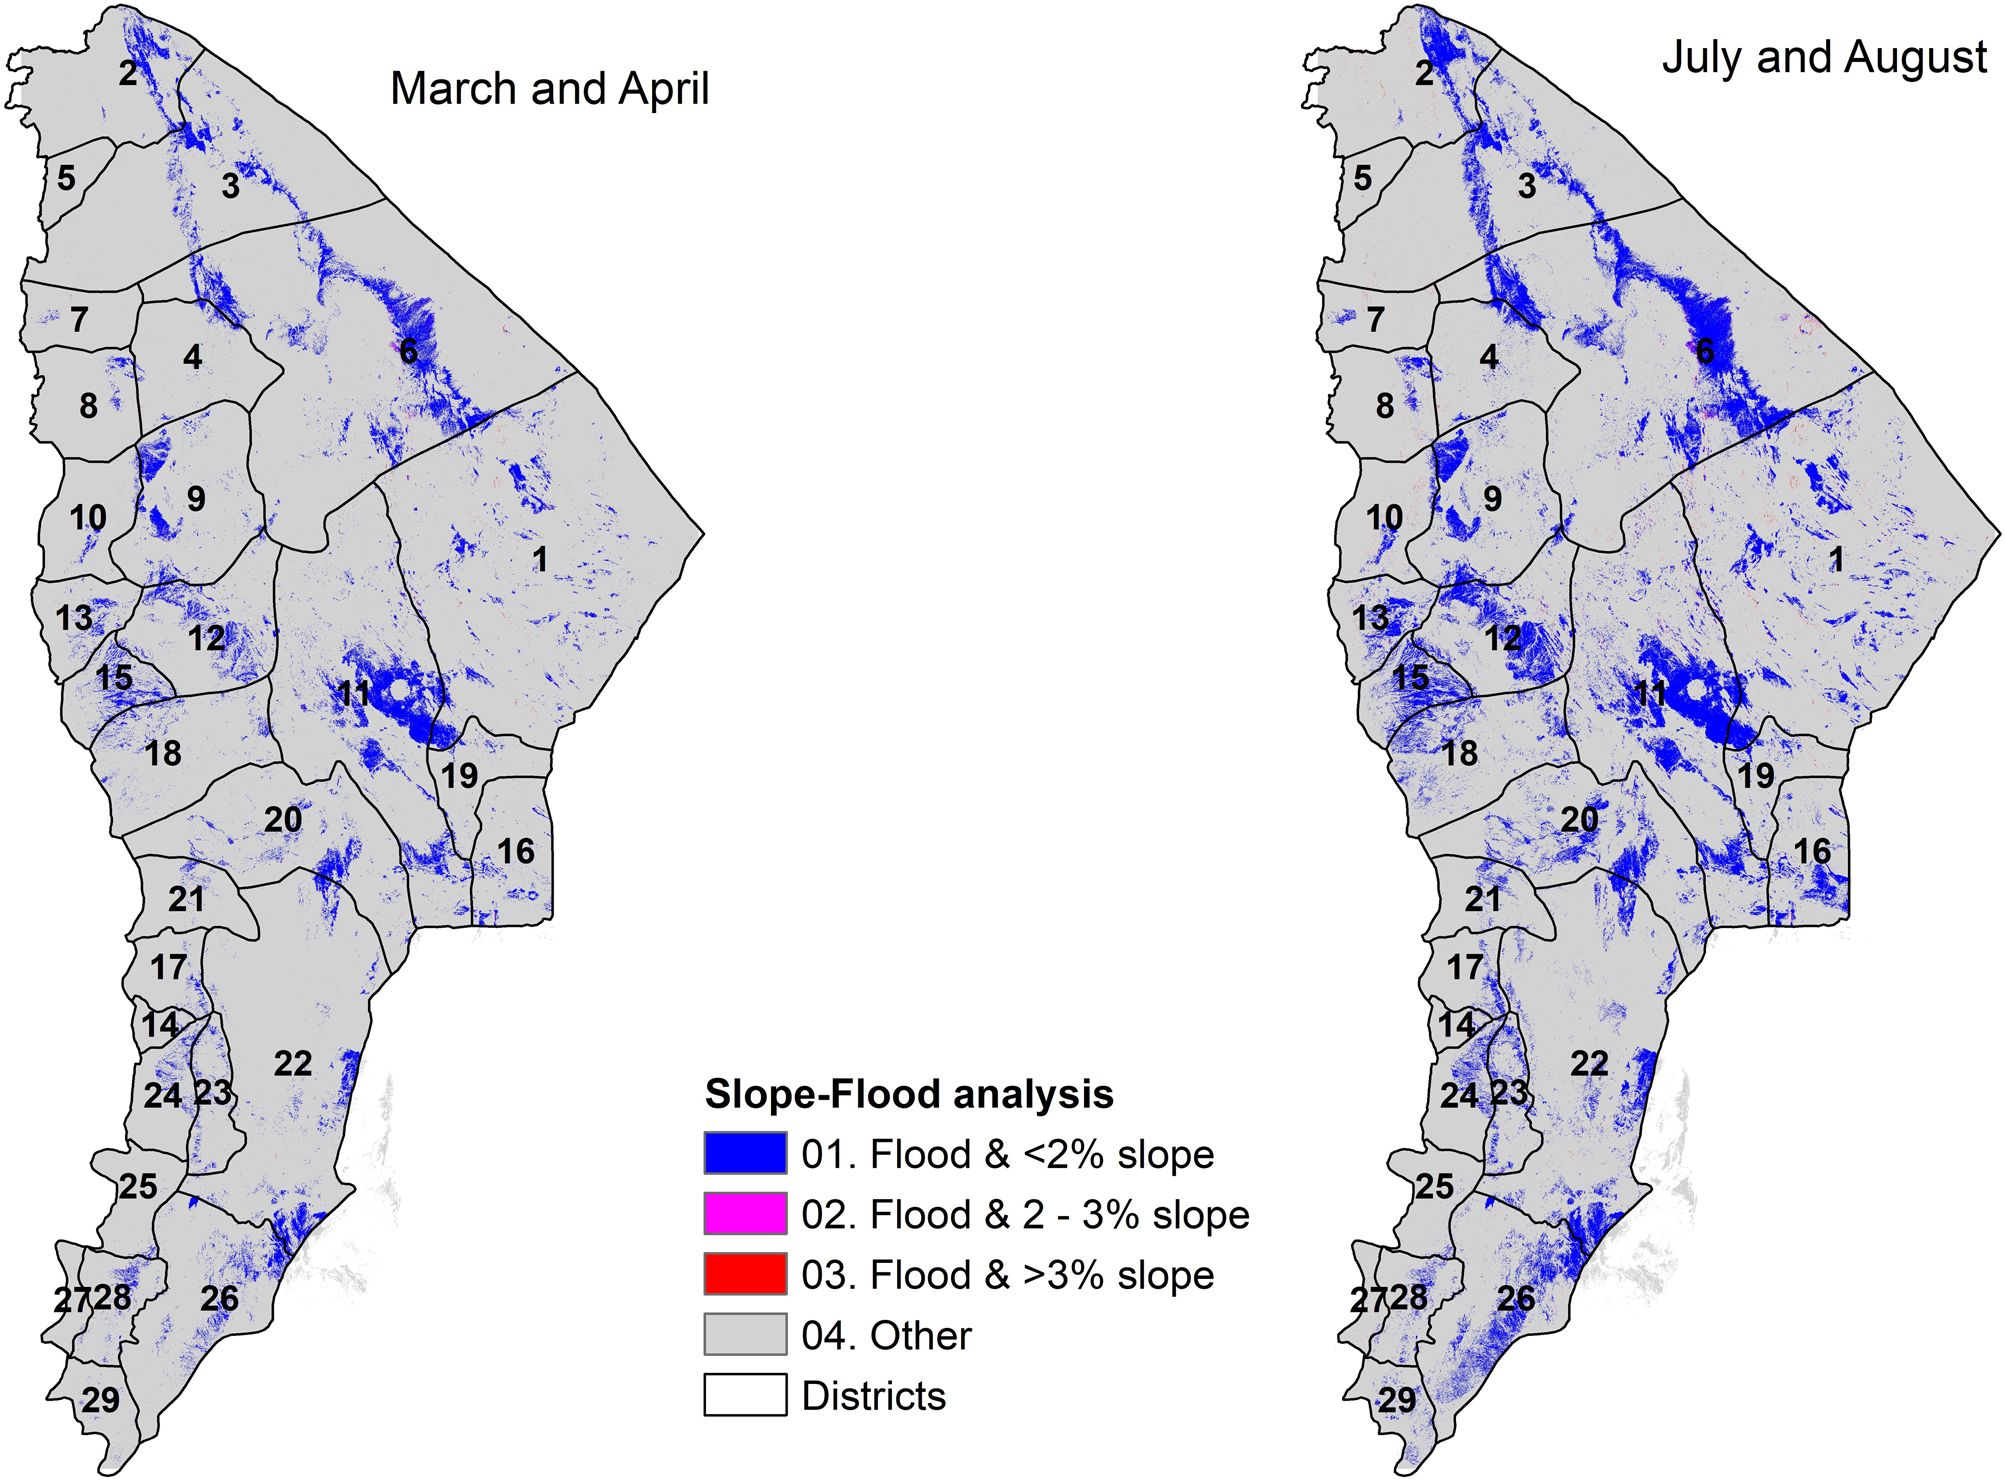
Fig. 8. Spatial distribution of flooded area in slope categories.
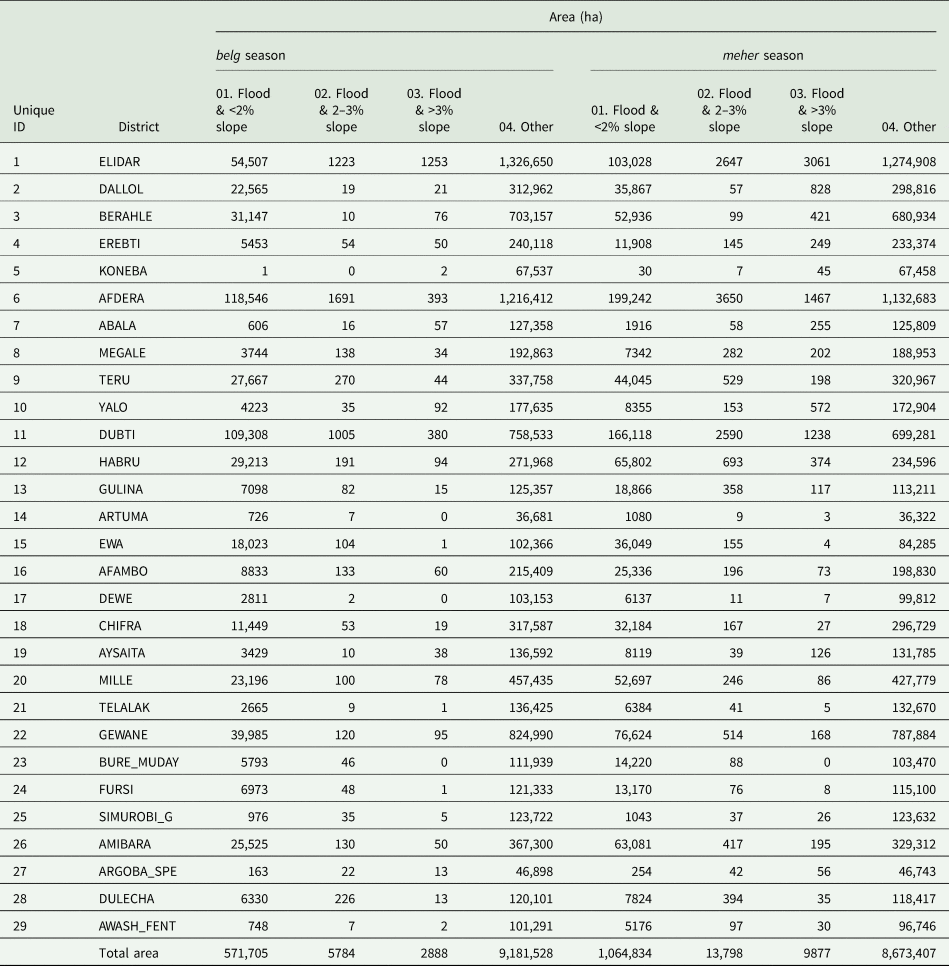
The total areas of flood under three slope categories, which are <2, 2–3 and >3%, these areas increase from 571,705, 5, 784 and 2, 888 ha to 1,064,834, 13,798 and 9877 ha respectively from belg season to meher season. Almost all the districts in the Afar region are affected by floods. Afdera and Dupti districts have the largest coverage of flooded area in both seasons compared with other districts in Afar (Table 7), whereas Koneba district has less flooded area. The flooded area in Afdera increased from 118,546 to 199,242 ha from belg to meher season respectively whereas in Dubti it increased from 109,308 to 166,118 ha.
Table 7. Areas prone to flooded, per district, for three categories of drought frequency belg and meher season (during 2015–2018)
Practical implementation development programs using flood made available downstream in Afar requires consideration of additional factors. Some of the locations where flood is available may not be suitable for farming due to some limiting factors such as extreme salinity, very shallow rooting depth and scattered patches of flood areas that are too small to put long term investment. Moreover, feed and crop production should consider access to main roads and market hubs, willingness of the local government to invest on flood-based technology transfer and strong commitment of the local community. We further focus on how remote sensing technology will help in renewable food systems and also focus on climate change analysis for the future sustainable food security.
Conclusions
In this study, we categorized flood prone areas in the Afar region to target the dissemination of innovation technology for improving livelihoods, livestock and food production. First, we mapped land use land cover maps for study area into eight classes using Landsat-8 and MODIS temporal data for the year 2017. Accuracy assessment was performed based on ground survey data gave 86% of overall accuracy. Secondly, we extracted the slope map from SRTM DEM. Then, the slope maps were integrated with LULC and categorized slope wise LULC areas for the study region. Third, we mapped monthly flooded areas for belg and meher seasons. Further flood maps were integrated with temporal maps for each month and classified it into four classes. The maximum possible flooded areas were integrated with slope classes and generated maps along with statistics for the districts in the Afar region.
We have mapped the flood extent and database for 4 years (starting from 2015 to 2018) in the Afar region. The methodology was used to determine intensity of flood. Mapping flood prone areas are very important to understand Afar region and identifying locations for effective utilization. Up-to-date flood maps are an important input for decision making to improve natural resource management technologies. Therefore, we conclude that the method is suitable for identifying flood potential of regions or basins to guide strategic planning of flood-based development in Afar and similar areas.
Future research can be focused on identify suitable techniques to construct water harvesting structures by using hydrological models and topographical analysis through the construction of water harvesting structures appropriate river channels. Results conclude that the methods are recommended for the identification of large scale flood mapping. Identifying various flood prone areas based on flood frequency could help implement sustainable agriculture and fodder development. The developed database, maps and statistics are very much useful for site specific decision on production and cost analysis.
Acknowledgement
This project is conducted with the financial support and facilitation of GIZ-SDR Ethiopia. The authors are thankful to all the GIZ-SDR staff in Addis Ababa, Semera and Chifra and the Pastoral Agropastoral Development office (PADO) at Chifra and the local community at the project site for all support during the field work. This research was supported by the CGIAR Research Program Water, Land and Ecosystems (WLE) which is carried out with support from the CGIAR Trust Fund and through bilateral funding agreements. For details visit https://wle.cgiar.org/donors.


 Open access