


INTRODUCTION
Radiocarbon (14C) is widely used by paleoceanographers to derive age-depth relationships for marine sediments over the last 50 ka. Usually, a sample of ~1–3 mg of monospecific planktonic foraminifers is 14C dated by accelerator mass spectrometry (AMS). The raw 14C age is then converted into a calendar age, accounting for disequilibrium with respect to the atmosphere (“reservoir age offsets”), and atmospheric 14C content variations (e.g., Marine and IntCal13, Reimer et al. Reference Reimer, Bard, Bayliss, Beck, Blackwell, Ramsey, Buck, Cheng, Edwards and Friedrich2013).
Furthermore, 14C is only produced in the upper atmosphere and introduced into the ocean via air-sea gas exchange, after which it gradually decays in the ocean interior, allowing 14C to be used to trace past carbon cycle evolution and to reconstruct past water mass circulation history. Indeed, by determining the 14C activity of benthic foraminifer samples of independently known calendar age (and assuming knowledge of the deep-water’s initial ocean-atmosphere disequilibrium), one can reconstruct past ocean “ventilation ages,” in other words, assess the time elapsed since the deep-water in question was last isolated from the surface (e.g. Broecker et al. Reference Broecker, Mix, Andree and Oeschger1984; Broecker et al. Reference Broecker, Bond, Klas, Bonani and Wolfli1990; Skinner and Shackleton Reference Skinner and Shackleton2004; Thornalley et al. Reference Thornalley, Bauch, Gebbie, Guo, Ziegler, Bernasconi, Barker, Skinner and Yu2015). However, strictly speaking, 14C ventilation metrics do not provide an unambiguous measure of transport timescales, but rather reflect the extent of disequilibrium between deep-water at a location in the ocean versus a chosen reference point, which will typically incorporate the effects of air-sea gas exchange efficiency, water sourcing and mixing as well as transport. Perhaps the most useful reference for marine 14C is the contemporary atmosphere, whose 14C activity varies over time (e.g. Reimer et al. Reference Reimer, Bard, Bayliss, Beck, Blackwell, Ramsey, Buck, Cheng, Edwards and Friedrich2013), due to a combination of variable 14C production rates (e.g. Muscheler et al. Reference Muscheler, Beer, Wagner, Laj, Kissel, Raisbeck, Yiou and Kubik2004, Reference Muscheler, Beer, Kubik and Synal2005), and a changing carbon cycle. Benthic-atmosphere (B-atm) 14C age differences represent one such atmosphere-referenced marine 14C ventilation metric, all of which are equivalent in the sense that they reflect isotopic disequilibrium (e.g. Soulet et al. (Reference Soulet, Skinner, Beaupré and Galy2016), and all of which require that the studied samples can be independently attributed calendar ages (e.g. Adkins et al. Reference Adkins, Cheng, Boyle, Druffel and Edwards1998; Skinner et al. Reference Skinner, Waelbroeck, Scrivner and Fallon2014; Chen et al. Reference Chen, Robinson, Burke, Southon, Spooner, Morris and Ng2015). Clearly, a key challenge for the reconstruction of any such 14C ventilation metric is the accuracy and precision of calendar age assignments. For the reconstruction of “projection ages” (Adkins Reference Adkins1997), which aim to represent the (calendar) years elapsed since the deep-water in question was last at the surface, it is also necessary to know a priori the relative contributions of different surface water sources to the deep-water in question, as well as their initial 14C disequilibrium versus the atmosphere. 14C age offsets between contemporary benthic and planktonic foraminifera (Broecker et al. Reference Broecker, Mix, Andree and Oeschger1984) represent a widely used 14C ventilation metric that does not rely on independent calendar age determination, or any other measurements. However, B-P ages represent the 14C age difference between deep and surface water at the same location, and therefore ignore the potential variations in source-water 14C signature related to either a shift of deep-water formation areas or a change in surface reservoir ages at the source region.
Despite the challenges related to each method highlighted above, the B-atm, B-P and projection ages have brought some constraints on past circulation changes across the millennial scale climate events of the last deglaciation (Robinson et al. Reference Robinson, Adkins, Keigwin, Southon, Fernandez, Wang and Scheirer2005; Skinner et al. Reference Skinner, Waelbroeck, Scrivner and Fallon2014; Chen et al. Reference Chen, Robinson, Burke, Southon, Spooner, Morris and Ng2015). A current limitation in the use of 14C in palaeoceanography is that a relatively large amount of carbonate material (typically 1–3 mg) is required to generate a graphite target and ultimately a 14C date. For marine samples, it generally involves picking hundreds of foraminifer specimens for a single 14C date. Overcoming this sample size limitation would permit the generation of higher resolution 14C records in regions characterized by a low foraminifer abundance (e.g. at high latitudes) and thus, 14C data within Heinrich layers where the amount of foraminifer specimens is often extremely limited (in particular for benthic species). At the same time smaller sample size might also introduce a bias by sampling smaller portion of the foraminifer population.
In the past decade, efforts have been made to lower the sample size for conventional graphite targets, for example by adjusting the graphitization reaction parameters, e.g. improving the pre-treatment and performance of the catalyst powder (Freeman et al. Reference Freeman, Skinner, Reimer, Scrivner and Fallon2016) or changing the reaction volume (Shah Walter et al. Reference Shah Walter, Gagnon, Roberts, McNichol, Gaylord and Klein2016) or temperature (Santos et al. Reference Santos, Southon, Griffin, Beaupre and Druffel2007). As a result, the typical sample size for conventional graphite target analysis has dropped from above 10 mg to 3 mg of CaCO3 for routine analysis in most AMS facilities, though samples as small as 1 mg CaCO3 can be run (Freeman et al. Reference Freeman, Skinner, Reimer, Scrivner and Fallon2016). New designs such as the Mini Carbon Dating System (MICADAS) allow the analysis of graphite targets of less than 1 mg CaCO3 (e.g. Gottschalk et al. Reference Gottschalk, Szidat, Michel, Mazaud, Salazar, Battaglia, Lippold and Jaccard2018). Besides, the MICADAS device enables the analysis of CO2 targets instead of graphite targets. This gas-inlet technology has two major benefits: (i) the sample size can be further reduced (the system cannot proceed with sample larger than 1 mg CaCO3); (ii) the measurement is performed online, without the graphitization step resulting in a substantial reduction of sample preparation cost and time.
The possibility of analyzing ultra-small foraminiferal samples (<0.5 mg CaCO3) (Lougheed et al. Reference Lougheed, Snowball, Moros, Kabel, Muscheler, Virtasalo and Wacker2012; Wacker et al. Reference Wacker, Fahrni, Hajdas, Molnar, Synal, Szidat and Zhang2013a) and even single foraminifer (<0.1 mg CaCO3) (Wacker et al. Reference Wacker, Lippold, Molnár and Schulz2013b; Lougheed et al. Reference Lougheed, Metcalfe, Ninnemann and Wacker2018) has been demonstrated but for age determination sample mass should ideally be larger than 40 μg C (~0.3 mg CaCO3) and should contain a sufficient number of individuals to reliably represent the sediment level analyzed. Gottschalk et al. (Reference Gottschalk, Szidat, Michel, Mazaud, Salazar, Battaglia, Lippold and Jaccard2018) showed that gas 14C analysis of small-sized (~0.3-0.6 mg CaCO3) foraminifera samples give accurate results with only a slight precision decrease (a few tens of years on 14C scale) compared to graphite target AMS measurements. Better precision can be achieved by replicating the measurements in order to extract a mean age and the corresponding uncertainty. Despite the apparent advantages, 14C gas measurements have yet to be widely used for paleoceanographic studies, and measurements are still needed to further test the accuracy and reproducibility of small-sized foraminifer sample 14C gas measurements in the marine sedimentary context.
Here we report new benthic and planktonic gas 14C measurements from North-Atlantic core SU90-08 (43°03′1″N, 30°02′5″W, 3080 m). We systematically measured two aliquots of gas samples and compared those results with conventional graphite measurements (n = 10). The goal of this study is to (i) further test the reproducibility and accuracy of small-sized gas introduction 14C measurements on deep-sea foraminifer samples using the MICADAS setup and (ii) assess the benefits of these measurements for the study of past ocean ventilation, as compared to graphite-based AMS measurements.
STUDY SITE AND METHODOLOGY
Sample Material
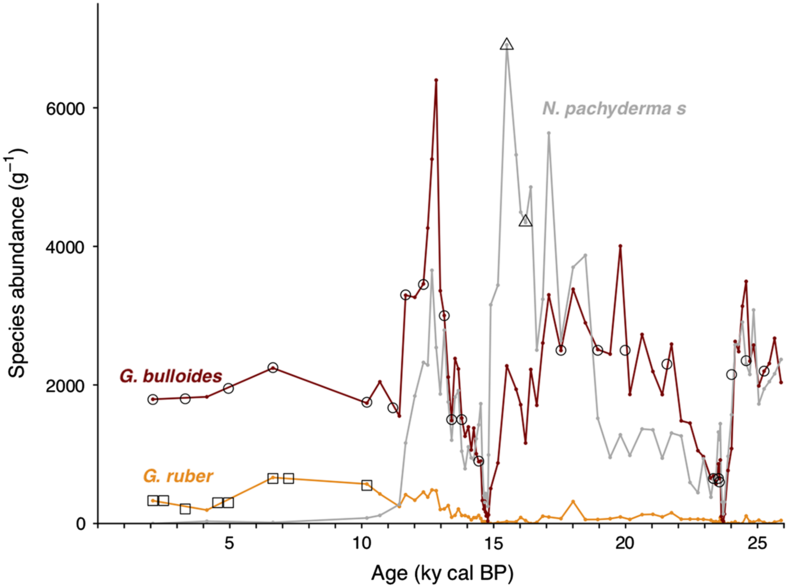
Sediment core SU90-08 was retrieved in 1990 by the French R/V Suroît during the Paleocinat cruise on the mid-Atlantic ridge flank, in the western Atlantic basin (43°03′1″N, 30°02′5″W, 3080 m). Based on the planktonic δ18O record, the sediment available have been shown to cover about 260 kyr of climate history and the average sedimentation rate is 4.6 cm/kyr (Grousset et al. Reference Grousset, Labeyrie, Sinko, Cremer, Bond, Duprat, Cortijo and Huon1993; Bout-Roumazeilles et al. Reference Bout-Roumazeilles, Cortijo, Labeyrie and Debrabant1999). The sediment is mainly composed of carbonates (foraminifera ooze and nanofossils) interbedded with clay layers (Bout-Roumazeilles et al. Reference Bout-Roumazeilles, Cortijo, Labeyrie and Debrabant1999). Levels showing accumulation of coarse detrital material from iceberg discharges, Ice Rafted Debris (IRDs), attributed to Heinrich events 1, 2 and 4 have been identified in the first 250 cm of the core corresponding to the last 40 ka (Vidal et al. Reference Vidal, Labeyrie, Cortijo, Arnold, Duplessy, Michel, Becque and Van Weering1997; Bout-Roumazeilles et al. Reference Bout-Roumazeilles, Cortijo, Labeyrie and Debrabant1999; Kissel Reference Kissel2005; Missiaen et al. Reference Missiaen, Waelbroeck, Pichat, Jaccard, Eynaud, Greenop and Burke2019). Bulk wet sediments were oven-dried (50°C) for about 48 hr and then water-sieved at 150 μm mesh to remove fine particles. The >150 μm fraction was rinsed with de-ionized water and oven-dried (50°C) for about 24 hr. Planktonic foraminiferal assemblages were determined downcore by counting on average 423 specimens on unbiased splits of the fraction >150 μm. The most abundant species are G. bulloides (26% on average over the record) and N. pachyderma (sinistral, 29% on average over the record) (Figure 1). Benthic and planktonic foraminifers were handpicked from respectively 28 and 29 sediment slices covering the last 25 kyr. The low availability of benthic foraminifers, especially within the Heinrich layers, motivated the gas introduction system analyses. Because of the small amount of benthic foraminifer available in the samples and because the represented genus of benthic foraminifer changes downcore, mixed benthic species were picked (excluding porcelaneous species (see Magana et al. Reference Magana, Southon, Kennett, Roark, Sarnthein and Stott2010), and agglutinate specimens that include sedimentary material). To minimize the bioturbation effect on planktonic 14C dates, we only selected specimens amongst the most abundant species: G. bulloides and N. pachyderma sinistral for 27 and 2 sediment slices, respectively (see Figure 1). Single species samples of G. ruber (n = 8) were also prepared to examine 14C age difference between coexisting species (e.g. Broecker et al. Reference Broecker, Andree, Bonani, Wolfli, Klas, Mix and Oeschger1988; Mekik Reference Mekik2014). To assess the value of the 14C background on the foraminifer material so-called the foraminifer blank, we also picked samples of 14C-dead foraminifers from the core bottom (>260 kyr cal BP). The age obtained on this 14C-dead foraminifer samples was then used to perform the blank correction.

Figure 1 Downcore evolution of planktonic foraminifer abundances: The red line represents the evolution of G. bulloides absolute abundance, the gray line, the evolution of N. pachyderma (sinistral) abundance, the orange line, the evolution of G. ruber abundance. The black empty symbols represent the sampled levels for gas 14C analysis, the black squares represent the levels sampled for graphite analysis. Age model from Missiaen et al. (Reference Missiaen, Waelbroeck, Pichat, Jaccard, Eynaud, Greenop and Burke2019). (Please see electronic version for color figures.)
The foraminifers selected for gas measurements were cleaned with de-ionized water. No oxidative treatment (e.g. H2O2) was applied to preserve the shell integrity and avoid potential contamination with modern atmospheric CO2. Under the binocular microscope, the selected foraminifers appeared intact and did not display dissolution features or extraneous sediment/residue attached to the outer shell. Because the effect of contamination (either by modern/radiocarbon rich or old/radiocarbon poor content) increases as the sample size is reduced (Gottschalk et al. Reference Gottschalk, Szidat, Michel, Mazaud, Salazar, Battaglia, Lippold and Jaccard2018), we maintained a constant sample size for each method (0.97 ± 0.29 [1 σ] mg CaCO3 on average). After picking and weighing, each sample was put in septum sealed glass vials and flushed with helium at 50 mL/min for 5 min in order to remove the modern CO2 from the vials.
The 14C analysis was carried out at the Laboratory of Ion Beam Physics at ETH Zürich using an Ionplus carbonate handling system (Wacker et al. Reference Wacker, Fahrni, Hajdas, Molnar, Synal, Szidat and Zhang2013a) coupled to MICADAS AMS (Synal et al. Reference Synal, Stocker and Suter2007) with a helium stripping system, which leads to better signal on small samples.
Twelve 14C gas measurements were compared with standard graphite analysis for the same depths. Graphite measurements were performed either at ETH Zürich (n = 7) or Chrono Center, Queens University Belfast (n = 4), following a standard method of CO2 reduction in the presence of hydrogen over iron catalyst (Vogel et al. Reference Vogel, Southon, Nelson and Brown1984). The graphite sample size was 0.28 ± 0.05 (1 σ) mg C for ETH Zürich and 0.41 ± 0.15 (1 σ) mg C for Chrono Centre Belfast.
Gas Measurements Reproducibility and Accuracy
In order to assess the reproducibility of our gas measurements, we systematically replicated our planktonic and benthic 14C measurements when enough material was available for the deglacial section of SU90-08. Along with the samples, standard material was also measured to assess the accuracy of the measurements and process the 14C data following the normalization to standard method. Multiple measurements of the IAEA standards C2 (travertine, consensus F 14C value = 0.4114 ± 0.0003, δ13C = −8.25 ± 0.31‰ VPDB; Rozanski et al. Reference Rozanski, Stichler, Gonfiantini, Scott, Beukens, Kromer and van der Plicht1992) and C1 (marble, consensus F 14C = 0.0000 ± 0.0002, δ13C = –2.42 ±0.33‰ VPDB; Rozanski et al. Reference Rozanski, Stichler, Gonfiantini, Scott, Beukens, Kromer and van der Plicht1992) and CSTD standard (coral, F 14C = 0.9445 ± 0.0018; Gao et al. Reference Gao, Xu, Zhou, Pack, Griffin, Santos, Southon and Liu2014) were performed. For the sake of consistent sample-standard comparison, the standard and sample sizes were equivalent (~1 mg). Additionally, the National Institute of Standards and Technology (NIST) standard oxalic acid II (OxII) was also analyzed directly as CO2 from a purchased gas bottle (Ionplus, Switzerland). The data processing was performed with the software BATS (version 4.20, Wacker et al. Reference Wacker, Christl and Synal2010) and includes the selection of the current plateau, correction for isotopic fractionation from the AMS using δ13C, and the blank contribution using the foraminifer blanks. Uncertainties are fully propagated for each correction.
Leaching Analysis
The online gas measurement and carbonate handling system setting allows for a weak leaching prior to the total sample dissolution (Bard et al. Reference Bard, Tuna, Fagault, Bonvalot, Wacker, Fahrni and Synal2015). The samples are first acidified with 100 μL of 0.02 N HCl for at least 30 min at 50°C temperature, which dissolves ~120 µg of CaCO3 in each sample. The CO2 produced by the reaction is flushed into the MICADAS and analyzed as the leach fraction. Once the leaching analysis is complete, the samples are acidified with 0.1 mL 85% orthophosphoric acid (H3PO4) for at least 30 min at 50°C in order to convert the remaining carbonates into CO2. The sample is then flushed into the MICADAS and analyzed as the main fraction. It is worth noting that the gas introduction system used can only handle samples of equivalent 1 mg CaCO3 or smaller. For the samples exceeding this size limit, an aliquot of gas corresponding to the maximum capacity was measured while the rest of the gas was discarded. On average, about 85 ± 26 (1 σ) μg C were analyzed as the main fraction of gas samples.
This technique gives the opportunity to assess the consistency of the 14C signal of the inner and outer part of the foraminifera and thus to draw inferences regarding possible dissolution/recrystallization of the shells, which would be indicated by large 14C age differences between the main and leach fractions.
RESULTS AND DISCUSSION
Gas Measurements Evaluation
Accuracy of Gas Measurements
Generally, the gas and graphite measurements show a consistent age-depth relationship and our new measurements are consistent with existing 14C data (Vidal et al. Reference Vidal, Labeyrie, Cortijo, Arnold, Duplessy, Michel, Becque and Van Weering1997; see Figure 2). We tested the accuracy of our 14C gas data by measuring standard materials IAEA-C1, IAEA-C2, coral CSTD and foraminifer blank (foraminifers older than 260 kyr) along with the samples. The values obtained: ~458 (coral CSTD) and 7135 (IAEA-C2) year old carbon, agree with the consensus values within the 2σ uncertainty (Table S1) the age offsets having a standard deviation (1σ) of 55 years for CSTD coral and 136 years for IAEA-C2. Typical gas measurement background levels (14C-dead IAEA-C1 and foraminifers) were ~0.5% modern carbon, (%mC) (>42,000 years equivalent). Comparable levels of standard reproducibility were obtained for graphite measurements, with a slight improvement due to the larger sample sizes analyzed (see Table S1). Typical graphite background levels obtained were ~0.23% mC (>48,800 years equivalent) of modern carbon for Belfast measurements and ~0.26% mC for ETH measurements (>47,000 years equivalent).
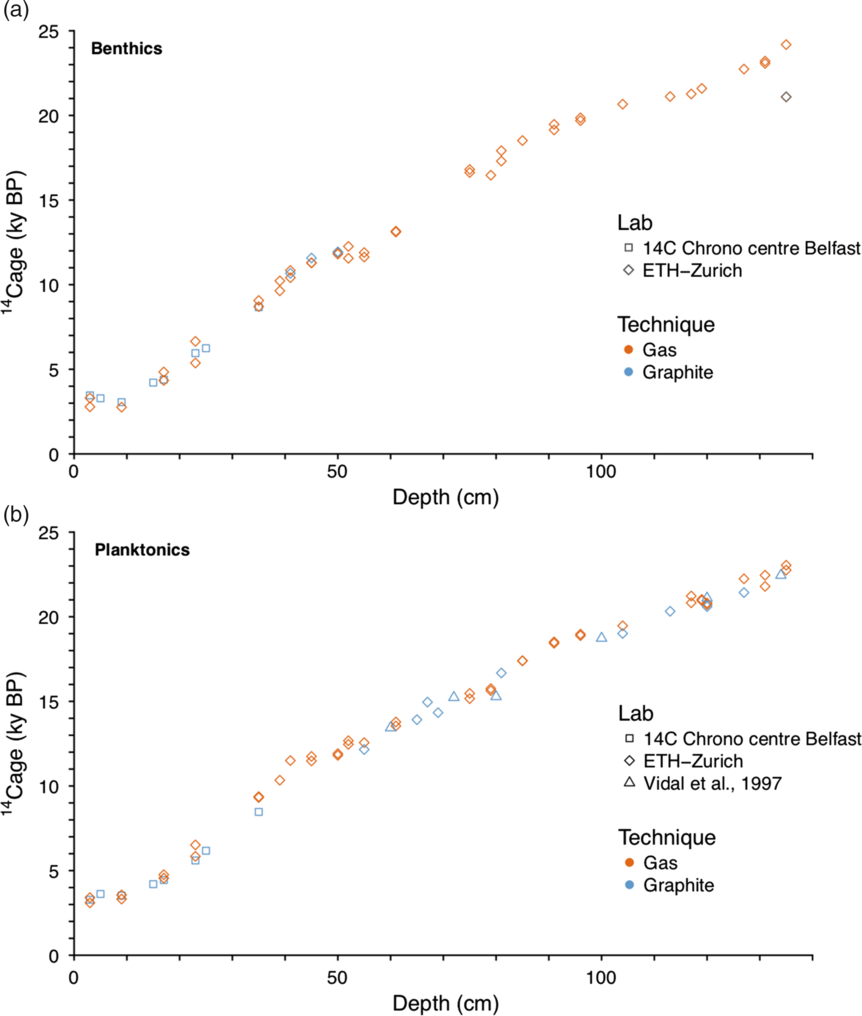
Figure 2 14C age-depth relationship for sediment core SU90-08: (a) benthic and (b) planktonic foraminifers. The orange symbols represent the gas measurements while the blue symbols represent the graphite measurements. The gray point of the top panel corresponds to an off-trend benthic measurement which was excluded from the subsequent interpretations.
Reproducibility of Gas Measurements
The reproducibility of our gas measurements on foraminifera was assessed using 19 duplicated 14C gas analyses for planktonic foraminifers and 17 duplicated 14C gas analyses for benthic foraminifers (Table S2). One benthic replicate at 135 cm was found to completely off the age trend (Figure 2) and is therefore not included in the subsequent analysis. The absolute 14C age offsets between replicates have no remarkable downcore evolution (Table S2) and range between 2 and 1278 years with an average of 227 years for the planktonic foraminifera (1σ = 192, n = 19) and 389 years for the benthic (1σ = 320, n = 16) foraminifera. Evaluating the downcore evolution of the gas measurements reproducibility requires accounting for the evolution of the analytical uncertainties, the latter growing exponentially as the sample 14C content decreases (Figure 3A). Using 10,000 Monte Carlo draws, we estimate the expected downcore reproducibility between 2 replicates (± 2σ), accounting for the downcore evolution of the analytical uncertainties and compare it to our sample reproducibility (Figure 3B). The upper part of the core (0–30 cm or 3–8 kyr i.e. 2–10 ka cal BP, see Missiaen et al. Reference Missiaen, Waelbroeck, Pichat, Jaccard, Eynaud, Greenop and Burke2019) is characterized by larger observed 14C age offsets between the replicates with respect to the expectation i.e. poorer reproducibility than the section below (35–135 cm or 10–25 ka). This sharp change in reproducibility is not synchronous with any of the abrupt climatic events (Younger Dryas [YD], Heinrich Stadial 1 or 2 [HS1-HS2 respectively]).

Figure 3 Reproducibility of the benthic and planktonic 14C gas measurements: (a) Evolution of the analytical uncertainty with measured 14C age (red dots—benthic and planktonic together). The black line represents the exponential function fitting the measured analytical uncertainty. (b) Comparison between the expected age offset between two replicates of the same age when taking into account the analytical uncertainty only (black line and gray error envelopes) and the observed reproducibility for SU90-08 benthic (red dots) and planktonic (blue triangles) gas 14C dataset. The expected reproducibility is obtained from Monte Carlo draws of paired samples of a given 14C age. For each given sample 14C age, we randomly draw 10,000 pairs of samples within a gaussian distribution defined by the considered 14C age and the analytical uncertainty (Figure 1A). We then extract the mean age offset (black line), its variance (2σ—light gray envelope) and its standard deviation (1σ—dark gray envelope). The data is plotted against measured or theoretical 14C age. The red vertical dashed line highlights the very poor reproducibility observed in the upper 30 cm of the core (see text for details). For the samples falling out of the expected reproducibility shade, the poor reproducibility cannot be solely explained by the analytical uncertainty on the measurements. Instead, we argue that these samples have been affected by other processes, such as variations of the benthic species assemblages or bioturbation.
The poor reproducibility of measurements observed in the top 30 cm of SU90-08 core is likely related to greater syn-depositional or post-depositional mixing in the upper ~30 cm of the sediment. According to the current understanding of deep-sea sediment bioturbation processes, the top most layer of the sediment, referred as the mixed layer, is uniformly mixed by benthic life (e.g. burrowing, Berger and Heath Reference Berger and Heath1968; Guinasso and Schink Reference Guinasso and Schink1975; Berger and Johnson Reference Berger and Johnson1978; Berger and Killingley Reference Berger and Killingley1982; Peng et al. Reference Peng, Broecker and Berger1997). Therefore, the average age of the uppermost sediment should be near-identical down to the bottom of the contemporary mixed layer, which is typically between 5 and 10 cm thick (Trauth et al. Reference Trauth, Sarnthein and Arnold1997). Indeed, we see uniform 14C ages to ~10 cm depth (levels 3, 5, and 9 cm—average age 3402 14C yr BP, 3287 cal yr BP) in our sediment core (Figure 2a,b). Below 17 cm, we see that average 14C ages corresponding to the historical layers increase incrementally with core depth. Note that the mixed layer thickness may have changed in the past according to changes in benthic life activity in relation with bottom water oxygenation and nutrient availability.
In the bottom part of the record (i.e. below ~30 cm, or before 10 ka cal BP), the observed reproducibility roughly fits to the expectation. Besides, the planktonic reproducibility appears to be much better than its benthic counterpart (Figure 3B), in contrast to what has been reported in Gottschalk et al. (Reference Gottschalk, Szidat, Michel, Mazaud, Salazar, Battaglia, Lippold and Jaccard2018). It is important to stress that the benthic measurements were conducted on mixed species, which probably contribute to the poorer reproducibility of benthic measurements compared to single species planktonic measurements as infaunal and epifaunal species of a given sample have been suggested to exhibit different 14C signatures (Rafter et al. Reference Rafter, Herguera and Southon2018). Setting aside the top 30 cm of the record, 94% of the planktonic measurements fall in the expected 2σ reproducibility range (roughly 65%, 1σ). On the other hand, below 35 cm, around 62% of the benthic 14C gas measurements fall in the expected 2σ reproducibility range (roughly 46%, 1σ). Namely, early Holocene and HS1 benthic samples are not so well replicated, while glacial benthic 14C replicates compare well.
Comparison of Gas and Graphite Measurements
We compare gas and graphite measurements on both G. bulloides and mixed benthic foraminifers (Figure 4AB), and we compare gas measurements on G. bulloides to graphite measurements on G.ruber (Figure 4C). We observe no discernable difference between the gas and graphite measurements, with a coefficient of determination (R2) for all the gas and graphite measurements above 0.99 (Figure S1). In detail, for each level where duplicated gas measurements and a graphite measurement are available, we assess the reproducibility of the measurements by calculating the standard deviation of the multiple 14C dates (Table S3). On average, this standard deviation is 228 yr ± 199 yr (1σ) for mixed benthic foraminifera, 322 yr ± 194 yr (1σ) for G.bulloides, and 286 yr ± 188 yr (1σ) for G.bulloides and G.ruber.
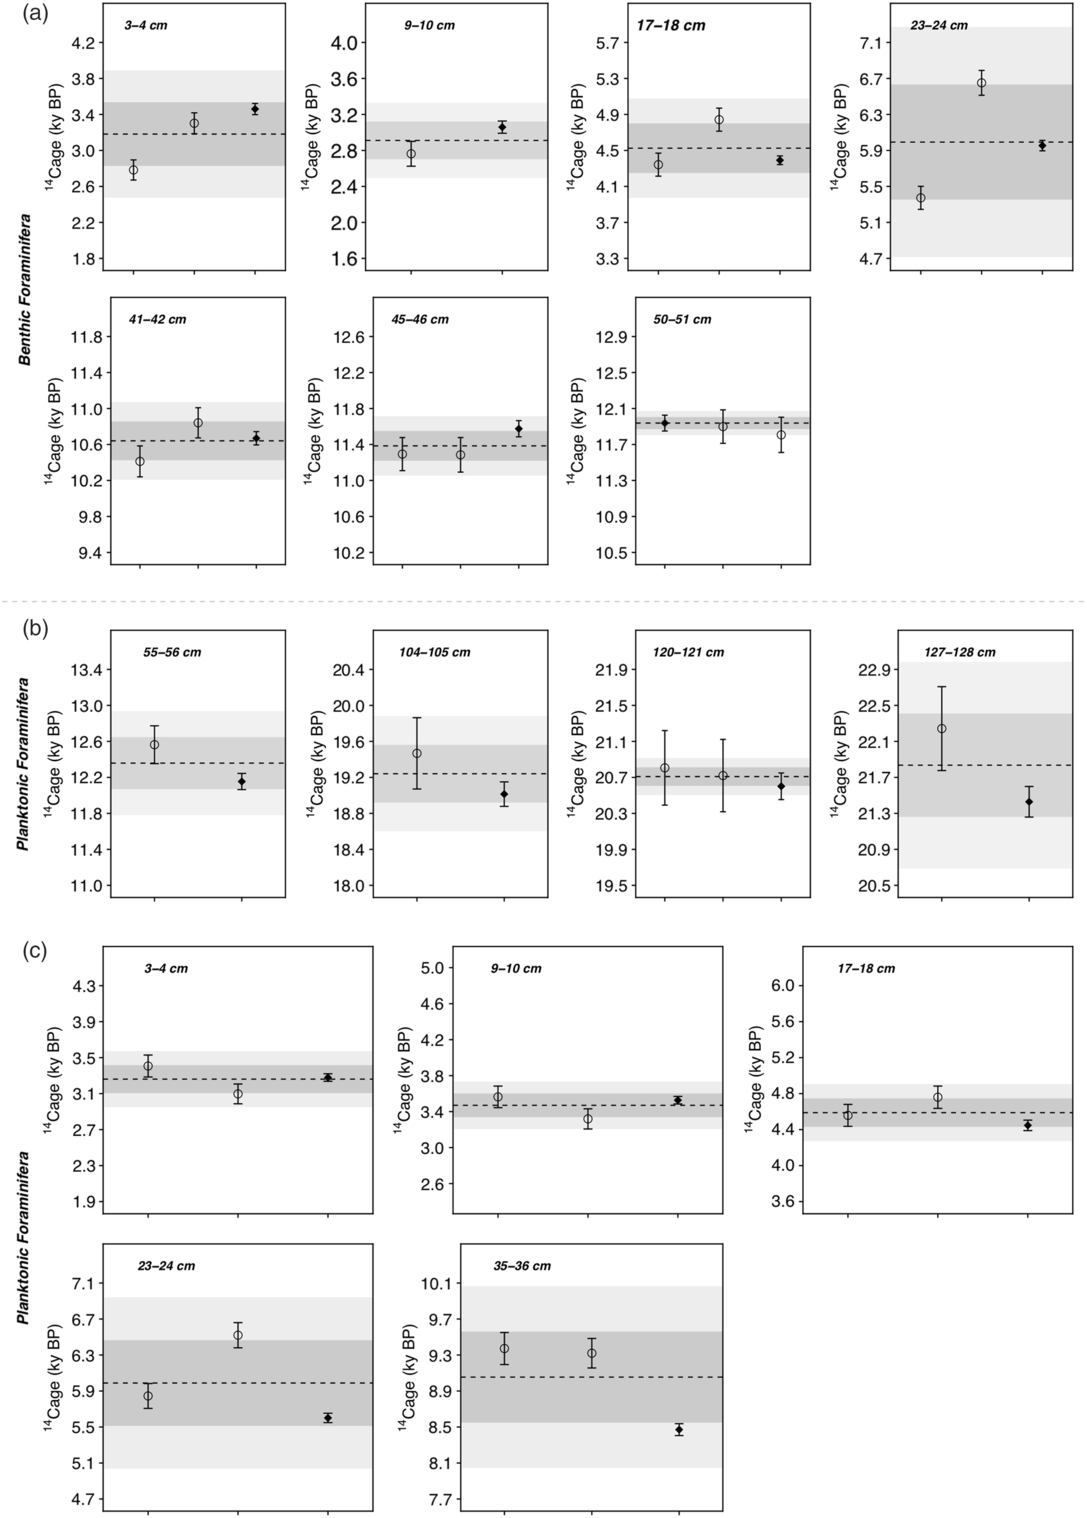
Figure 4 Comparison between gas and graphite for benthic and planktonic foraminifera. Comparison between gas and graphite measurements for (a) mixed benthic species. (b) G.bulloides and (c) different planktonic species (i.e. G.bulloides for gas measurements and G.ruber for graphite measurements). In each subplot, the gas measurements are represented by open circles, the graphite measurements by black diamonds. The 2-σ uncertainty is represented in black. The dashed line represents the mean of all measurements. The horizontal dark gray (light gray) band indicates the 1σ (2σ) uncertainty calculated from all available measurements.
The graphite measurements generally agree with at least one gas replicate within 2σ uncertainty or correspond to the average of the gas replicates (Figure 4), except for 3 analyzed levels: 23 cm (benthic and planktonic), 35 cm (planktonic) and 127 cm (planktonic). We note that some levels display poor reproducibility between the gas samples, especially at 23 cm, perhaps due to the lower sediment accumulation rate in the upper 30 cm of the core. Excluding those levels from the dataset, the standard deviation of gas and graphite measurements for a given depth level is on average 199 yr ± 97 yr for mixed benthic foraminifera, 194 yr ± 118 yr for G.bulloides, and 188 yr ± 15 yr for G.bulloides and G.ruber. These values are of the same order of magnitude as reported in Gottschalk et al. (Reference Gottschalk, Szidat, Michel, Mazaud, Salazar, Battaglia, Lippold and Jaccard2018).
We must stress that the reproducibility of gas and graphite dating methods themselves has already been assessed by comparing gas and graphite measurements carried out on reference material (see Wacker et al. Reference Wacker, Lippold, Molnár and Schulz2013b). Both in the present study and in Gottschalk et al. (Reference Gottschalk, Szidat, Michel, Mazaud, Salazar, Battaglia, Lippold and Jaccard2018), the gas and graphite measurements also capture a different kind of variability related to the natural foraminifer population diversity, the effect of sediment mixing as well as the selection of foraminifer specimens while preparing the samples.
To summarize: (i) the standard materials analyzed along with the samples indicate that the gas measurements were accurate; (ii) the reproducibility of gas measurements younger than 10 ka is poor, very likely because of high heterogeneity of the foraminifer populations related to sediment remobilization by in-situ bioturbation; the gas measurements replicates from 10 to 25 ka generally agree within the 2-σ uncertainty and the overall reproducibility is comparable to what has been reported in (Gottschalk et al. Reference Gottschalk, Szidat, Michel, Mazaud, Salazar, Battaglia, Lippold and Jaccard2018) except for 3 analyzed levels; (iii) the graphite measurements generally agree with at least one gas replicate within 2σ uncertainty or correspond to the average of the gas replicates except for 3 analyzed levels. Overall, this analysis demonstrates that both methods (gas and graphite) produced consistent results on of SU90-08 samples. In what follows, we use those measurements to generate benthic-planktonic (B-P) ventilation ages.
Post HS1 Negative 14C B-P Ages
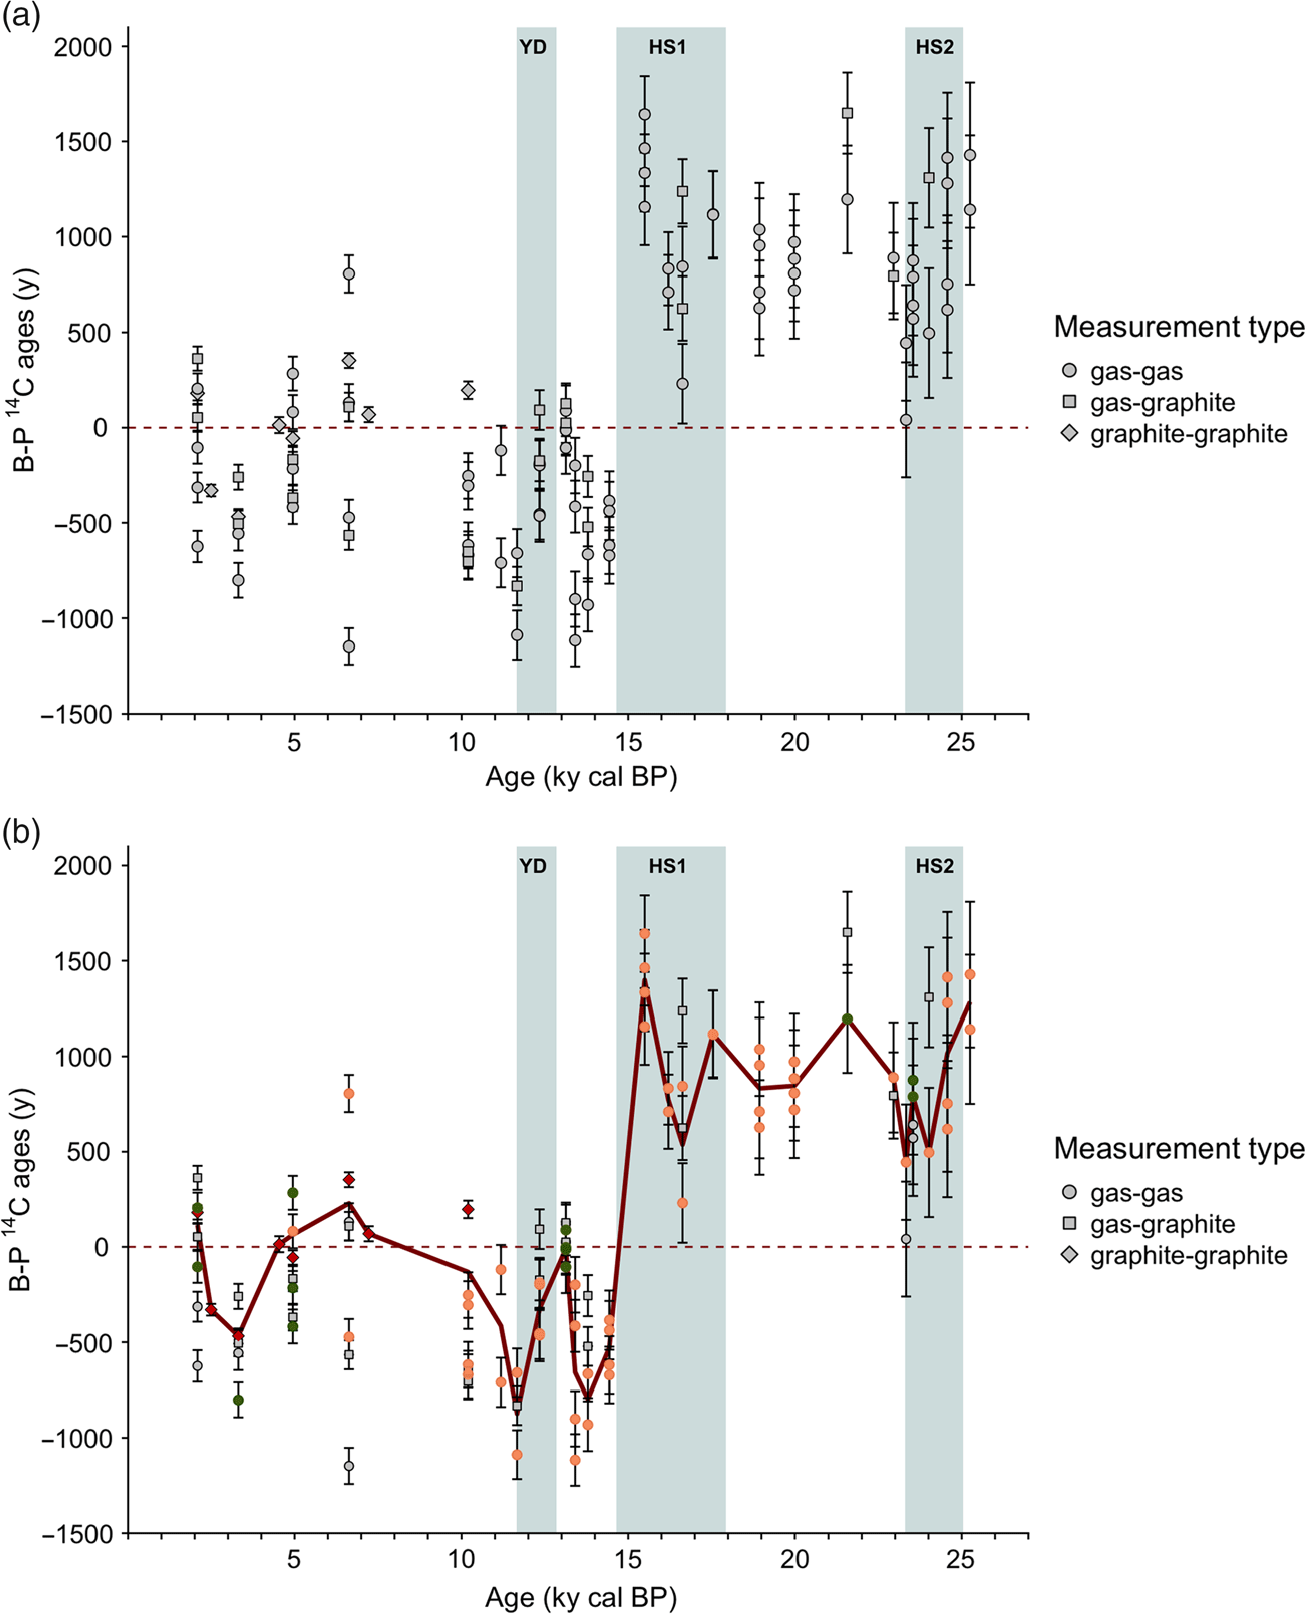
We calculated the 14C B-P ages for each depth level based on the gas and graphite replicated measurements (Figure 5). We observe wide ranges (up to 1000 yr) of 14C B-P ages per level as well as negative values in the top part of the record, i.e. from HS1 to the late Holocene (Figure 5A). The 14C B-P ages are usually expected to be positive because the deep water-masses are expected to have been isolated from the surface for a longer time than the surface waters directly above them. Negative 14C B-P ages, when occurring infrequently, are often discarded in paleoceanographic studies (e.g. Wan and Jian Reference Wan and Jian2014). In our study, however, they represent a systematic signal over the entire upper section of core SU90-08. Therefore, they cannot be considered as outliers and need to be explained.

Figure 5 SU90-08 B-P 14C ages time series: (a) Raw B-P 14C ages obtained from all pairs of measurements with the available dataset. The symbol type indicates the measurement type: gas vs gas measurements are represented by circles, gas vs. graphite by squares and graphite vs graphite by diamonds. (b) Screened B-P 14C ages time series. The red symbols correspond to graphite vs. graphite B-P pairs. The orange symbols correspond to the data that passed the leaching control (see Figure S5). The green symbols represent pairs for which one graphite measurements agrees with one benthic or planktonic gas measurement within 2-σ uncertainty. The bold red line connects the average screened data (i.e. colored symbols).
Negative B-P ages may arise if a process is able to affect the 14C content of foraminifer samples and bias the benthic foraminifers towards younger ages or/and bias the planktonic foraminifers toward older ages, or in a situation where benthic foraminifera are living in less 14C depleted waters than their planktonic counterparts. The latter situation is unlikely because modern B-P 14C age gradient is positive (Key et al. Reference Key, Kozyr, Sabine, Lee, Wanninkhof, Bullister, Feely, Millero, Mordy and Peng2004). Therefore, below we focus on two diagenetic processes that are able to generate negative 14C B-P ages.
A first concern is that core SU90-08 is located in the vicinity of the Mid-Atlantic Ridge and in some cases post-depositional hydrothermal processes have been to affect the foraminifers 14C content by circulating 14C-dead fluids (Marchig et al. Reference Marchig, Möller, Bäcker and Dulski1984; McCarthy et al. Reference McCarthy, Beaupré, Walker, Voparil, Guilderson and Druffel2011). However, we find no evidence of a positive Eu anomaly in the rare earth elements (REE) measured in SU90-08 samples, which would indicate the influence of hydrothermal processes (see Text S1 and Figure S2 for details).
A second concern is the foraminifer shell preservation. Indeed, the lysocline depth is susceptible to change through time, bringing sediments at the sediment-water interface into contact with waters in which CaCO3 tends to dissolve (Le and Shackleton Reference Le and Shackleton1992; Yu and Elderfield Reference Yu and Elderfield2007). Consequently, the foraminifer shells can be partly dissolved, and potentially recrystallized with secondary calcite when pore-fluid carbonate saturation increases again, yielding an altered 14C composition (Peng and Broecker Reference Peng and Broecker1984; Barker et al. Reference Barker, Broecker, Clark and Hajdas2007; Wycech et al. Reference Wycech, Kelly and Marcott2016). In particular, it has been observed that frosty and recrystallized shells appear older in the 14C scale than translucent and well-preserved shells (Mekik Reference Mekik2014; Wycech et al. Reference Wycech, Kelly and Marcott2016), potentially producing negative 14C B-P ages. In order to assess the dissolution/recrystallization state of our foraminifer samples, we (i) examined some specimens on scanning electron microscope (SEM) pictures (see text S2 for details) and (ii) analyzed the consistency between leach and main fraction 14C measurements. Generally, the foraminifers look well preserved. In details, the benthic foraminifers analyzed do not exhibit recrystallization features (see Figure S3). By contrast, some planktonic foraminifers exhibit some secondary calcite crystals with characteristic rhombohedral shape as well as dissolution features (see Figure S3). This can be related to the more fragile shell of planktonic foraminifer, exhibiting finer outer 3D structures compared to their benthic counterparts displaying rather smooth surfaces (see Figure S3). Therefore, we cannot exclude at this stage that the planktonic foraminifera’s shells have incorporated older carbon from the surrounding sediments during their dissolution and recrystallization. However, there is no obvious downcore change in the planktonic foraminifer dissolution. Thus, if dissolution and recrystallization processes could produce negative 14C B-P ages, they do not obviously explain the shift between the upper part of the core (with negative 14C B-P ages) and the deeper part of the core (exhibiting positive 14C B-P ages).
In addition, the analysis of our gas main and leach fraction 14C content can also bring information about the preservation (dissolution/recrystallization) state of the foraminifer specimens that have been analyzed for 14C and that could not be pictured with SEM due to sample preparation requirements. If the leaching acid dissolves always the same amount of CaCO3, the nature of what is exactly dissolved is still unclear. It is expected that the leach fraction corresponds to the foraminifer outer shell that is directly exposed to the leaching acid, or possibly to coccoliths remaining at the surface of the foraminifera shells (as they can be present on the analyzed specimens; see Figure S3A [c, d, e, f]). Overall, this material has been exposed to the modern atmosphere since core retrieval and therefore, the leach fraction has usually slightly younger 14C ages than the main fraction, which corresponds to the inner shells (see Figure S4). However, an altered sample (i.e. a shell that has undergone significant dissolution/recrystallization), would display an outer shell (leach fraction) generally older than the inner shell (main fraction), which can be related to the incorporation of older or even 14C dead carbon content from the underlying sediment layers during dissolution/recrystallization processes, as suggested by (Broecker et al. Reference Broecker, Mix, Andree and Oeschger1984; Barker et al. Reference Barker, Broecker, Clark and Hajdas2007). Importantly, altered shells will also be characterized by a high difference between the outer part (leach fraction) and the inner part (main fraction). To distinguish potentially contaminated (e.g. by coccoliths), altered or dissolved samples we discard the samples for which the 14C age difference between the main and the leach fraction largely exceeds the expectations. Assuming distinct exponential relationships between the sample 14C age (i.e. content) and the analytical uncertainty for both the main fraction and the leach fraction, we estimate from 10,000 Monte Carlo draws the expected apparent 14C age offset between a main and a leach fraction having supposedly the same 14C age (Figure S4). Note that the analytical uncertainty of the leach fraction is larger than the one of the main fraction, for a given age because the leach fraction is of a smaller size. Besides, for our samples, the main and leach fraction are not expected to strictly have the same age due to potential contaminations of the sample. In this study we tolerate an age offset between the main and leach fraction which is up to 3 times equal to the mean expected age offset accrued by 1σ. We also rejected the samples displaying a very negative main-leach fraction offset (i.e. below the expected mean, 2σ) as older leach fraction is a potential indicator for recrystallization as discussed above. By following this procedure, we excluded 9-paired leach and main fraction 14C gas measurements from our dataset (see Figure S4), representing less than 10% of our available gas measurements. Interestingly the benthic sample which appeared off-trend (Figure 2) did not pass the leaching test.
To conclude, we observe repeated negative 14C B-P ages for the post HS1 part of SU90-08 record that cannot be simply considered as outliers. We show that those results are unlikely to correspond to hydrothermal imprint on the foraminifer 14C content or be the result of dissolution/recrystallization of the foraminifer shells. Therefore, these negative 14C B-P ages have to be interpreted in terms of modern and past oceanic ventilation changes, or sediment dynamics and mixing of benthic and planktonic foraminifers.
Reconciling Negative B-P Ages with Ocean Ventilation
Sample Heterogeneity Highlighted by Small-Sized 14C Measurements
The comparison between gas and graphite measurements as well as the leach fraction analysis permits to screen the raw 14C B-P ages. In what follows, we retain the graphite-graphite B-P ages (red on Figure 5B), the gas data that passed the leaching control test (see Figure S4 for details) (orange on Figure 5B) and gave priority to gas measurements replicates in agreement with available graphite measurements (green on Figure 5B). Interestingly, graphite pairs of 14C B-P ages correspond to the average of the replicated gas 14C B-P ages except for one depth (35 cm, 10.1 ka) where the graphite pair 14C B-P age is completely offset compared to the gas measurements. This can be related to the sample size requirement of each measurement: because the graphite analysis requires more material, the sampled individuals (n >100 shells) are more likely to statistically represent the average of the analyzed level than the gas samples (n < 50 shells) (Lougheed et al. Reference Lougheed, Metcalfe, Ninnemann and Wacker2018). We observe that the screened 14C B-P ages record obtained by discarding potentially altered measurements and averaging the replicated 14C B-P ages for each level, contain less negative 14C B-P ages (Figure 5B). Thus, it seems very important to adapt the 14C measurement technique according to the study objectives (e.g. average signal or insights in sample heterogeneity) and of course the material availability. Interestingly such sample heterogeneity was not highlighted in existing benthic and planktonic stable isotope records (e.g. Vidal et al. Reference Vidal, Labeyrie, Cortijo, Arnold, Duplessy, Michel, Becque and Van Weering1997) though they also require a small number of picked and analyzed individuals (in the present case, n = 30 for planktonic isotopes and n = 1 to 4 for benthic isotopes). This can be mostly attributed to the fact that Holocene stable isotopes have similar values throughout the Holocene period, minimizing the effect of post depositional mixing (bioturbation). Additionally, as proposed by Lougheed et al. (Reference Lougheed, Metcalfe, Ninnemann and Wacker2018), this can be attributed to the nonlinear relationship between 14C activity and 14C age. In fact, the addition of a relatively small amount of 14C young material significantly shifts the final 14C age toward a younger value compared to the actual average 14C age of the sample. Therefore, our study confirms that 14C measurements, and particularly measurements of small-sized samples, offer some insights into deep sea sediment heterogeneity and mixing (Costa et al. Reference Costa, McManus and Anderson2017; Lougheed et al. Reference Lougheed, Metcalfe, Ninnemann and Wacker2018).
Consistent Evidence for a Marked Ventilation Change during the Last Deglaciation
Beyond 14C, other proxy measurements may also be used to inform on past bottom water “ventilation,” in particular where these relate to deep-water oxygenation. In the modern ocean, a tight relationship is observed between apparent oxygen utilization and the δ13C signature of dissolved inorganic carbon (Eide et al. Reference Eide, Olsen, Ninnemann and Johannessen2017), providing the basis of the use of the benthic δ13C as an indirect “paleoventilation” proxy (Duplessy et al. Reference Duplessy, Shackleton, Fairbanks, Labeyrie, Oppo and Kallel1988). More recently, it has also been suggested that the REE composition of early diagenetic surface enrichments of planktonic foraminifera can be used to inform on past changes in the oxygen supply to sediments from seawater (Boiteau et al. Reference Boiteau, Greaves and Elderfield2012; Skinner et al. Reference Skinner, Sadekov, Brandon, Greaves, Plancherel, de La Fuente, Gottschalk, Souanef-Ureta, Sevilgen and Scrivner2019). In oxic seawater, Ce will be present in the less soluble +IV oxidation state, unlike its neighboring trivalent REE, La and Nd, resulting in the loss of Ce from the water column and a characteristic Ce depletion (or “Ce anomaly”). Despite early hopes that the special behavior of Ce might lend itself to the use of Ce-anomalies in marine sediments as a proxy for past water oxygenation (Liu et al. Reference Liu, Miah and Schmitt1988; German and Elderfield Reference German and Elderfield1990), it appears that REE signatures preserved in marine sediments, for example in early diagenetic surface enrichments on foraminifera, record a significant pore-water influence (German and Elderfield Reference German and Elderfield1990; Skinner et al. Reference Skinner, Sadekov, Brandon, Greaves, Plancherel, de La Fuente, Gottschalk, Souanef-Ureta, Sevilgen and Scrivner2019). While this would preclude their use as direct indicators of seawater composition, it has been argued that oxygen supply to sediments from seawater could nonetheless still influence the progressive “erosion” of Ce-anomalies recorded in foraminifer surface enrichments (Skinner et al. Reference Skinner, Sadekov, Brandon, Greaves, Plancherel, de La Fuente, Gottschalk, Souanef-Ureta, Sevilgen and Scrivner2019), producing a Ce-enrichment (relative to an expected seawater depletion), analogous to authigenic Uranium enrichment under low oxygen conditions (Klinkhammer and Palmer Reference Klinkhammer and Palmer1991; Boiteau et al. Reference Boiteau, Greaves and Elderfield2012).
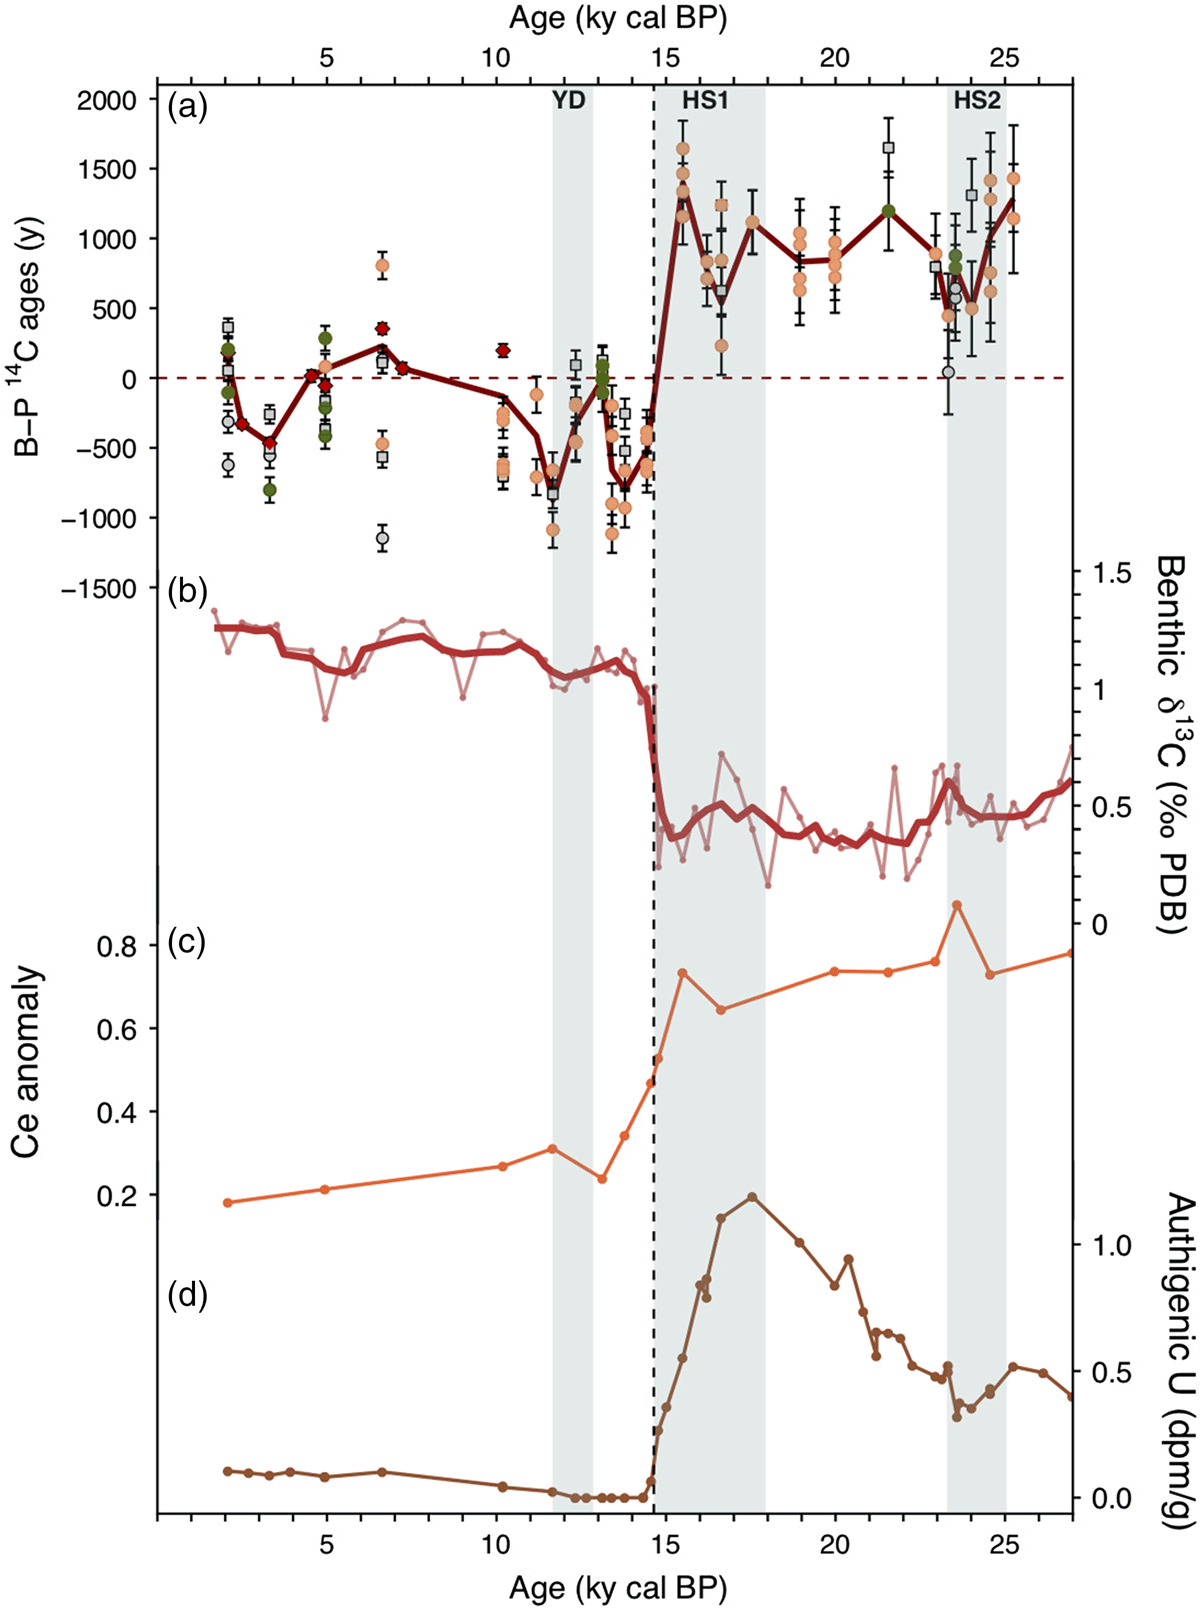
In this section we compare additional oxygenation-related proxies (i.e. SU90-08 benthic δ13C—text S3, and Ce enrichments—text S1, as well as authigenic U (Missiaen et al. Reference Missiaen, Pichat, Waelbroeck, Douville, Bordier, Dapoigny, Thil, Foliot and Wacker2018) to SU90-08 14C B-P record (Figure 6). Interestingly, all of the records display a relatively synchronous and marked change at the end of HS1 and suggest an increased bottom water oxygenation and ventilation during the Holocene compared to the last glacial period (Figure 6). Late Holocene δ13C values are consistent with the well oxygenated and ventilated Labrador Sea Water mixed with the lower North Atlantic Deep water bathing SU90-08 location (Paillet et al. Reference Paillet, Arhan and McCartney1998). Finally, glacial 14C B-P ages indicate an increase of the age gradient between the deep and surface waters with respect to the Holocene.

Figure 6 Ventilation and oxygenation time series for SU90-08: (a) B-P 14C ages (as in Figure 3). (b) Benthic δ13C. The light red line and dots represent the raw data the bold red line represents smoothed data (running average with 5 points). (c) Ce anomaly. (d) Authigenic U calculated after Missiaen et al. (Reference Missiaen, Pichat, Waelbroeck, Douville, Bordier, Dapoigny, Thil, Foliot and Wacker2018). The vertical bands indicate the millennial scale events (YD, HS1, and HS2). The vertical black dashed line highlights the marked ventilation and oxygenation transition at the end of HS1. Age model from Missiaen et al. (Reference Missiaen, Waelbroeck, Pichat, Jaccard, Eynaud, Greenop and Burke2019).
The tentative oxygenation and ventilation history inferred for this site can help explain the reported negative 14C B-P ages. Indeed, under modern, and by extension Holocene conditions, the 14C age gradient between the surface and deep waters is less than 300 years (Key et al. Reference Key, Kozyr, Sabine, Lee, Wanninkhof, Bullister, Feely, Millero, Mordy and Peng2004). This reduced 14C age difference is hardly observable in the fossil record because it is very close to the propagated uncertainty of 14C B-P ages. This is particularly true for gas measurements for which the Holocene average 1σ uncertainty is 80 yr for both benthic and planktonic measurements leading to a propagated 1σ uncertainty on a gas pair of 14C B-P ages of about 110 yr. For comparison, the propagated uncertainty on a graphite pair of 14C B-P ages is around 60 yr. Second, the oxygenation and ventilation history is very likely to influence the bioturbation level of the sediment core. Indeed, it appears logical that more benthic fauna might have developed during high oxygenation periods, thus potentially enhancing sediment bioturbation, as suggested by modern observations (e.g. Diaz and Rosenberg Reference Diaz and Rosenberg1995; Sturdivant et al. Reference Sturdivant, Díaz and Cutter2012).
Producing Negative 14C B-P Ages Using a Simulation of Bioturbated Sediment
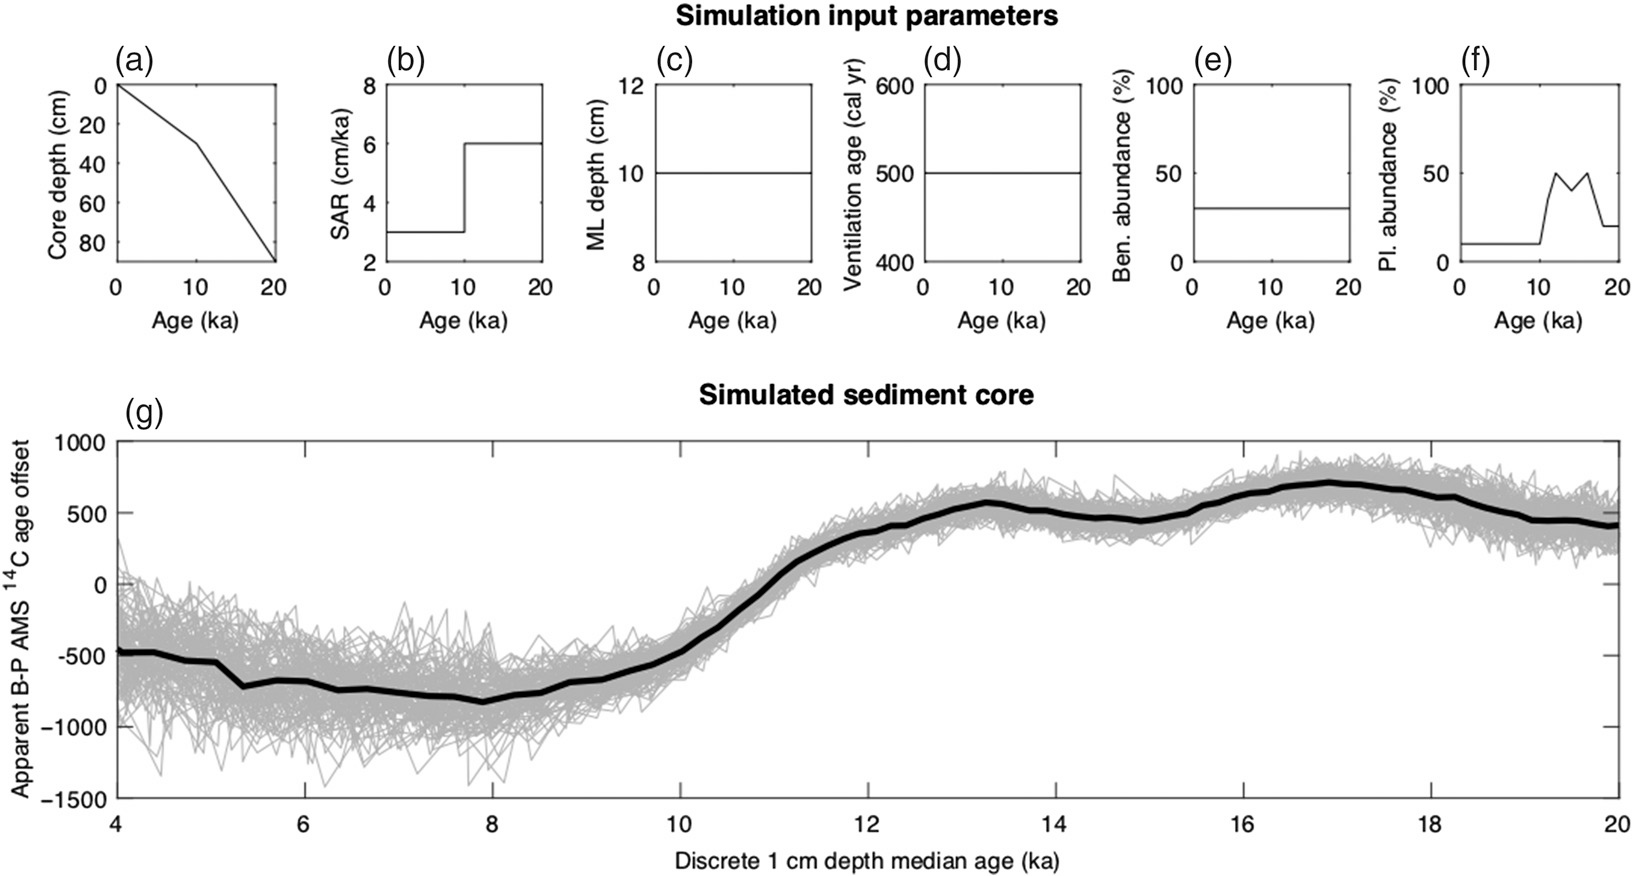
To further explore the potential of bioturbation to produce the negative 14C B-P ages observed after HS1 on SU90-08 record, we created an idealized single foraminifera sediment archive simulation, using a single foraminifera sedimentation model developed by (Lougheed Reference Lougheed2020). In order to construct an idealized modeling environment whereby as many variables as possible are kept constant, we considered a simple scenario with constant true ventilation ages and a uniform sediment mixed layer depth of 10 cm as well as idealized benthic and planktonic foraminifer abundances (Figure 7), so that we may use the model to quantify the influence of an isolated change in a single variable. The simulation only considers one class (species) of planktonic foraminifers and one class (mixed species) of benthic foraminifers. Also, we do not consider millennial scale variability in the input planktonic foraminifer abundance evolution, and simply assume higher abundances during the glacial period compared to the Holocene.

Figure 7 Simulated B-P 14C ages with constant ventilation age but changing foraminifer abundances and sedimentation rate. Single foraminifera sediment simulation with 10-year timesteps and 104 single foraminifera per cm (simulated using SEAMUS bioturbation model, Lougheed Reference Lougheed2020) with constant mixed layer depth (10 cm) and ventilation age (500 years). At each timestep n new foraminifera are deposited (n scaled to the sedimentation accumulation rate of the timestep) and assigned a depth according to the input age-depth model. Each foraminifer is assigned a species type (in this case simply planktonic, benthic or other) according to the input abundance for the timestep. 14C activity for each timestep is determined using Marine13), with a timestep ventilation age in the case of benthic foraminifera. At each timestep, depth values in the uppermost depth (mixed layer depth 10 cm) are uniformly mixed using random sampling of the mixed depth interval. After the end of the simulation, discrete depth benthic and planktonic expected ages are calculated by taking the mean 14C activity of the benthic and planktonic foraminifera for each discrete depth.
This is generally consistent with the broad evolution of G. bulloides abundances in SU90-08 (Figure 1) but intentionally does not mimic the full complexity of observed planktonic abundance. Because of the absence of benthic abundance record and because this is an idealized experiment, we chose to consider a constant benthic abundance. With those simplified settings, we show that it is possible to produce negative 14C B-P ages for the younger periods. Decreased abundance of planktonic species during younger periods compared to older periods (pre-HS1), combined with bioturbation, lead to a bias of planktonic 14C ages towards older 14C ages for younger periods, the bioturbation moving upward material from high abundance peaks lower down in the core. Subsequently, if the abundance histories of benthic and planktonic foraminifera are out of phase or significantly different (as shown here), erroneous 14C B-P ages can be produced. This is consistent with earlier studies such as Peng and Broecker (Reference Peng and Broecker1984); Wu and Hillaire-Marcel (Reference Wu and Hillaire-Marcel1994). In addition, the dynamic 14C history of the atmosphere, combined with the delay necessary for 14C activity to reach the deep ocean, can also lead to dynamics in 14C B-P ages that are not necessarily related to ocean ventilation (e.g. Adkins Reference Adkins1997; Lund et al. Reference Lund, Mix and Southon2011).
CONCLUSIONS
We have performed 14C measurements on benthic and planktonic foraminifers from deep sea sediment core SU90-08 using gas introduction system and MICADAS setup. This experimental setting allows the analysis of small-sized samples making high-resolution 14C measurements possible for cores with low foraminifer content. Besides, the use of the gas introduction system reduces the samples preparation time and the contamination risk as it omits the graphitization step. Additionally, the analysis of the 14C content of the leach fraction corresponding to the outer foraminifer shell can bring valuable information about the dissolution/recrystallization state of the analyzed material.
We have shown that the measurements obtained were accurate and that the precision was only slightly decreased compared to conventional graphite AMS measurements. The reproducibility of the gas MICADAS measurements is generally satisfactory and highly dependent on the analyzed foraminifer material. Our gas measurements generally agree with conventional graphite measurements within 2σ uncertainty and graphite measurements yield values close to the average of the two gas replicates.
From this 14C dataset we calculated ensembles of 14C B-P ages for each considered sediment level and obtained reproducible negative 14C B-P ages in the post HS1 part of the record. We showed that those negative 14C B-P ages unlikely reflect a hydrothermal imprint on 14C content or the effect of the dissolution and recrystallization of the foraminifer shells. Instead, we argue that small-sized 14C analysis highlights the heterogeneity of the foraminifer material contained in a single sediment level, particularly under conditions of relatively low sediment accumulation. We argue that these negative 14C B-P ages actually reflect potential core bioturbation in a context of very low 14C age gradient between the surface and deep waters. Indeed, additional/auxiliary ventilation and oxygenation proxies derived from benthic δ13C and Ce anomalies in authigenic foraminifer coatings indicate that poorly ventilated and less oxygenated deep-water bathed the site until the end of HS1. After this, well-ventilated and oxygenated deep-water, likely originating in part from the Labrador Sea, bathed the site as under modern conditions. This ventilation and oxygenation history is consistent with enhanced bioturbation after HS1. Consequently, established understanding of bioturbation, combined with dynamic changes in benthic and planktonic foraminiferal abundances, help to explain the existence of negative 14C B-P ages, as we show using a single foraminifera simulation (Lougheed Reference Lougheed2020).
Therefore, it appears that the main limitation for small-sized gas 14C analysis stems not from the method, but from the syn- and post-depositional history of the sedimentary material that is analyzed. More so than conventional stable isotopes, replicated small-sized 14C measurements appear to reveal the heterogeneity of the material contained in a sediment level. There are two major reasons for this: (i) the replication of small-sized analysis gives insight into the distribution of the 14C age of the sediment level content, and (ii) 14C activity has an exponential relation with time, which makes it even more sensitive to mixing of differently aged components. This case study highlights that the uncertainty on 14C measurements that derives from machine error propagation can often be much smaller than the noise/uncertainty related to the sedimentation history. Special care should therefore be taken when interpreting small variations in 14C B-P age offsets, as they could reflect the impacts of bioturbation, dissolution/recrystallization, or just changes in atmospheric 14C composition, rather than ocean ventilation changes.
ACKNOWLEDGMENTS
This is a contribution to ERC project ACCLIMATE; the research leading to these results has received funding from the European Research Council under the European Union’s Seventh Framework Programme (FP7/2007-2013)/ERC grant agreement 339108. LM acknowledges funding from the Australian Research Council grant DP180100048. BCL acknowledges Swedish Research Council (Vetenskapsrådet – VR) Starting Grant number 2018-04992. LCS acknowledges support from NERC grant NE/L006421/1. We thank E. Michel for fruitful discussion and S. Moreira for his help with R programming. This is LSCE contribution 6963. The authors declare that they have no conflicts of interest. The data will be available online on Pangaea database (https://www.pangaea.de/).
Supplementary material
To view supplementary material for this article, please visit https://doi.org/10.1017/RDC.2020.13


 Open access