


INTRODUCTION
The incomplete combustion of biomass and fossil fuels generates solid pyrogenic carbon (PyC) residues, which occur ubiquitously in the environment (Bird et al. Reference Bird, Wynn, Saiz, Wurster and McBeath2015). Investigations of these products of incomplete combustion are particularly challenging in complex matrices due to a large variety of possible structural configurations of condensed aromatic compounds (Bird et al. Reference Bird, Wynn, Saiz, Wurster and McBeath2015; Blumer Reference Blumer1976; Hedges et al. Reference Hedges2000). In addition to conventional methods that trace PyC on a bulk level (Gustafsson et al. Reference Gustafsson, Bucheli, Kukulska, Andersson, Largeau, Rouzaud, Reddy and Eglinton2001; Masiello et al. Reference Masiello, Druffel and Currie2002; Meredith et al. Reference Meredith, Ascough, Bird, Large, Snape, Sun and Tilston2012), specific polycyclic aromatic hydrocarbons (PAHs) and benzene polycarboxylic acids (BPCAs) can serve as molecular-level tracers of combustion residues (Blumer and Youngblood Reference Blumer and Youngblood1975; Glaser et al. Reference Glaser, Haumeier, Guggenberger and Zech1998; Lima et al. Reference Lima, Farrington and Reddy2005). Recently, we have shown that combined analysis of the abundances and distributions of both PAHs and BPCAs yields a more comprehensive view of the continuum of combustion residues occurring in environmental matrices (Hanke et al. Reference Hanke, Eglinton, Braun, Reddy, Wiedemeier and Schmidt2016). It follows that the addition of corresponding 14C signatures could greatly enhance our understanding of the origin of PyC accumulating in the environment. Radiocarbon (14C) analyses of combustion products in environmental samples have the unique ability of apportioning sources of PyC to either biomass or fossil fuel combustion (Currie and Murphy Reference Currie and Murphy1977). However, the preparation of microgram quantities of sample material for 14C analysis at the molecular level requires an extended chemical scheme and careful attention in order to minimize the addition of extraneous carbon prior to isotopic measurement.
BPCA molecular markers are produced by the oxidative chemical degradation of combustion residues (charred biomass) and condensates (soot-like structures) (Glaser et al. Reference Glaser, Haumeier, Guggenberger and Zech1998; Roth et al. Reference Roth, Lehndorff, Brodowski, Bornemann, Sánchez-García, Gustafsson and Amelung2012). The BPCAs are composed of benzene rings with a varying number of carboxylic acid groups (Glaser et al. Reference Glaser, Haumeier, Guggenberger and Zech1998). The method was originally developed for quantitative gas chromatographic (GC) measurement of BPCAs as their corresponding methyl ester derivatives (Glaser et al. Reference Glaser, Haumeier, Guggenberger and Zech1998), this GC-based has subsequently been extended with a focus on compound-specific 14C analysis (CSRA) of BPCAs (Ziolkowski and Druffel Reference Ziolkowski and Druffel2009; Coppola et al. Reference Coppola, Ziolkowski and Druffel2013). In these latter studies, BPCAs were isolated via preparative capillary gas chromatography (PCGC) and subsequently graphitized for accelerator mass spectrometry (AMS) measurements. More recently, the BPCA analysis method has been adapted for liquid chromatography (LC) (Dittmar Reference Dittmar2008; Schneider et al. Reference Schneider, Smittenberg, Dittmar and Schmidt2011). This LC-based method allows for preparative isolation of individual BPCAs for isotopic analysis without derivatization prior to chromatographic separation (Gierga et al. Reference Gierga, Schneider, Wiedemeier, Lang, Smittenberg, Hadjas, Bernasconi and Schmidt2014; Wiedemeier et al. Reference Wiedemeier2016).
Advances in AMS technology now enable 14C measurements of carbon dioxide gas at natural abundance levels on an ultra-microscale (2–100 µg C) (Fahrni et al. Reference Fahrni, Wacker, Synal and Szidat2013; Wacker et al. Reference Wacker, Fahrni, Hajdas, Molnar, Synal, Szidat and Zhang2013). Direct measurements of CO2 supersede and negate the additional steps required for graphitization, albeit at the expense of precision. Recently, Lang and collaborators have developed a method based on wet chemical oxidation (WCO) for 14C analysis of dissolved organic carbon (Lang et al. Reference Lang, Früh-Green, Bernasconi and Wacker2013, Reference Lang, McIntyre, Bernasconi, Früh-Green, Voss, Eglinton and Wacker2016). Compared with conventional approaches, such as those employing ultraviolet radiation (Armstrong et al. Reference Armstrong, Williams and Strickland1966; Beaupré et al. Reference Beaupré, Druffel and Griffin2007), closed-tube combustion with cupric oxide (Boutton et al. Reference Boutton, Wong, Hachey, Lee, Cabrera and Klein1983; Mann et al. Reference Mann, Eglinton, McIntyre, Zimov, Davydova, Vonk, Holmes and Spencer2015), or oxidation in the presence of permanganate (Leonard et al. Reference Leonard, Castle, Burr, Lange and Thomas2013), the WCO method serves as a simple and effective approach that increases sample throughput and reduces costs. It is especially well suited to CSRA of water-soluble carbon compounds with low volatility. It has recently been demonstrated that BPCAs can be purified using preparative LC (LCprep), then oxidized via WCO and measured for 14C using a gas ion source-equipped AMS (Gierga et al. Reference Gierga, Schneider, Wiedemeier, Lang, Smittenberg, Hadjas, Bernasconi and Schmidt2014). The integration of multiple process standards with minimal additional effort introduces a new level of blank assessment that can greatly improve the quality of small-scale 14C data.
Preparative chromatographic purification of individual compounds commonly yields less than 50 µg C, thus molecular-level 14C techniques are prone to extraneous carbon (McNichol and Aluwihare Reference McNichol and Aluwihare2007) introduced during chemical pretreatment, purification and combustion steps. The smaller the sample sizes are, the higher the impact of extraneous carbon, particularly at the microgram scale level (5–25 µg) (Kirner et al. Reference Kirner, Taylor and Southon1995; Shah and Pearson Reference Shah and Pearson2007; Santos et al. Reference Santos, Southon, Drenzek, Ziolkowski, Druffel, Xu, Zhang, Trumbore, Eglinton and Hughen2010). To obtain accurate results, a careful assessment and correction of CSRA data is required, this is most readily achieved using the model of constant contamination, i.e. assuming a constant source and quantity of extraneous carbon. This represents a simple yet comprehensive approach to derive robust estimates of the true 14C value of unknowns via mass balance and propagation of errors (Shah and Pearson Reference Shah and Pearson2007; Hwang and Druffel Reference Hwang and Druffel2008; Ziolkowski and Druffel Reference Ziolkowski and Druffel2009; Santos et al. Reference Santos, Southon, Drenzek, Ziolkowski, Druffel, Xu, Zhang, Trumbore, Eglinton and Hughen2010; Wacker and Christl Reference Wacker and Christl2012). Contamination in sample materials comes from multiple sources and can carry fossil (e.g. petrochemical-derived solvents) as well as modern (e.g. ambient air) 14C signatures. Thus, an assessment of extraneous carbon requires the use of 14C standards with complementary 14Cdepleted and 14Cmodern signatures in order to enable the determination of actual mass and F14C of the total contamination (Mollenhauer and Rethemeyer Reference Mollenhauer and Rethemeyer2009).
Assessing the extraneous carbon in multistep CSRA procedures and correcting the measured data for the total contamination is challenging yet crucial in order to yield refined molecular isotopic data that allows for a robust interpretation of the results. In the present study, we analyze a variety of process standards that encompass the full range of subprocedures. Additionally, the potential of the 14C-BPCAs methodology for real-world samples was tested using triplicate analysis of four different standard reference materials. The objectives of this study were to (1) quantify extraneous carbon in subprocedures of 14C-BPCA analyses, (2) allocate sources of extraneous carbon and propagate the errors, and (3) derive robust F14C values for BPCAs from four reference materials.
MATERIALS AND METHODS
Overview
The methodology used for BPCAs compound-specific isotopic analyses has been described and visually presented in detail elsewhere (Wiedemeier et al. Reference Wiedemeier2016). Here, the focus is the characterization of the subprocedures; an overview of the steps and standard materials is given below and in Table 1. Each subprocedure uses a pair of 14C-modern and 14C-depleted materials (Table S1). For the entire procedure, we used chromatography-grade solvents and glassware that had recently (<48 hr) been precombusted (5 hr, 500°C).
Table 1 BPCA 14C subprocedures including the type and range of different process standards and always consisting of both a 14C depleted and modern material.

*NIST SRM4990C.
Chemical Pretreatment: PyC Oxidation and BPCA Extraction
The archeological (MA) and laboratory (W450) model charcoals are described in a previous study (Gierga et al. Reference Gierga, Schneider, Wiedemeier, Lang, Smittenberg, Hadjas, Bernasconi and Schmidt2014). The archeological charcoal was found in pyroclastic deposits at Maninjau, Sumatra (Alloway et al. Reference Alloway, Pribadi, Westgate, Bird, Fifield, Hogg and Smith2004) and had an F14C=0.003±0.001 (ETH-50456) whereas the laboratory charcoal was obtained from the pyrolysis of chestnut woodchips under controlled conditions in the laboratory (Hammes et al. Reference Hammes, Smernik, Skjemstad, Herzog, Vogt and Schmidt2006) and had an F14C=1.149±0.004 (ETH-50457). For both samples, bulk 14C values were determined after acid-base-acid pretreatment ahead of the analysis to remove extraneous organic matter (Gierga et al. Reference Gierga, Schneider, Wiedemeier, Lang, Smittenberg, Hadjas, Bernasconi and Schmidt2014).
An initial mass of model charcoals was back-calculated from previous data, targeting concentrations of 100±30 µg C mL–1 (per vial) for the sum of (1,2,3,4,5)- and (1,2,3,4,5,6)-benzene polycarboxylic acids. Weighed sample masses were heated with 2 mL HNO3 (65%) in Teflon pressure chambers at 170°C for 8 hr. After a vacuum filtration using glass syringes (6 mL) and a glass fiber filter (Chromabond® 0.7 µm mesh size) an aliquot (40%) was pipetted onto a cation exchange resin (Dowex® 50WX8) and then further cleaned by solid phase extraction (Discovery® DSC-18, 500 mg tubes) before being transferred into analytical vials with 1 mL ultrapure water (Milli-Q® Advantage A10, ≤3 ppb TOC).
Purification: Preparative Liquid Chromatography (LCprep)
Commercially available (1,2,3)-, (1,2,4)-, (1,2,4,5)-, (1,2,3,4,5)- and (1,2,3,4,5,6)-benzene polycarboxylic acid (≥98%, Fluka and Aldrich) were used for the quantification of BPCAs in external standard solutions. These five pure BPCA compounds each had bulk 14C values of F14C≤0.0008 (ETH-57051 to 57055). For the modern counterpart, we used (1,2,4)-benzene polycarboxylic acid (≥98%) prepared by custom synthesis (Chempur, Germany) with a bulk F14C=1.0422±0.0035 (ETH-62938). Solutions of 200 µg mL–1 BPCAs in ultrapure water were equivalent to an ideal concentration of BPCAs in environmental samples aiming at yields of 30 µg C in purified fractions.
The LCprep method for BPCA 14C had a total runtime of 30 min, using a reversed phase analytical C-18 column (Agilent, 2.7 µm) with two mobile phases: ultrapure water (1.7% H3PO4) and acetonitrile (≥99.98%, Scharlau, F14C<0.004, ETH-74445). The elution times for BPCAs varied from 5.98 to 19.05 min depending on their polarity and structural features. Target compounds included either individual BPCA or combined BPCAs consisting of (1,2,3,4,5,6)-BPCA and (1,2,3,4,5)-BPCA for all environmental samples. After quantifying the respective compounds in solution (1 µL inj.-vol.–1) using a diode array detector (60 mm path length) the injection volume (1 to 20 µL inj.–1) was adjusted to equal 1 µg C BPCAs–1 at this level baseline separation was maintained. All BPCAs were collected in separate vials (≤6 mL) in repetitive runs and the fractions were placed on a heating plate (~70°C) under a gentle ultrapure nitrogen stream to evaporate the solvent for 3 hr. Subsequently, samples were stored in screw-cap vials with Teflon seals in the refrigerator until the next analytical step. We also collected blank eluents with a time window immediately preceding the target BPCA. The time window was 0.3 min for (1,2,3,4,5,6)-BPCA and 0.24 min for all the other BPCAs. Blanks were spiked with either sucrose or phthalic acid in concentrations of 15, 25, 40 µg C prior to the wet chemical oxidation (WCO) step.
Wet Chemical Oxidation
The WCO procedure was performed according to Lang et al. (Reference Lang, Früh-Green, Bernasconi and Wacker2013). Standards of phthalic acid (≥99.5%, Sigma-Aldrich) and sucrose (≥99.5%, Sigma) were dissolved in ultrapure water at a concentration of 2 µM and 1.5 µM respectively. The bulk 14C values were F14C≤0.0008 (ETH-57049) for phthalic acid and F14C=1.149±0.0048 (ETH-57050) for sucrose. The standard solutions were prepared with the identical ultrapure water we had used for the preparation of the oxidant on the same day.
The WCO procedure converts BPCAs to carbon dioxide (CO2), which then can directly be measured for 14C using a gas ion source-equipped AMS (Lang et al. Reference Lang, Früh-Green, Bernasconi and Wacker2013). About 30 µg C sample–1 and 5 mL of purified sodium persulfate solution were transferred into 12 mL gas-tight borosilicate Exetainer vials with butyl rubber septum (Labco, UK) using acidified ultrapure water. The screw-capped vials were then purged with ultra high purity helium at 100 mL min–1 for 8 min. Oxidation of the samples is achieved by placing the vials in a heating block at 95°C for 1 hr (Lang et al. Reference Lang, McIntyre, Bernasconi, Früh-Green, Voss, Eglinton and Wacker2016).
Measurement: Gas Ion Source AMS
Gaseous samples were measured with a MIni CArbon DAting System (MICADAS, Ionplus, Switzerland) AMS fitted via a carbonate handling system modified with a needle for sparging solutions (Fahrni et al. Reference Fahrni, Wacker, Synal and Szidat2013; Wacker et al. Reference Wacker, Fahrni, Hajdas, Molnar, Synal, Szidat and Zhang2013). Briefly, sample CO2 (10–100 µg C) was sparged from the solution in septa-sealed vials onto a zeolite molecular sieve trap. The CO2 gas was subsequently thermally desorbed and transferred to a gas-tight syringe with helium, then slowly injected into the gas-accepting ion source of the AMS at a constant rate (Lang et al. Reference Lang, McIntyre, Bernasconi, Früh-Green, Voss, Eglinton and Wacker2016). The measurement time was set to a maximum of 8 min in order to attain a precision of better than 1% on modern standard. The measured background was better than 44,000 14C yr. AMS data were normalized and background corrected with in-house standard gases prepared from Oxalic acid II (NIST SRM 4990C, F14C=1.3407; ETH-54368) and ancient carbon dioxide (F14C≤0.0041; ETH-41218). Gas samples (10–60 µg C) were measured in a single sequence of in total 64 AMS measurements.
Statistical Evaluation of Radiocarbon Data
Data were processed using BATS software (Wacker et al. Reference Wacker, Christl and Synal2010) and the measured 14C/12C ratios are reported as F14C according to Reimer et al. (Reference Reimer, Brown and Reimer2004). To extract the F14C of samples (F14CS) from the measured AMS data (F14CM), we applied the model of constant contamination represented by Equation (1)
 $${\rm F}^{{{\rm 14}}} {\rm C}_{{\rm S}} {\equals}{{{\rm F}^{{{\rm 14}}} {\rm C}_{{\rm M}} {\rm {^\asterisk}\,m}_{{\rm M}} {\minus}{\rm F}^{{{\rm 14}}} {\rm C}_{{\rm C}} {\rm {^\asterisk} \,m}_{{\rm C}} } \over {{\rm m}_{{\rm M}} {\rm {\minus}m}_{{\rm C}} }}$$
where F14CC is the contaminant F14C, the total mass of the sample measured by the AMS (mM) is the sum of the mass of the sample (mS) and the mass of the contaminant (mC) (Wacker and Christl Reference Wacker and Christl2012). The associated uncertainty (σF14CS) of F14CS was calculated by propagation of respective errors according to Equation (2)
 $$\eqalignno{ \sigma ^{2} _{{{\rm F}^{{14}} {\rm C}_{{\rm S}} }} {\equals}& \left[ {\sigma _{{{\rm m}_{{\rm C}} }} \left( {{{{\rm F}^{{{\rm 14}}} {\rm C}_{{\rm M}} {\rm {^\asterisk}\, m}_{{\rm M}} {\minus}{\rm F}^{{{\rm 14}}} {\rm C}_{{\rm C}} {\rm {^\asterisk}\, m}_{{\rm C}} } \over {\left( {{\rm m}_{{\rm M}} {\rm {\minus}m}_{{\rm C}} } \right)^{2} }}} \right){\minus}\left( {{{{\rm F}^{{{\rm 14}}} {\rm C}_{{\rm C}} } \over {{\rm m}_{{\rm M}} {\minus}{\rm m}_{{\rm C}} }}} \right)} \right]^{2} \cr & {\plus}\left[ {\sigma _{{{\rm m}_{{\rm M}} }} \left( {{{{\rm F}^{{{\rm 14}}} {\rm C}_{{\rm M}} } \over {{\rm m}_{{\rm M}} {\minus}{\rm m}_{{\rm C}} }}{\minus}{{{\rm F}^{{{\rm 14}}} {\rm C}_{{\rm M}} {^\asterisk}\,{\rm m}_{{\rm M}} {\minus}{\rm F}^{{{\rm 14}}} {\rm C}_{{\rm C}} {\rm {^\asterisk}\, m}_{{\rm C}} } \over {\left( {{\rm m}_{{\rm M}} {\minus}{\rm m}_{{\rm C}} } \right)^{2} }}} \right)} \right]^{2} \cr & {\plus}\left[ {\sigma _{{{\rm F}^{{14}} {\rm C}_{{\rm M}} }} {{{\rm m}_{{\rm M}} } \over {{\rm m}_{{\rm M}} {\minus}{\rm m}_{{\rm C}} }}} \right]^{2} {\plus}\left[ {\sigma _{{{\rm F}^{{14}} {\rm C}_{{\rm C}} }} {{{\rm {\minus}\!m}_{{\rm C}} } \over {{\rm m}_{{\rm M}} {\minus}{\rm m}_{{\rm C}} }}} \right]^{2} $$
In order to obtain F14CS, it is necessary to first determine the contaminant F14CC and mC. For this, we used multiple process standards of known F14C in concentrations that spanned the range of measured samples (10–60 µg C). Pairs of complementary 14C standard materials, one 14C depleted (F14C=0) and the other modern (F14C≥1), were used for evaluation of the contamination using an end-member approach. Different standards were used to assess the contamination of the different subprocedures used in sample preparation (Table 1).
The depleted and modern process standards were used to determine the modern and the dead contamination, respectively, of the sample.
F14CC is then
 $${\rm F}^{{{\rm 14}}} {\rm C}_{{\rm C}} {\equals}{{{\rm F}^{{{\rm 14}}} {\rm C}_{{\rm C}}_{{__{{{\rm modern}}} }} {\rm {^\asterisk}\, m}_{{{\rm C}_{{_{{_{{{\rm modern}}} }} }} }} } \over {{\rm m}_{{{\rm C}_{{{\rm depleted}}} }} {\rm {\plus}m}_{{\rm C}} _{{__{{{\rm modern}}} }} }}$$
and mC
 $${\rm m}_{{\rm C}} {\equals}{\rm m}_{{{\rm C}_{{{\rm depleted}}} }} {\rm {\plus}m}_{{\rm C}} _{{__{{{\rm modern}}} }} $$
for the respective subprocedures. The mass of 14C-depleted and modern contamination was determined by a fit (minimizing the chi-squares) to the measured standards. The amount of mC, separated into 14C-depleted and modern components, was varied to evaluate the best fit of the modeled curves to the measured data. Reduced chi-squared statistics were then used to assess the statistical quality of the evaluation (Pearson’s chi-square test). Subsequently the modern and fossil contamination was used to calculate F14CC (Equation 3) and the mC (Equation 4) for the different subprocedures. The uncertainties in the modeled σF14CC±σmc cannot be determined independently; we thus assigned a 10% uncertainty for each parameter as it accounts well for the observed scatter of the measured process standards. The proportional contribution of contamination for the individual steps of sample preparation was then calculated by subtraction. An example spreadsheet of calculations for the charcoal samples is given in the supplemental information.
Environmental Samples: Reference Materials
Four reference materials representing diverse yet common types of environmental samples were selected and analyzed for bulk 14C and BPCA 14C. Marine sediment Standard Reference Material (SRM) 1941b and urban dust SRM 1649a were obtained from the U.S. National Institute of Standards and Technology (NIST) and full details are given in the certificate of analysis (NIST 2007; 2015). The chernozem soil black carbon reference material was obtained from University of Zurich. Further details are given in Hammes et al. (Reference Hammes, Smernik, Skjemstad and Schmidt2008) and online at http://www.geo.uzh.ch/en/units/2b/Services/BC-material.htmL. Natural organic matter (NOM) from the Suwannee River (2R101N) was obtained from the International Humic Substances Society (IHSS). Samples were analyzed for bulk 14C using conventional graphite preparation at the laboratory of ion beam physics, ETH Zürich. CSRA of BPCAs was performed in triplicate, with resulting data used to apportion fossil (F14C=0) and modern (F14C ~1) sources of combustion products according to Currie et al. (Reference Currie, Stafford, Sheffield, Klouda, Wise, Fletcher, Donahue, Jull and Linick1989). To account for different possible modern sources we used two end members: F14Ccontemporary, which is the year of sampling (annual production) and F14Cbiomass integrating 30 years of biomass growth (perennial production) similar to Xu et al. (Reference Xu, Zheng, Ding, Edgerton and Reddy2012).
RESULTS AND DISCUSSION
Comprehensive characterization and quantification of extraneous carbon in small-scale 14C analyses allow sample 14C values to be accurately determined and facilitates robust data interpretation. Figure 1 illustrates the results of measured process standards (14C modern and depleted) for the three subprocedures—chemical pretreatment, purification, and WCO. The measured results on reference materials can be found in Table 2, including bulk F14C, 14C-BPCA uncorrected (after normalization of MICADAS instrumental measurement uncertainty) and corrected values including the propagation of errors from chemical pretreatment, purification, WCO and AMS. Worthy of note is that after the preparative purification of target compounds, all samples were combusted on a single day (n=55) and then measured on the AMS in a single sequence the following day. The processed AMS data (BATS software, sequence: #C160520UHG1) provided by ETH Zurich is included in the supporting information (Table S2).
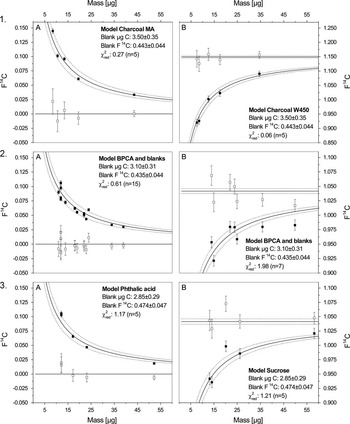
Figure 1 Measured AMS data are plotted as 14C content ( F14C) versus sample size (µg C) for measured process standards (solid black squares) for the different subprocedures with A=F 14 C depleted standards and B=F 14 C modern standards: 1. Chemical pretreatment (process standards that span the entire procedure), 2. Purification (preparative chromatography standards) and 3. Wet Chemical Oxidation (WCO standards). The solid curved lines with the 1-sigma error ranges (dotted) are the chi-square fitted curves. The open squares show the corrected F14C with propagated uncertainties that scatter around the known bulk F14C value of the standard materials (solid straight lines).
Table 2 Results from bulk F14C and BPCAs 14C analysis for four different complex environmental matrices without (F14Cuncorrected) and with correction for the external contamination (F14Ccorrected) using the model of constant contamination.

*Bulk F14C values refer to ETH#: 67206-67209.
Constant Contamination
In small-scale 14C analyses, the total mass measured comprises the mass of the sample and the mass of the contaminant, the latter of which can be assessed via external process standards of known F14C, as well as via spiked process blanks (Lang et al. Reference Lang, McIntyre, Bernasconi, Früh-Green, Voss, Eglinton and Wacker2016; Pearson et al. Reference Pearson, McNichol, Schneider, von Reden and Zheng1998; Ziolkowski and Druffel Reference Ziolkowski and Druffel2009). Encompassing the entire BPCA 14C analysis, the process standard charcoals yield a constant contamination of 3.50±0.35 µg C and 0.443±0.044 F14C. The model BPCAs and blanks (Purification and WCO) are slightly lower with 3.10±0.31 µg C and 0.435±0.044 F14C while the contamination for phthalic acid and sucrose (WCO) is 2.85±0.29 µg C and 0.474±0.047 F14C.
A few studies have previously reported extraneous carbon in CSRA using either a different methodological setup or only certain subprocedures of multistep analyses. For example, Lang and collaborators reported a total contamination for the same WCO procedure of 0.68±0.26 to 1.05±0.23 µg C and 0.027±0.015 to 0.107±0.051 F14C (Lang et al. Reference Lang, McIntyre, Bernasconi, Früh-Green, Voss, Eglinton and Wacker2016). The feasibility study by Gierga and collaborators that provides the foundation for the present approach assessed the uncertainties from AMS as well as WCO, found a contamination of 1.6±0.2 µg C and 0.90±0.14 F14C (Gierga et al. Reference Gierga, Schneider, Wiedemeier, Lang, Smittenberg, Hadjas, Bernasconi and Schmidt2014). Another study focused on purification of a different suite of target compounds, tetra-ether lipids, via LCprep (with closed-tube combustion), found a contamination of 1.0±0.2 µg C (Shah and Pearson Reference Shah and Pearson2007). Contamination in CSRA has also been reported for PCGC (with vacuum line and graphitization) with <1.0±0.5 µg C for fatty acids and <0.17 µg C for phospholipid fatty acids and alkanes (Santos et al. Reference Santos, Southon, Drenzek, Ziolkowski, Druffel, Xu, Zhang, Trumbore, Eglinton and Hughen2010). In the conventional 14C-BPCA method using PCGC (with cupric oxide combustion and graphitization), the extraneous carbon has been estimated to be 2.0±1.0 µg C and 0.158±0.026 F14C in 2011 and 1.6±0.9 µg C and 0.067±0.025 F14C in 2012 (Coppola et al. Reference Coppola, Ziolkowski and Druffel2013) demonstrating a good reproducibility of the method.
Allocation of Constant Contamination to Subprocedures
The multistep design of our approach allows the comprehensive assessment of extraneous carbon in CSRA and the quantitative attribution of contamination to individual subprocedures. As all process standards incrementally include one to three subprocedures, the partial contamination can be calculated backwards from the WCO step. Here, the contamination by WCO accounts for 81% (2.85±0.29 µg C) of total contamination carrying a 14C signature of 0.474±0.047 F14C. Additionally, the LCprep adds 0.25±0.12 µg C (F14C=0.0±0.5) indicating that the source of the contaminant is 14C depleted and probably stems from the incomplete removal of LC mobile phase acetonitrile. The subprocedure chemical pretreatment adds 0.40±0.14 µg C (F14C=0.50±0.25), suggesting that extensive sample transfers and exposure to ambient air may have introduced extraneous carbon from variable sources. Together, the chemical pretreatment and the purification procedures result in an accumulated contamination of 0.65±0.14 µg C (F14C=0.31±0.06). The propagation of error calculations returned uncertainties of about 20 to 50%, depending on the strength of the statistical fit of modeled and measured data. The measured data for the subprocedures WCO and chemical pretreatment fall within the 1-sigma error range, whereas the purification procedure exhibits a slightly larger deviation in the modern standards (Figure 1). Nonetheless, it is evident that the vast majority of total contamination stems from the WCO procedure.
In considering the origin of the WCO contaminant, two possible sources may be taken into consideration—the purified oxidant sodium persulfate and the ultrapure water (5 mL sample–1). A test measurement of the purified oxidant several days ahead of the AMS analysis sequence did not indicate any significant impurity. Thus we infer that the contamination likely originated from the water. About 2 L of MilliQ® water (TOC≤3 ppb) was subsampled on the day of the analyses. The water treatment system was maintained in good condition, including use of fresh (10-week-old) MilliQ® cartridges Q-Guard®T2 and Quantum®TEX. However, the distilled source water feeding the ultra-purification device can vary in purity, even though the displayed TOC may suggest an excellent water quality (~3 ppb TOC). Further precautionary steps, such as UV oxidation of water immediately prior to use, are therefore recommended to minimize this potential source of contamination. Lang et al. (Reference Lang, McIntyre, Bernasconi, Früh-Green, Voss, Eglinton and Wacker2016) showed that the contamination from WCO can be as low as 0.68 µg C which is at least consistent with blank values reported for the other combustion techniques and would result in a total contamination of 1.33 µg C if attained in this study. Additionally, this study used the same experimental setup as Lang et al. (Reference Lang, Früh-Green, Bernasconi and Wacker2013) of 5 mL solvent (sample and oxidant in water) in 12 mL Exetainer vials yet, this could possibly be reduced to 3 mL solvent. This would ideally have lowered the contamination from WCO for 40%. However, such changes to the protocol require test measurements on the gas ion source-equipped AMS for revalidation.
Application and Source Apportionment to Reference Materials
Results for bulk and CSRA 14C signatures and quantities of BPCAs for the four reference materials, representing different environmental settings and matrices, are given in Table 2. Triplicate BPCAs 14C measurements on these standard materials were performed in order to test the applicability and reproducibility of the method. The average 14C abundances in total carbon (TC) vary from F14C=0.509±0.002 to 0.874±0.004, implying that some proportion of TC in each sample is either of fossil origin or was pre-aged, thereby diluting the contemporary 14C signatures at the time of deposition. In contrast, the riverine natural organic matter exhibits contemporary 14C concentrations of 1.057 F14C (Suwannee River NOM, sampled via reverse osmosis in 2012).
BPCA quantification returned values of between 1.39 and 20.85 g kg–1 of sample, accounting for between 4.8 and 10.4% of TC. For CSRA, measured concentrations of (1,2,3,4,5,6)-BPCA and (1,2,3,4,5)-BPCA were between 78.1±6.4 and 128.4±5.3 µgCmL–1. The masses of BPCAs 14C recovered from reference materials varied between 24 to 36 µg C. The measured 14C abundances of different BPCA 14C encompassed almost the entire spectrum of natural abundance 14C values, ranging from 0.088±0.009 F14Ccorrected for atmospheric particulates to 1.020±0.007 F14Ccorrected for the riverine NOM. The latter is indistinguishable from that of Coppola et al. (Reference Coppola, Walker and Druffel2015) who reported 1.02±0.02 F14C for the same material using a different molecular 14C approach.
Combustion-derived carbon can be apportioned to fossil and contemporary sources by F14C measurements (Currie and Murphy Reference Currie and Murphy1977; Currie et al. Reference Currie, Stafford, Sheffield, Klouda, Wise, Fletcher, Donahue, Jull and Linick1989; Currie Reference Currie2000; Szidat et al. Reference Szidat, Jenk, Synal, Kalberer, Wacker, Hajdas, Kasper-Giebl and Baltensperger2006). In reference to the growth phase of biomass (May to August), we calculated the mean atmospheric F14C using the extended IntCal13 14CO2 concentration of the Northern Hemisphere (Levin and Kromer Reference Levin and Kromer2004; Levin et al. Reference Levin, Kromer and Hammer2013). As trees integrate the atmospheric F14C over their period of growth (Lewis et al. Reference Lewis, Klouda and Ellenson2004), we took a 30-year average prior to the sampling date in order to account for wood-derived combustion residues (F14Cbiomass). PyC from annual biomass (e.g, grasses) constitute an additional BPCAs source, thus we also considered the atmospheric 14C abundance at the year of sampling (F14Ccontemporary) (Xu et al. Reference Xu, Zheng, Ding, Edgerton and Reddy2012). Uncertainties include individual 14C data as well as standard deviations from average atmospheric F14C values. Results of the NIST 1941b (marine sediment) yield a ƒfossil of 82.9±2.8% for F14Cbiomass and 80.4±3.2% for F14Ccontemporary. For comparison, Reddy et al. (Reference Reddy, Pearson, Xu, McNichol, Benner, Wise, Klouda, Currie and Eglinton2002) applied 14C analysis on residues derived from the thermochemical oxidation (CTO-375) of environmental samples (Gustafsson and Gschwend Reference Gustafsson and Gschwend1997; Gustafsson et al. Reference Gustafsson, Bucheli, Kukulska, Andersson, Largeau, Rouzaud, Reddy and Eglinton2001) and found about 98.5–98.8% ƒfossil for the predecessor NIST 1941a. BPCA 14C analysis of NIST 1649a (urban dust) yields ƒfossil 93.4±2.6% for F14Cbiomass and 93.5±2.6% for F14Ccontemporary. Similar values were reported by Reddy et al. (Reference Reddy, Pearson, Xu, McNichol, Benner, Wise, Klouda, Currie and Eglinton2002) for CTO-375 with ƒfossil of 93.5–95.2% and by Currie et al. (Reference Currie2002) for chemical oxidation residues (dichromate method) with ƒfossil 88.7% as well as for thermal optical kinetic (TOK) procedure with ƒfossil 97.4% always referring to F14Ccontemporary. Source apportionment for riverine NOM (2R101N) results in ƒfossil of 8.9±3.0% for F14Cbiomass and 1.9±3.3% for F14Ccontemporary.
Radiocarbon analyses on soils have a great potential for the study of carbon turnover, yet time lags between assimilation and incorporation in soils as well as lateral and vertical spatial heterogeneity can challenge interpretations (Trumbore Reference Trumbore2009; Van der Voort et al. Reference Van der Voort, Hagedorn, McIntyre, Zell, Walthert, Schleppi, Feng and Eglinton2016). We therefore chose not to attempt source apportionment on the chernozem soil due to the absence of sufficient age constraints on charred soil organic matter (Carcaillet Reference Carcaillet2001).
The corrected 14C-BPCA data compare well with the limited available literature data and lend support to the applicability of PyC source apportionment in different complex matrices using this particular method. Analyzed samples range from F14C<0.1 to F14C≥1. Environmental matrices from locations with a pronounced human (urban, industrial) influence contain combustion products of mainly fossil origin. In contrast, the Suwannee river catchment drains swamp areas with a high fire return frequency and thus yields modern 14C signatures. The two different proportions calculated for atmospheric 14C concentrations (F14Cbiomass and F14Ccontemporary) influence the fractional contribution of fossil carbon only to a less extent during this period of waning thermo-nuclear (“bomb”) 14C concentrations.
Implications for Dating and Source Apportionment
Molecular 14C data on pyrogenic carbon provides an important window on the origin and dynamics of this important component of the global carbon cycle. By combining (1) comprehensive characterization and quantification of contamination associated with sample processing for small-scale 14C analysis, (2) assessments of reproducibility through triplicate analyses of samples, a new level of confidence in CSRA has been achieved. Adopting the constant contamination approach to account for contamination associated with analysis of reference materials led to lower BPCAs F14C values, with calculated fossil carbon contributions of 10.1, 30.2, 6.9% for marine sediment, urban dust and riverine NOM, respectively. As such, these carefully corrected molecular 14C data provide a robust benchmark against which to place quantitative constraints on PyC sources and cycling in the environment. The large differences between the 14C-BPCAuncorrected and 14C-BPCAcorrected (Table 2) clearly highlight the uncertainty that contamination can introduce with respect to PyC source apportionment. Even though the extent to which contamination affects the result is mass dependent, an accurate F14C signature of the contaminant is nevertheless required to make the correct adjustment. An interpretation of molecular 14C data of combustion products without a correction for extraneous carbon could lead to either under- or overestimating different pools of PyC in samples. The need for accurate and precise data is particularly high for the validation of numerical models that mimic PyC pools and fluxes in the global environment. Currently, the extrapolation of our results to the global scale is limited by the lack of available quantitative and qualitative data, particularly in sediments (Bird et al. Reference Bird, Wynn, Saiz, Wurster and McBeath2015) as well as by the high uncertainty (often larger than two orders of magnitude) in modeling the global pyrogenic carbon cycle (Landry and Matthews Reference Landry and Matthews2016). Here, the thoroughly corrected empirical 14C data can serve as a reference to better constrain and validate models in future attempts.
In archaeology, visually distinct charcoal particles are commonly picked by hand (e.g., with the aid of an optical microscope) and used for 14C dating. Here, measurement and comprehensive correction of BPCA 14C data opens up the possibility of investigating matrices where charred residues are present as submicroscopic finely disseminated particles that would not be amenable to conventional approaches.
With respect to applications of 14C-BPCA for the purpose of apportioning sources of combustion residues, calculations using the end member model of F14Cdepleted and F14Cmodern reveal that the two different scenarios for modern F14C (contemporary vs. biomass) have a lesser impact (15.2% in sediment, 1.4% in urban dust, 7.6% in riverine NOM) compared to the correction of measured data for extraneous carbon (6.9 to 30.2%, as discussed above). This important observation strengthens the concept of source apportionment based on thoroughly corrected 14C data. In this study, we only used reference materials (surface deposits) collected post-1950s and thus the modern F14C end member should reflect the high atmospheric 14C concentrations during the assimilation of carbon into biomass. This period of time might serve as an extreme case to test this concept of source apportionment and suggests an even lower susceptibility for samples predating this time period. Constraining the actual contemporary F14C of feedstock materials in natural environments may prove challenging but fortunately it appears to be not imperative for the robust apportionment of PyC sources. Instead, differences in source areas (proximal versus distal), mode of transport (e.g, runoff versus atmospheric deposition), predepositional histories (e.g, temporary storage in soils) are likely to result in greater sources of uncertainty in apportioning PyC derived from fossil fuels and biomass.
CONCLUSIONS
Comprehensive quantification and isotopic characterization of extraneous carbon was achieved via use of multiple process standards that encompass each of the four subprocedures applied in BPCA 14C analysis: (1) oxidative degradation of condensed aromatics, (2) BPCA isolation by LCprep, (3) wet chemical oxidation (WCO) of purified BPCAs, and (4) the subsequent measurement of resulting CO2 using a gas ion source-equipped AMS. Each subprocedure introduced some extraneous carbon, with the highest proportion determined to stem from the WCO step. Despite the significant extraneous carbon associated with this procedure, the ease and rapidity of WCO carries considerable advantages, enabling high-throughput, lower cost processing of standards and samples that ultimately yield more comprehensive BPCAs 14C datasets.
The comprehensive assessment of (and correction for) contamination coupled with triplicate analyses of BPCAs isolated from four standard reference samples encompassing a range of complex environmental matrices yielded robust 14C values that provide new isotopic benchmarks for these reference materials. To fully exploit the potential of CSRA on pyrogenic carbon, particularly with respect to 14C dating applications, the methodological protocol should include process standards, each encompassing end-members in 14C natural abundance and spanning an equivalent concentration range to that of the target analytes. Following such comprehensive assessment of extraneous carbon, BPCAs 14C can serve as a versatile tool for improving our understanding of fate and residence time of combustion products in the environment.
ACKNOWLEDGMENTS
We thank Simon Fahrni (Ionplus AG, Switzerland) for his kind on-call help with the AMS outside regular work hours. Michael Hilf and Guido Wiesenberg (University of Zurich, UZH, Switzerland) kept the preparative LC in good repair. We acknowledge Philippa Ascough and Michael Bird for providing us the archeological 14C-depleted charcoal (MA), we appreciate the many helpful discussions on preparative chromatography with Daniel Montluçon (ETH Zürich, Switzerland) and Daniel Wiedemeier (UZH).
SUPPLEMENTARY MATERIAL
To view supplementary material for this article, please visit https://doi.org/10.1017/RDC.2017.44


