


Preface
The following set of articles describe in detail the science goals of the future Space Infrared telescope for Cosmology and Astrophysics (SPICA). The SPICA satellite will employ a 2.5-m telescope, actively cooled to below 8 K, and a suite of mid- to far-infrared spectrometers and photometric cameras, equipped with state-of-the-art detectors. In particular, the SPICA Far Infrared Instrument (SAFARI) will be a grating spectrograph with low (R = 300) and medium (R = 3 000–11 000) resolution observing modes instantaneously covering the 35–230 μm wavelength range. The SPICA Mid-Infrared Instrument (SMI) will have three operating modes: a large field-of-view (12 arcmin × 10 arcmin) low-resolution 17–36 μm spectroscopic (R = 50–120) and photometric camera at 34 μm, a medium-resolution (R = 2 000) grating spectrometer covering wavelengths of 18–36 μm, and a high-resolution echelle module (R = 28 000) for the 12–18 μm domain. A large field-of-view (160 arcsec × 160 arcsec)Footnote a , three-channel (110, 220, and 350 μm) polarimetric camera (POL) will also be part of the instrument complement. These articles will focus on some of the major scientific questions that the SPICA mission aims to address; more details about the mission and instruments can be found in Roelfsema et al. (Reference Roelfsema2018).
1. Introduction
Through a series of multi-wavelength observations from the UV to radio over the last few decades, it has been shown that the ‘observed’ UV star-formation rate density (SFRD, without any dust-extinction correction) is an order of magnitude smaller than that in the infrared at 0 < z < 2 (e.g., Madau & Dickinson Reference Madau and Dickinson2014). This indicates that in the redshift range where robust measurements of the far-infrared luminosity density exist, most of cosmic star formation took place in dusty/dust-obscured environments, which absorb UV light from young stars and reradiate in the infrared. Although this is not necessarily a surprise if we consider that stars form in dusty molecular clouds locally, it suggests the likelihood that optical/near-infrared observations may miss a significant fraction of galaxies at high redshift due to dust extinction.
A case in point is Hubble Deep Field (HDF) 850.1, the brightest submillimetre source discovered in the very first deep 850-μm map of the sky, taken over the HDF North (HDF-N) with Submillimeter Common-User Bolometer Array (SCUBA) on James Clark Maxwell Telescope (Hughes et al. Reference Hughes1998). Despite its brightness (7 mJy at 850 μm), it took 14 yr to localise this source and determine its redshift, which turned out to be z = 5.18 based on the CO and [C ii] line detections (Walter et al. Reference Walter2012). This is because its counterpart is not seen in the deep Hubble Space Telescope optical and near-infrared images. At z > 5, even near-infrared observations are sampling the rest-frame UV light and are therefore susceptible to dust extinction. Such optical and near-infrared dropout sources have also been discovered with deep Spitzer/IRAC survey data, indicating the presence of a substantial population of massive dusty star-forming galaxies (DSFGs) at z > 3 (e.g.,Wang et al. Reference Wang2016).
Note that the star-formation rate (SFR) of HDF 850.1 is quite large, 850 M⊙ yr−1, as derived from the total infrared luminosity (L IR) of 8.7 × 10¹² L⊙ (conventionally defined as the integrated luminosity over 8–1 000 μm; see Sanders & Mirabel Reference Sanders and Mirabel1996), which qualifies this source as an ultra-luminous infrared galaxy (ULIRG: L IR = 1012 − 1013 L⊙). This clearly illustrates that even such an intrinsically luminous galaxy could be completely missed by optical/near-infrared observations due to dust extinction. Note, however, that not all z > 5 infrared-luminous galaxiesFootnote b are so optically faint. For example, AzTEC-3 at z = 5.30, the first submillimetre galaxy (SMG) that has been identified at z > 5 (Riechers et al. Reference Riechers2010; Capak et al. Reference Capak2011) has a counterpart with i ∼ 26 mag, whose optical spectrum shows a Lyα emission line as well as a rest-frame UV continuum with metal absorption lines. This suggests that in some high-redshift infrared-luminous galaxies, UV-bright star-forming regions coexist with those that are heavily dust-obscured.
Recent Atacama large millimeter/submillimeter array (ALMA) observations have further reinforced the view that the infrared-luminous galaxy population plays an important role in the cosmic history. For example, ALMA 1.3-mm imaging of the Hubble Ultra Deep Field (HUDF) has indicated that about 85% of the total star formation at z ⋍ 2 is enshrouded in dust, about 65% of which is occurring in high-mass galaxies with an average obscured to unobscured star formation ratio of 200 (Dunlop et al. Reference Dunlop2017). A subsequent analysis of these HUDF ALMA sources as well as those detected in a wider GOODS-S area (26 arcmin2) has shown a surprisingly large X-ray active galactic nuclei (AGN) fraction (Ueda et al. Reference Ueda2018), suggesting a possible connection between the dusty phase of massive galaxy evolution and growth of super-massive black holes (SMBHs). On the high-redshift front, ALMA has started to discover z > 8 galaxies through the detection of the [O III] 88- μm line, such as MACS0416-Y1 at z = 8.31 (Tamura et al. Reference Tamura2018), A2744-YD at z = 8.38 (Laporte et al. Reference Laporte2017), and MACS1149-JD1 at z = 9.11 (Hashimoto et al. Reference Hashimoto2018b), and surprisingly the first two galaxies were also detected in dust continuum with corresponding infrared luminosities of 1–2 × 10¹¹ L⊙. ALMA dust-continuum detections also exist for a few z = 7–8 galaxies, such as B14-65666 at z = 7.15 (Hashimoto et al. Reference Hashimoto2018a) and A1689-zD1 at z = 7.5 (Knudsen et al. Reference Knudsen, Watson, Frayer, Christensen, Gallazzi, Michałowski, Richard and Zavala2017), with corresponding infrared luminosities of 2–6 × 10¹¹ L⊙. These recent discoveries confirm the existence of dusty, infrared-luminous (> 1011 L⊙) galaxies well inside the epoch of reionisation, only about half a billion years after the Big Bang. These recent exciting developments clearly indicate the importance of probing the high-redshift Universe in the infrared, which will allow us to obtain the full picture of the earliest phases of galaxy evolution by mitigating the effects of dust extinction/obscuration.
SPICA is a proposed European Space Agency (ESA) M5 mission, whose main scientific goal is to explore the dusty/dust-obscured Universe, both near and far, by conducting sensitive imaging and spectroscopic observations in the mid-/far-infrared (Roelfsema et al. Reference Roelfsema2018). SPICA is expected to revolutionise a wide spectrum of research areas in astronomy/astrophysics, and it will be especially powerful for probing the dusty/dust-obscured Universe at high redshift through spectroscopy. On the extragalactic side, a key goal of the SPICA mission is to conduct large spectroscopic surveys of galaxies at z = 1–4 and characterise their physical properties through the analysis of spectral features in the mid-/far-infrared. For example, a 2 000-h SAFARI survey will obtain low-resolution (LR; R = 300) spectra for over 1 000 galaxies up to z ⋍ 4 (Spinoglio et al. Reference Spinoglio2017) while a 600-h SMI survey will identify about 50 000 galaxies in a 10 deg2 area through R = 50–120 spectroscopy of polycyclic aromatic hydrocarbon (PAH) emission features (Kaneda et al. Reference Kaneda2017). Such data sets will enormously advance our understanding of galaxy/AGN evolution and will shed light on key science topics such as chemical evolution/metal enrichment (Fernández-Ontiveros et al. Reference Fernández-Ontiveros2017) and molecular outflows/inflows (González-Alfonso et al. Reference González-Alfonso2017). Note that the great power of SPICA mainly resides in such spectroscopic observations, especially in the far-infrared (>100 μm), where Herschel/Spectral and Photometric Imaging Receiver (SPIRE) has already achieved confusion-limited broad-band imaging sensitivities with a 3.5-m telescope. Another area of SPICA’s strength is its ability to conduct deep and wide imaging surveys with the SMI’s slit-viewer camera at 34 μm, where the confusion limit will be significantly lower (Gruppioni et al. Reference Gruppioni2017).
The goal of this paper is to examine SPICA’s potential for extending infrared spectroscopic studies toward the epoch of reionisation and beyond. More specifically, we will assess SAFARI’s ability to obtain high-quality galaxy spectra (similar to those obtained by Spitzer/IRS at lower redshift) in a redshift range of z = 5–10. A redshift of 5 defines a natural boundary for SAFARI because at z > 5 the 6.2 μm PAH feature is redshifted into the SAFARI band, making SAFARI data sets self-sufficient for a variety of mid-infrared spectral analyses. In the current design, SAFARI will deliver LR (R = 300) spectra covering 35–230 μm with a line-flux sensitivity of around 5 × 10⁻²⁰ W m−2 (5σ, 1 h). Based on this sensitivity estimate and recent discoveries of infrared-luminous galaxies/quasars at z > 5, we will examine the detectability of various types of galaxies by simulating their SAFARI spectra and will discuss the scientific potential of such observations (Section 2). In addition, we will extend our discussion to a few exploratory science programs that are significantly more challenging but have the potential to open up a new frontier in the study of the early Universe (Section 3). In the final section (Section 4), we will review a variety of existing and future wide-field data, which can be used to select SAFARI targets effectively.
Throughout the paper, we assume a ΛCDM cosmology with H 0 = 70 km s−1 Mpc−1, Ωm = 0.3, and ΩΛ = 0.7.
2. Probing the z > 5 Universe
As has been demonstrated by the large body of work with ISO and Spitzer, as reviewed by Genzel & Cesarsky (Reference Genzel and Cesarsky2000) and Soifer, Helou, & Werner (Reference Soifer, Helou and Werner2008), respectively, the rest-frame mid-infrared spectral range is extremely rich in diagnostic information, with a variety of atomic fine-structure lines, molecular hydrogen (H2) lines, PAH features, and silicate emission/absorption features [e.g., see Genzel et al. (Reference Genzel1998) for ISO and Armus et al. (Reference Armus2007) for Spitzer results, as well as the companion papers by Spinoglio et al. (Reference Spinoglio2017) and Van der Tak et al. (Reference Van der Tak2018)]. Some galaxies are so embedded in dust that rest-frame mid-infrared spectroscopy is crucial for identifying the dominant luminosity source (whether star formation or AGN). Without such spectral information, it is impossible to fully capture the landscape of the dust-obscured Universe at high redshift. Although ALMA and James Webb Space Telescope (JWST) will undoubtedly make great progress in the near future, they will leave the 30–300 μm spectral range unexplored, that is, the rest-frame mid-infrared at z = 5–10, requiring an infrared space mission like SPICA to fill this information-rich gap.
2.1. Dusty star-forming galaxies
One recent crucial development, which has opened up SPICA’s potential to probe the z > 5 Universe, was a series of discoveries finding that a significant fraction of the brightest submillimetre/millimetre sources in a random blank sky field corresponds to gravitationally lensed infrared-luminous galaxies at high redshift (except for nearby galaxies and bright AGN). The discovery of the Cosmic Eyelash galaxy at z = 2.3 (Swinbank et al. Reference Swinbank2010), which was the first of such super-bright (S 870 > 100 mJy)Footnote c lensed infrared-luminous galaxies to be found, allowed a variety of multi-wavelength observations even with those observing facilities that normally do not have the sensitivity to probe beyond the low-redshift Universe.
Although this first discovery was serendipitous, wide-field surveys with Herschel, South Pole Telescope (SPT), Atacama Cosmology Telescope (ACT), and Planck quickly followed with more discoveries of similarly bright infrared-luminous galaxies (e.g., Negrello et al. Reference Negrello2010; Combes et al. Reference Combes2012; Vieira et al. Reference Vieira2013; Weiß et al. Reference Weiß2013; Marsden et al. Reference Marsden2014; Cañameras et al. Reference Cañameras2015; Harrington et al. Reference Harrington2016), a small number of which have turned out to be at z > 5. Due to lensing, these z > 5 galaxies are all substantially brighter than HDF 850.1 and AzTEC-3, so their redshifts were easily measured by blind CO searches. At the time of writing, the discoveries of ten such lensed infrared-luminous galaxies have been reported at z > 5 (Table 1; SPT0311-58 W and SPT0311-58 E are counted as one), with the highest-redshift galaxy at z = 6.90 (Strandet et al. Reference Strandet2017; Marrone et al. Reference Marrone2018). Even when corrected for lensing magnification (μ), many of these objects are hyper-luminous infrared galaxies (HyLIRGs; L IR > 1013 L⊙) but without any sign of a strong AGN, leading to their classification as DSFGs (Casey et al. Reference Casey, Narayanan and Cooray2014). Note that non-lensed z > 5 galaxies that are significantly more luminous than HDF 850.1 and AzTEC-3 are also being discovered (Table 1). With a variety of wide-field surveys being conducted/planned (see Section 4), the list of such HyLIRGs at z = 5–10, whether gravitationally lensed or intrinsically luminous, will grow rapidly over the coming years, providing excellent targets for SAFARI.
Table 1. Currently known infrared-luminous galaxies (μ L IR ≳ 1013 L⊙) at z > 5 (non-quasars)
a Infrared luminosity L IR (8–1 000 μm) without a lensing correction.
b Magnification factor.
c At 869 μm with ALMA.
d At 880 μm with SMA.
e At 850 μm with SCUBA-2.
f At 920 μm with CSO/MUSIC.
g At 890 μm with SMA.
h J. Spilker 2018, private communication.
i L IR (42–500 μm).
References: (1) Strandet et al. (Reference Strandet2017); (2) Marrone et al. (Reference Marrone2018); (3) Riechers et al. (Reference Riechers2013); (4) Cooray et al. (Reference Cooray2014); (5) Zavala et al. (Reference Zavala2018); (6) Strandet et al. (Reference Strandet2016); (7) Spilker et al. (Reference Spilker2016); (8) Vieira et al. (Reference Vieira2013); (9) Weiß et al. (Reference Weiß2013); (10) Gullberg et al. (Reference Gullberg2015); (11) Aravena et al. (Reference Aravena2016); (12) Ma et al. (Reference Ma2015); (13) Ma et al. (Reference Ma2016); (14) Combes et al. (Reference Combes2012); (15) Rawle et al. (Reference Rawle2014); (16) Asboth et al. (Reference Asboth2016); (17) Pavesi et al. (Reference Pavesi2018); (18) Riechers et al. (Reference Riechers2017); (19) Younger et al. (Reference Younger2007); (20) Smolčić et al. (Reference Smolčić2015); (21) Walter et al. (Reference Walter2012).
To illustrate the power of SAFARI, we show in Figure 1 the simulated SAFARI spectra of two gravitationally lensed infrared-luminous galaxies from Table 1, HLSJ0918 at z = 5.24 (Combes et al. Reference Combes2012; Rawle et al. Reference Rawle2014) and HFLS3 at z = 6.34 (Riechers et al. Reference Riechers2013; Cooray et al. Reference Cooray2014). These galaxies were discovered as Herschel sources showing red colours in the three SPIRE bands (S 250 < S 350 < S 500), a technique that has proved to be effective for finding z > 4 DSFGs (e.g., Dowell et al. Reference Dowell2014). The figure clearly shows that SAFARI is capable of detecting main spectral features in the rest-frame mid-infrared at these redshifts if the infrared luminosities of target galaxies are > 1013 L⊙. If the PAH features and fine-structure lines in these galaxies are as strong as those seen at lower redshift, SAFARI will be able to detect them clearly, and the measured PAH strengths can be used to estimate SFRs. Compared to other SFR indicators, PAH features have the advantage of being less vulnerable to dust extinction (e.g., compared to Hα) and being more luminous (e.g., compared to [Ne ii] 12.8 μm).
Figure 1. Simulated SAFARI spectra of HLSJ0918 (z = 5.24, μ = 9: Combes et al. Reference Combes2012; Rawle et al. Reference Rawle2014) and HFLS3 (z = 6.34, μ = 2: Riechers et al. Reference Riechers2013; Cooray et al. Reference Cooray2014) are shown in the left and right panels, respectively. The average local galaxy SED templates (Rieke et al. Reference Rieke, Alonso-Herrero, Weiner, Pérez-González, Blaylock, Donley and Marcillac2009) of L IR = 1011.75 and 1012.50 L⊙ were used, respectively, which produce good fits to the observed rest-frame far-infrared SEDs of these galaxies. The template SEDs were first scaled to the infrared luminosities without a lensing correction (μ L IR in each panel) and then fit with PAHFIT (Smith et al. Reference Smith2007) with a pixel sampling of R = 600. These PAHFIT-produced model spectra were then redshifted and noise-added for corresponding integration times (T int in each panel). Finally, the resultant spectra were resampled with R = 300 pixels. However, the effective resolution of these simulated spectra is less than R = 300 due to the low resolution (R ≈ 60–130) of the Spitzer/IRS data used by Rieke et al. (Reference Rieke, Alonso-Herrero, Weiner, Pérez-González, Blaylock, Donley and Marcillac2009) to build templates. Note that the actual mid-infrared spectra of these z > 5 galaxies may significantly differ from those of local LIRGs/ULIRGs (see Section 2.4 for more discussion).
PAH equivalent widths are also a powerful diagnostic for assessing the AGN contribution to the rest-frame mid-infrared continuum emission (e.g., Pope et al. Reference Pope2008; Riechers et al. Reference Riechers2014). Considering that many of the lensed infrared-luminous galaxies listed in Table 1 are HyLIRGs even intrinsically (i.e., when corrected for the lensing magnification), it is important to examine if they harbour luminous AGN and therefore exhibit smaller PAH equivalent widths. For the detection of AGN, especially those heavily obscured by dust, the rest-frame mid-infrared range is optimal as the AGN contribution becomes most conspicuous there. Other mid-infrared spectral features that can be used to detect the presence of AGN are high excitation lines such as [Ne V] 14.3/24.3 μm and [O IV] 25.9 μm, which can be used to estimate the AGN contribution and black hole accretion rates (e.g., Spinoglio et al. Reference Spinoglio2017).
Other prominent mid-infrared spectral features include atomic fine-structure lines such as [Ne ii]/[Ne iii] 12.8/15.6 μm and molecular hydrogen (H2) lines such as 0–0 S(1)/0–0 S(3) 17.0/9.66 μm (some of these lines are not seen in Figure 1 because of their faintness and the low resolution of the template spectra). The [Ne ii]/[Ne iii] lines, for example, will serve as excellent indicators of SFRs and the hardness of ionising radiation (e.g., Thornley et al. Reference Thornley, Schreiber, Lutz, Genzel, Spoon, Kunze and Sternberg2000; Ho & Keto Reference Ho and Keto2007), while H2 lines allow us to measure the temperature and mass of warm (T ≳ 100 K) molecular hydrogen gas directly (e.g., Rigopoulou et al. Reference Rigopoulou, Kunze, Lutz, Genzel and Moorwood2002; Higdon et al. Reference Higdon, Armus, Higdon, Soifer and Spoon2006).
Note that high-redshift HyLIRGs are likely more luminous in the rest-frame mid-infrared than the local ones, which will help SAFARI detections of submillimetre/millimetre-selected DSFGs like those listed in Table 1. This is because at z ≳ 1, many star-forming HyLIRGs/ULIRGs are spatially extended over kpc scales, exhibiting flatter and colder infrared spectral energy distributions (SEDs) that are more similar to those of local LIRGs [L IR = 1011 − 1012 L⊙; see Rujopakarn et al. (Reference Rujopakarn, Rieke, Weiner, Pérez-González, Rex, Walth and Kartaltepe2013) and references therein]. Indeed, the Herschel-observed far-infrared SEDs of HLSJ0918 and HFLS3 take shapes consistent with those of galaxies with much lower infrared luminosities (see the caption of Figure 1), supporting the validity of such an assumption.
2.2. UV-bright star-forming galaxies
At z ≳ 5, the majority of galaxies have been selected through robust optical (broad-band/narrow-band) colour selections and identified either as Lyman break galaxies (LBGs) or Lyman-alpha emitters (LAEs). LBGs and LAEs are inherently UV-bright star-forming galaxies because they are selected through the detections of the Lyman break at 912 Å and/or Lyα break/emission at 1 216 Å. Unlike DSFGs discussed above, which can be extremely faint in the rest-frame UV (e.g., HDF 850.1), LBGs/LAEs are less dust-obscured as populations, especially at z ≳ 5 where many of LBGs/LAEs are seen to exhibit extremely blue UV continuum slopes (e.g., Bouwens et al. Reference Bouwens2012; Dunlop et al. Reference Dunlop, McLure, Robertson, Ellis, Stark, Cirasuolo and de Ravel2012; Finkelstein et al. Reference Finkelstein2012; Jiang et al. Reference Jiang2013).
At z ∼ 3, Spitzer/IRS spectra exist for a small number of bright gravitationally lensed LBGs, such as MS1512-cB58 at z = 2.73 (Siana et al. Reference Siana, Teplitz, Chary, Colbert and Frayer2008) and the Cosmic Eye at z = 3.07 (Siana et al. Reference Siana2009), giving a glimpse of what the mid-infrared spectra of UV-selected star-forming galaxies look like. The mid-infrared spectra of these particular LBGs are similar to those of typical infrared-luminous galaxies like those in Figure 1, showing strong PAH features and resembling those of infrared-selected lensed galaxies at comparable redshift (Rigby et al. Reference Rigby2008). This is probably not surprising, considering that these LBGs are LIRGs in terms of their infrared luminosities and therefore are probably among the more infrared-luminous members of the LBG population. In fact, a significant fraction of z ⋍ 3 LBGs are thought to be infrared-luminous despite their rest-frame UV selection (e.g., Coppin et al. Reference Coppin2015; Koprowski et al. Reference Koprowski2016). A recent Herschel stacking analysis of about 22 000 z ⋍ 3 LBGs indicates that these galaxies are LIRGs on average (Álvarez-Márquez et al. Reference Álvarez-Márquez2016). It has also been shown that some of the z ⋍ 3 LBGs are even ULIRGs (e.g., Oteo et al. Reference Oteo2013; Magdis et al. Reference Magdis2017). Even at z ⋍ 7, bright LBGs are thought to be LIRGs on average (Bowler et al. Reference Bowler, Bourne, Dunlop, McLure and McLeod2018).
Because of the simple colour selection criteria, LBGs are known to constitute a heterogeneous sample of galaxies with a wide spectrum of physical properties, from dusty infrared-luminous galaxies to luminous LAEs with little dust extinction. One exciting prospect for SAFARI is that it will be able to detect the latter population (which likely dominates in number), making it possible to study both populations in a uniform way, using the same set of mid-infrared diagnostics.
In this context, particularly interesting are low-mass, low-metallicity, unreddened galaxies with strong emission lines at z ∼ 2, which may be better analogues of z ≳ 5 galaxies (e.g., Erb et al. Reference Erb, Pettini, Shapley, Steidel, Law and Reddy2010; Stark et al. Reference Stark2014). These galaxies may be similar to low-metallicity blue compact dwarfs (BCDs) in the local Universe (e.g., Watson et al. Reference Watson2011), and if so, their mid-infrared spectra are likely distinctly different from those of typical infrared-luminous galaxies shown in Figure 1. We will discuss the mid-infrared spectra of these local BCDs in Section 2.4.
2.3. Quasars/AGN
Compared to star-forming galaxies, quasars have much flatter infrared SEDs because of the power-law continuum produced by the central AGN. As a result, they are significantly brighter in the rest-frame mid-infrared and are easier to observe with SAFARI. Figure 2 shows the 100-μm flux-density distribution of 27 z > 5 Type-1 quasars (up to z = 6.4) based on the Herschel/Photodetector Array Camera and Spectrometer (PACS) photometry reported by Leipski et al. (Reference Leipski2014). Note that the PACS 100-μm band directly measures the source brightness in the wavelength range that SAFARI will cover. The measured 100-μm flux densities range from 2 to 12 mJy, indicating that SAFARI, with a 5σ continuum sensitivity of 0.7 mJy in 1 h, will be able to obtain high-quality spectra for these quasars quickly.
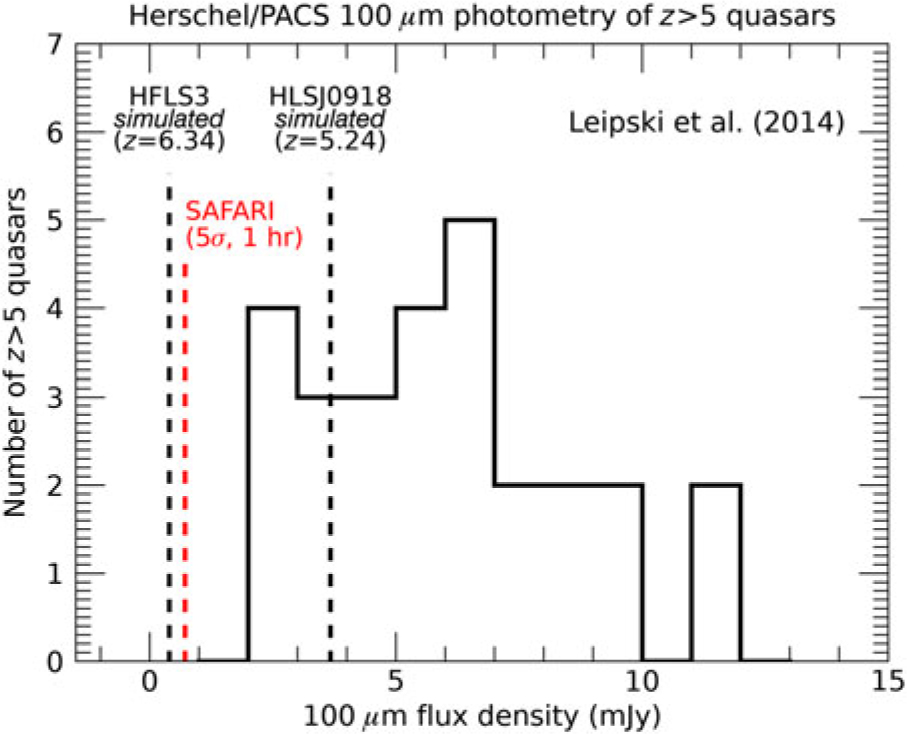
Figure 2. Herschel/PACS 100-μm photometry of 27 z = 5–6.4 Type-1 quasars reported by Leipski et al. (Reference Leipski2014). In comparison, the simulated 100- μm flux densities of HLSJ0918 and HFLS3 (see Figure 1) are also shown, as well as the sensitivity of SAFARI LR-mode (0.7 mJy at 100 μm, 5σ in 1 h). These z > 5 quasars are bright enough to be observable with SAFARI in under an hour (each), providing details about the dust composition and distribution of dust around their nuclei.
Mid-infrared spectra of low-redshift Type-1 AGN are often characterised by a power-law continuum, silicate emission/absorption features, and PAH emission features (e.g., Siebenmorgen et al. Reference Siebenmorgen, Haas, Krügel and Schulz2005; Hao et al. Reference Hao2005; Shi et al. Reference Shi2006, Reference Shi2007, Reference Shi, Rieke, Ogle, Jiang and Diamond-Stanic2009, Reference Shi, Rieke, Ogle, Su and Balog2014). The power-law continuum seen in the rest-frame mid-infrared is thought to be produced by the dusty torus around the central AGN (e.g., Leipski et al. Reference Leipski2014), allowing us to study the properties and geometry of the circumnuclear material. For example, the strengths of silicate emission/absorption features (at 9.7 and 18 μm) are thought to correlate (at least in the first order) with the orientation of the dusty torus (i.e., edge-on → absorption; face-on → emission) and can be used to infer the structure of the torus in the framework of unification models (e.g., Shi et al. Reference Shi2006). At z ≳ 6, some quasars are found to be deficient in hot dust, suggesting that their dusty tori are not fully developed or are even absent (Jiang et al. Reference Jiang2010; Leipski et al. Reference Leipski2014). SAFARI spectroscopy of z > 5 quasars therefore offers the possibility to investigate, through observations and modelling, the physical conditions and formation/evolution processes of AGN dusty tori.
Since the z > 5 quasars plotted in Figure 2 are so bright, the quality of SAFARI spectra will be high enough to examine the composition of dust grains. For example, using the Spitzer/IRS data for 93 AGN at z ≲ 0.5 that exhibit the 9.7 and 18 μm silicate emission features, Xie, Li, & Hao (Reference Xie, Li and Hao2017) have determined that 60 of these AGN spectra can be well reproduced by ‘astronomical silicates’, while 31 sources favour amorphous olivine (Mg1.2Fe0.8SiO4) and two sources favour amorphous pyroxene (Mg0.3Fe0.7SiO3). They also concluded that all sources require micron-sized dust grains, which are significantly larger than the submicron-sized dust grains found in the Galactic ISM. By measuring the central wavelength, width, and relative intensity of the two silicate features, SAFARI will allow us to infer the chemical composition and grain properties of the circumnuclear dust around AGN at z > 5 (see the companion paper by Fernandez-Ontiveros et al. (Reference Fernández-Ontiveros2017) for a further discussion of quasar mid-infrared spectra).
The PAH emission features, on the other hand, reveal star-forming activities in the quasar host galaxies (e.g., Shi et al. Reference Shi2007, Reference Shi, Rieke, Ogle, Jiang and Diamond-Stanic2009). Among the sample of Leipski et al. (Reference Leipski2014), there are seven z > 5 Type-1 quasars that have been detected at 500 μm. Although a significant fraction of z > 5 quasar far-infrared luminosities are thought to be produced by AGN [estimated to be 30–70% by Schneider et al. (Reference Schneider, Bianchi, Valiante, Risaliti and Salvadori2015) and Lyu, Rieke, & Alberts (Reference Lyu, Rieke and Alberts2016)], the infrared luminosities powered by star formation could still be larger than 1013 L⊙ (Leipski et al. Reference Leipski2014). Such infrared luminosities are comparable to that of HLFS3 (z = 6.34) shown in Figure 1, suggesting that SAFARI will likely detect PAH emission features in many of these seven z > 5 quasars superposed on the power-law AGN continuum. Quasars with vigorously star-forming hosts may also allow us to examine the interplay between AGN and star formation at these early epochs.
2.4. Galaxies in the epoch of reionisation
As shown in Figure 1, SAFARI will be able to deliver good-quality rest-frame mid-infrared spectra for HyLIRGs at least up to z ∼ 6. The next question, therefore, is how much farther we can push SAFARI in redshift. The answer to this question depends on whether or not there exist HyLIRGs at z > 6 that are sufficiently massive and luminous to be detectable with SAFARI. Note that such high-redshift HyLIRGs are not explicitly included in some models of infrared-luminous galaxy evolution. For example, the model by Béthermin et al. (Reference Béthermin2017), one of the most advanced and up-to-date, applies a sharp SFR limit of < 1 000 M⊙ yr−1, excluding HyLIRGs like those listed in Table 1.
In this respect, the discoveries of HFLS3 at z = 6.34 (Riechers et al. Reference Riechers2013) and SPT0311-58 at z = 6.9 (Strandet et al. Reference Strandet2017; Marrone et al. Reference Marrone2018) are encouraging. The halo masses (M h) of these high-redshift DSFGs have been estimated to be ≳ 1012 M⊙ (Marrone et al. Reference Marrone2018), and therefore their existence provides a proof that such massive infrared-luminous galaxies do exist at z ∼ 6–7, possibly marking the rare density peaks that would become present-day galaxy clusters and have a space density of only 10−3 − 10−4 times that of typical z ∼ 6 LBGs (Riechers et al. Reference Riechers2013).
Though rare, the existence of massive and luminous DSFGs is expected in overdense regions at z ∼ 6–7. For example, the simulation by Yajima et al. (Reference Yajima, Shlosman, Romano-Díaz and Nagamine2015) has shown that overdense regions evolve at a substantially accelerated pace at high redshift, being able to produce DSFGs at z ∼ 6 inside a halo with a mass of M h ∼ 1012 M⊙. This simulation, however, failed to reproduce the observed infrared luminosity of HFLS3, falling short by a factor of about 10. One possible explanation is that HFLS3 is experiencing a powerful starburst that boosts the infrared luminosity. The same simulation also predicts the existence of L IR ∼ 6 × 10¹¹ L⊙ galaxies at z ∼ 10, and if their infrared luminosities are similarly enhanced by a strong starburst (i.e., by a factor of about 10), ULIRG-type galaxies may exist in some exceptional overdense regions even at z ∼ 10.
Figure 3 shows simulated 10-h spectra of z = 8 galaxies using the spectra/SEDs of the following three objects:
1. HLSJ0918: The z = 5.24 gravitationally lensed infrared-luminous galaxy shown in Figure 1 (Combes et al. Reference Combes2012; Rawle et al. Reference Rawle2014).
2. Haro 11: Local (D ≈ 90 Mpc) infrared-luminous (L IR≈ 2 × 10¹¹ L⊙) low-metallicity (Z ≈ 1/3 Z⊙) BCD (e.g., Cormier et al. Reference Cormier2012; Lyu et al. Reference Lyu, Rieke and Alberts2016).
3. II Zw 40: Another local (D ≈ 10 Mpc) low-metallicity (Z ≈ 1/5 Z⊙) BCD with a significantly lower infrared luminosity of L IR ≈ 3 × 10⁹ L⊙ (see Consiglio et al. Reference Consiglio, Turner, Beck and Meier2016 and Kepley et al. Reference Kepley, Leroy, Johnson, Sandstrom and Chen2016 for recent ALMA studies and references). II Zw 40 is one of the two H II galaxies (along with I Zw 18) studied by Sargent & Searle (Reference Sargent and Searle1970), which have defined BCDs as a distinct class of galaxies.
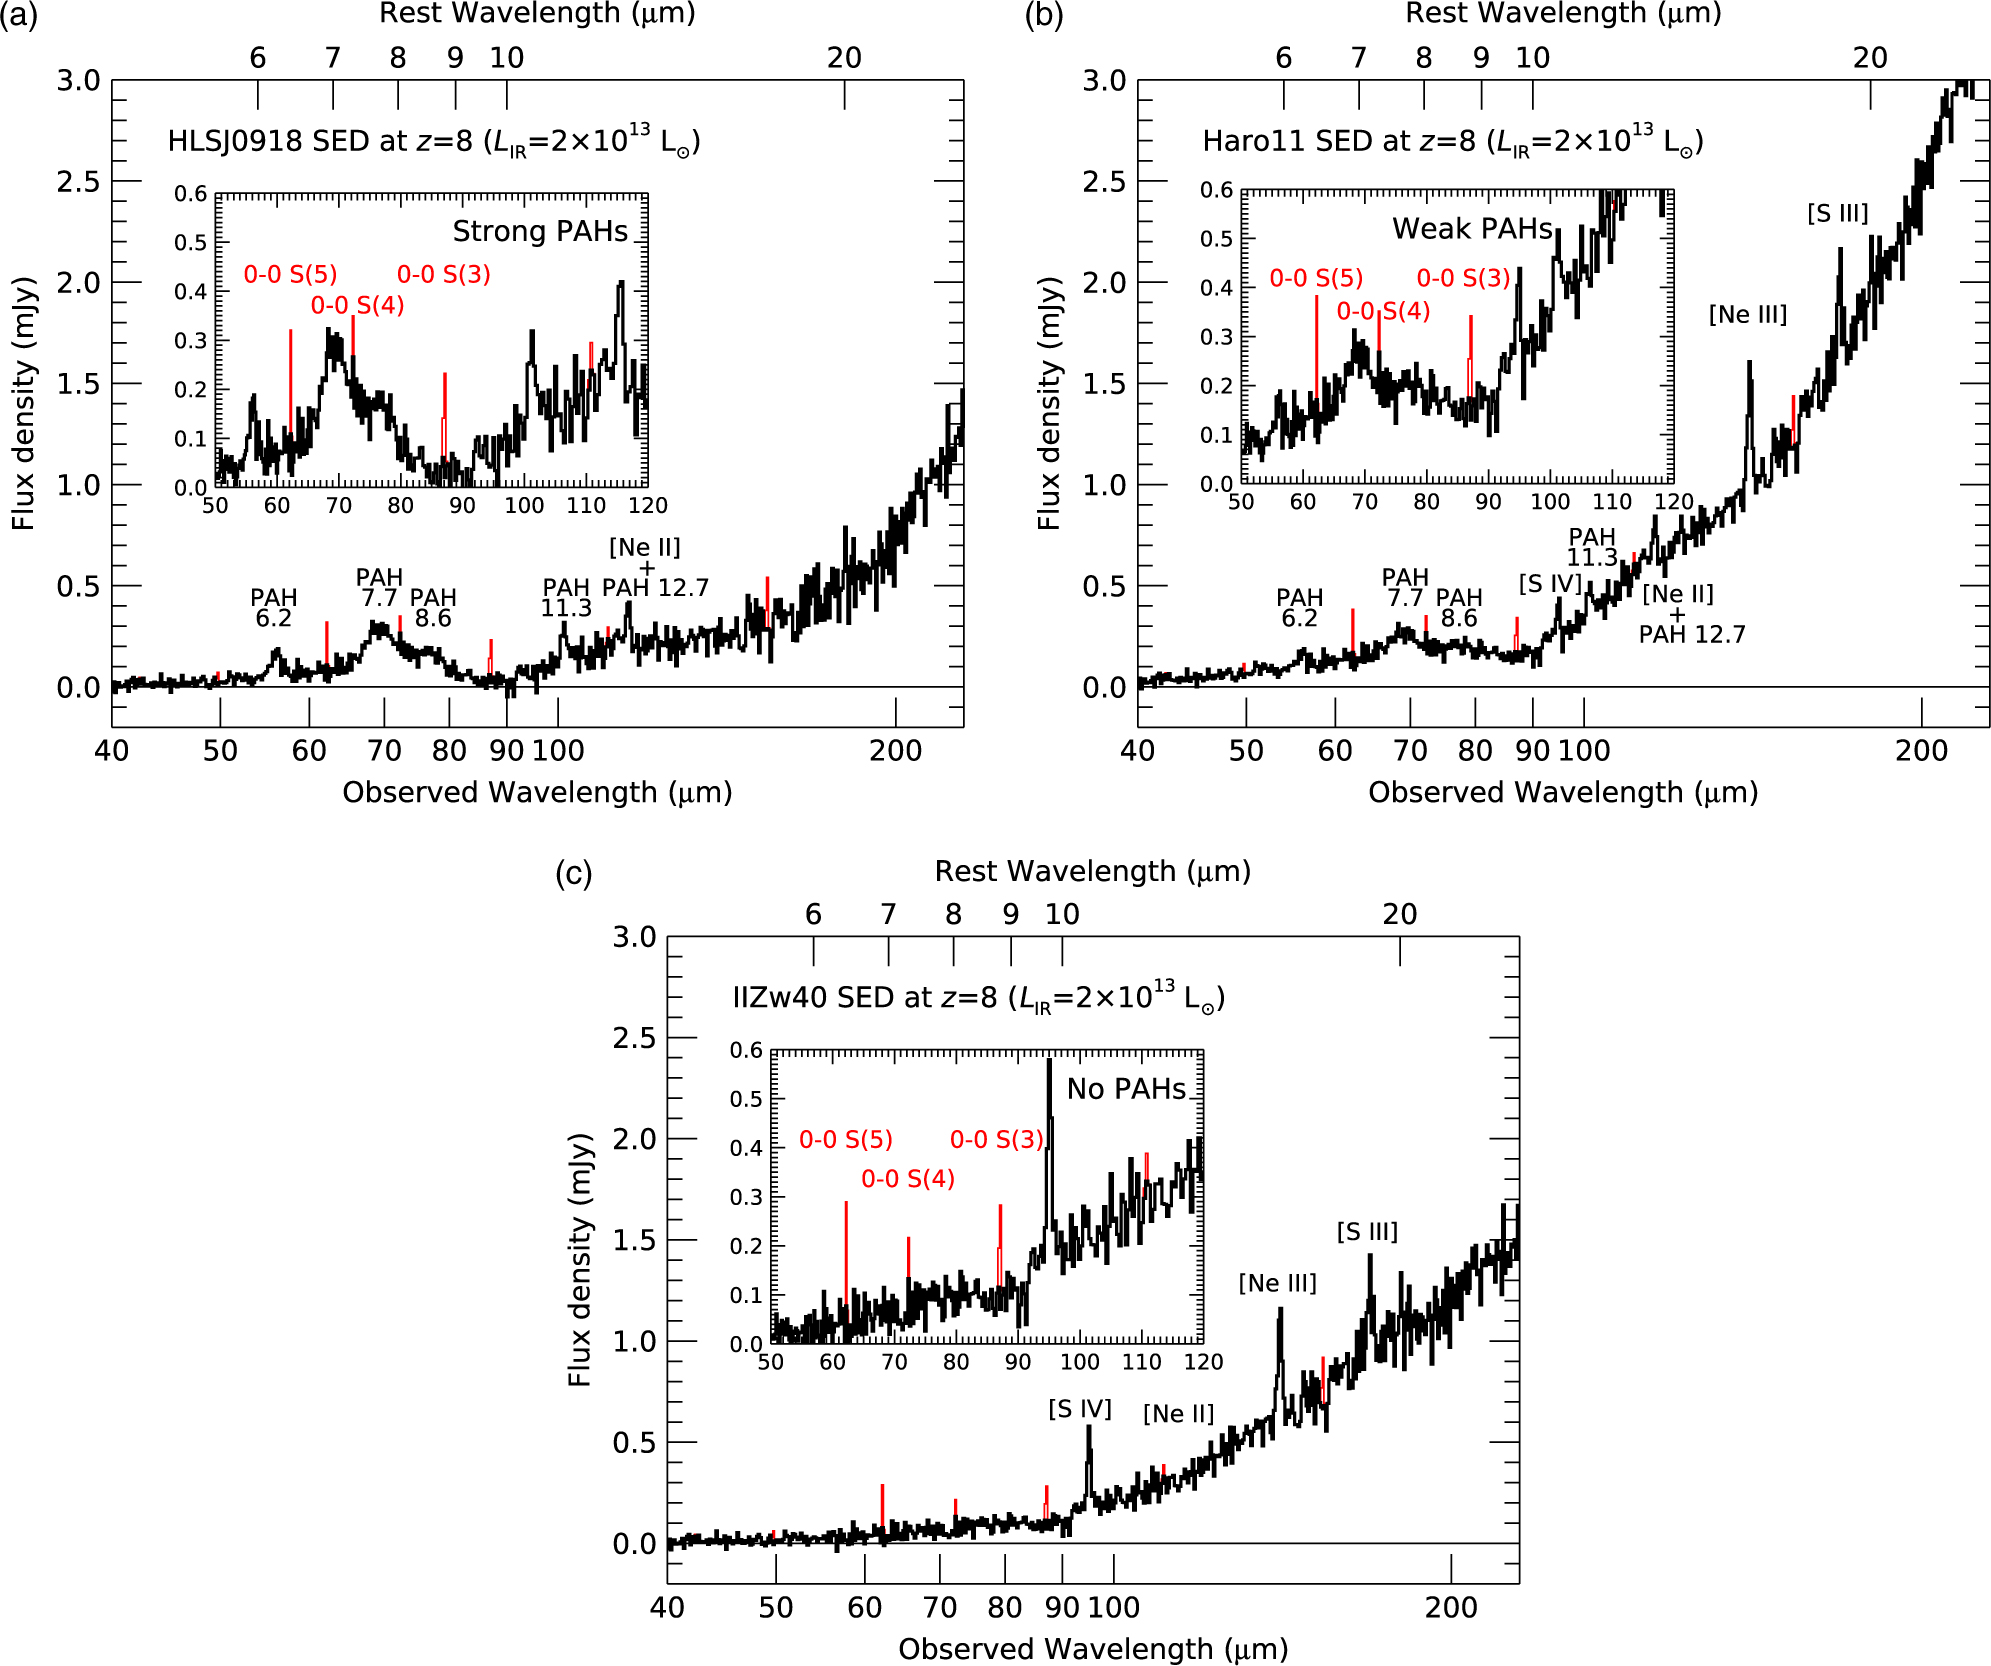
Figure 3. SAFARI 10-h LR (R = 300) spectra for z = 8 galaxies simulated for the following three-types of galaxies: (a) HLSJ0918, a HyLIRG at z = 5.24 (see Figure 1 and Table 1); (b) Haro 11, a low-metallicity infrared-luminous local BCD; and (c) II Zw 40, another low-metallicity local BCD that is not infrared-luminous. For HLSJ0918, the L I R = 1011.75 L⊙ LIRG SED from Rieke et al. (Reference Rieke, Alonso-Herrero, Weiner, Pérez-González, Blaylock, Donley and Marcillac2009) was used as in Figure 1, while for the two BCDs, the fully processed Spitzer/IRS low-resolution spectra were obtained from the Combined Atlas of Sources with Spitzer IRS Spectra (CASSIS; Lebouteiller et al. Reference Lebouteiller, Barry, Spoon, Bernard-Salas, Sloan, Houck and Weedman2011). The infrared luminosities of these SEDs have been scaled to 2 × 10¹³ L⊙, comparable to the intrinsic luminosity of HFLS3. See the caption of Figure 1 for how these SAFARI spectra were simulated. The red lines show simulated H2 emission lines (assumed to be unresolved) produced by 2 × 10¹⁰ M⊙ of T = 200 K gas and 2 × 10⁸ M⊙ of T = 1 000 K gas under the local thermodynamic equilibrium (LTE) assumption (an ortho-to-para ratio of 3:1 is also assumed). These H2 lines are hardly visible in the original galaxy spectra.
The Spitzer/IRS spectra of the two BCDs were analysed by Hunt, Bianchi, & Maiolino (Reference Hunt, Bianchi and Maiolino2005) and Wu et al. (Reference Wu, Charmandaris, Hao, Brandl, Bernard-Salas, Spoon and Houck2006), while their broad-band SEDs (covering from near-infrared to submillimetre) were presented by Rémy-Ruyer et al. (Reference Rémy-Ruyer2015). As already mentioned in Section 2.2, these local BCDs are often thought to be good analogues of high-redshift low-metallicity galaxies (although the metallicities of actual z = 8 galaxies are likely even lower). The spectra of these BCDs were scaled up by assuming an infrared luminosity of 2 × 10¹³ L⊙, comparable to the lensing-corrected luminosity of HFLS3.
As Figure 3 shows, 10-h integration SAFARI spectra will allow us to characterise the physical properties of such HyLIRGs at z ⋍ 8 in terms of the following characteristics: (i) PAH feature strengths; (ii) fine-structure line strengths; and (iii) underlying continuum shapes. For example, SAFARI will be able to test whether or not many of z > 5 galaxies are scaled-up versions of local low-metallicity BCDs. The mid-infrared spectra of low-metallicity BCD are distinctly different from those of normal infrared-luminous galaxies because of weak PAH features, strong high-excitation lines (e.g., [Ne iii] 15.5 μm and [S IV] 10.5 μm), and a sharply rising red continuum, as first reported by Madden et al. (Reference Madden, Galliano, Jones and Sauvage2006) based on ISO observations. Weak (or even absent) PAH features are a common characteristic of low-metallicity galaxies while strong high-excitation lines are likely due to a harder UV radiation field (Hunt et al. Reference Hunt, Bianchi and Maiolino2005; Wu et al. Reference Wu, Charmandaris, Hao, Brandl, Bernard-Salas, Spoon and Houck2006). The latter also explains the presence of the strong [O iii] 88-μm line (even more luminous than the [C II] 158-μm line) in low-metallicity dwarf galaxies, as recently observed by Herschel/PACS spectroscopy (Cormier et al. Reference Cormier2015). A powerful way to discriminate between low-metallicity BCDs, ‘normal’ (solar-metallicity) starburst galaxies, and AGN has also been derived from specific mid-infrared line ratios as presented by Fernández-Ontiveros et al. (Reference Fernández-Ontiveros, Spinoglio, Pereira-Santaella, Malkan, Andreani and Dasyra2016) (see their Figure 11) and Spinoglio et al. (Reference Spinoglio2017).
The recent detections of high-ionisation UV lines in high-redshift galaxies (e.g., Stark et al. Reference Stark2015a, Reference Stark2015b; Stark et al. Reference Stark2017; Mainali et al. Reference Mainali, Kollmeier, Stark, Simcoe, Walth, Newman and Miller2017) suggest that their mid-infrared spectra may also exhibit high-ionisation lines like those seen in these BCD spectra, and if so, that may support the idea that local BCDs are good analogues of high-redshift star-forming galaxies. A sharply increasing red continuum indicates a significantly warmer dust temperature (46.5 K in the case of Haro 11 by Lyu et al. Reference Lyu, Rieke and Alberts2016), and SAFARI will be effective for detecting such a warm-dust SED since its wavelength coverage extends to >20 μm in the rest-frame even at z = 8. The existence of such a warm-dust host galaxy has been suggested for z > 5 quasars based on their SED analysis (Lyu et al. Reference Lyu, Rieke and Alberts2016).
2.5. Molecular hydrogen (H2) emission
The rest-frame mid-infrared spectral range is uniquely important, since it contains H2 lines originating from the lowest energy levels (i.e., so-called H2 pure-rotational linesFootnote d ), which allow us to measure the temperature and mass of the bulk of warm (T ≳ 100 K) molecular hydrogen gas in galaxies directly.
In local/low-redshift LIRGs and ULIRGs, the luminosities of the H2 0–0 S(1) line (which is normally one of the brightest pure-rotational lines) are typically around 0.005% of the total infrared luminosities [e.g., as estimated by Egami et al. (Reference Egami, Rieke, Fadda and Hines2006b) using the data from Rigopoulou et al. (Reference Rigopoulou, Kunze, Lutz, Genzel and Moorwood2002) and Higdon et al. (Reference Higdon, Armus, Higdon, Soifer and Spoon2006)]. With a 10-h integration, SAFARI’s 5σ line detection limit will be ≳ 109 L⊙ at z > 5, so this means that for a successful detection of the H2 0–0 S(1) line at z > 5, we would need a galaxy with a total infrared luminosity of > 2 × 10¹³ L⊙, that is, HyLIRGs like those listed in Table 1.
By combining CLOUDY calculations (Ferland et al. Reference Ferland2013) with a zoom-in, high-resolution (⋍30 pc) numerical simulation, it is now possible to examine the physical conditions and internal structures of the inter-stellar medium (ISM) in high-redshift galaxies including molecular hydrogen gases (e.g., Vallini, Dayal, & Ferrara Reference Vallini, Dayal and Ferrara2012; Vallini et al. Reference Vallini, Gallerani, Ferrara and Baek2013, Reference Vallini, Gallerani, Ferrara, Pallottini and Yue2015; Pallottini et al. Reference Pallottini, Ferrara, Gallerani, Vallini, Maiolino and Salvadori2017a, Reference Pallottini, Ferrara, Bovino, Vallini, Gallerani, Maiolino and Salvadori2017b). So far, these simulations have explored the properties of average z ∼ 6 LBGs, and their H2 line luminosities are predicted to be well below SAFARI’s detection limit (see Appendix A). For a successful SAFARI H2 detection at such high redshift, we would therefore need a more massive galaxy undergoing a more violent H2 heating process.
From the observations of the nearby and lower-redshift Universe, it is known that there exist galaxies that exhibit exceptionally strong H2 emission. Examples include the local LIRG NGC 6240 (e.g., Lutz et al. Reference Lutz, Sturm, Genzel, Spoon, Moorwood, Netzer and Sternberg2003; Egami et al. Reference Egami, Neugebauer, Soifer, Matthews, Becklin and Ressler2006a; Armus et al. Reference Armus2006), the brightest cluster galaxy (BCG) in the centre of the X-ray-luminous cluster Zwicky 3146 (Z3146; z = 0.29; Egami et al. Reference Egami, Rieke, Fadda and Hines2006b), and the radio galaxy PKS1138-26 at z = 2.16 (the Spiderweb galaxy; Ogle et al. Reference Ogle, Davies, Appleton, Bertincourt, Seymour and Helou2012). The L(H2 0–0 S(1))/L IR ratios of the first two galaxies are 0.03% and 0.25%, respectively, significantly larger than the typical value of 0.005% quoted above. No H2 0–0 S(1) measurement is available for the Spiderweb galaxy because of its high redshift, but the L(H2 0–0 S(3))/L IR ratio is comparably high (0.4%). Such luminous H2 emission lines are thought to be generated by mechanisms involving strong shocks, such as galaxy mergers (e.g., NGC 6240) and radio jets (e.g., the Spiderweb).
Note that some of the reported warm H2 gas masses are exceptionally large, ∼ 1010 M⊙ for the Z3146 BCG and ∼2 × 10¹⁰ M⊙ for the radio galaxy 3C 433 at z = 0.1 (Ogle et al. Reference Ogle, Boulanger, Guillard, Evans, Antonucci, Appleton, Nesvadba and Leipski2010). However, their CO observations indicate that warm/cold H2 mass ratios are very different between these two galaxies: ∼ 0.1 for the Zwicky 3146 BCG, which is a typical value for infrared-luminous galaxies, while > 3 for 3C 433, likely indicating an abnormally strong H2 heating process.
Figure 4 shows the detectability of the brightest pure-rotational lines of three luminous H2 emitters (NGC 6240, the Z3146 BCG, and the Spiderweb galaxy) toward high redshift. Although the H2 0–0 S(5) line of NGC 6240 would drop out of SAFARI detection at z ∼ 3, the H2 0–0 S(3) line of the Z3146 BCG would remain visible up to z ∼ 6, and the H2 0–0 S(3) line of the Spiderweb galaxy would stay well above the SAFARI detection limit even at z = 10. The figure also shows that if we assume an NGC 6240-like L (H2 0–0 S(1))/L IR ratio (i.e., 0.03%), a HyLIRG with L IR = 1013 L⊙ will produce an H2 0–0 S(1) line detectable up to z ∼ 8, and with a Z3146 BCG-like ratio (i.e., 0.25%), it will be detectable beyond z = 10, just like the Spiderweb galaxy. The existence of these extreme H2 emitters suggests that H2 lines will likely serve as important probes for galaxies at high redshift, providing crucial observational constraints on theoretical models like the one presented for a z ⋍ 6 LBG in Appendix A.
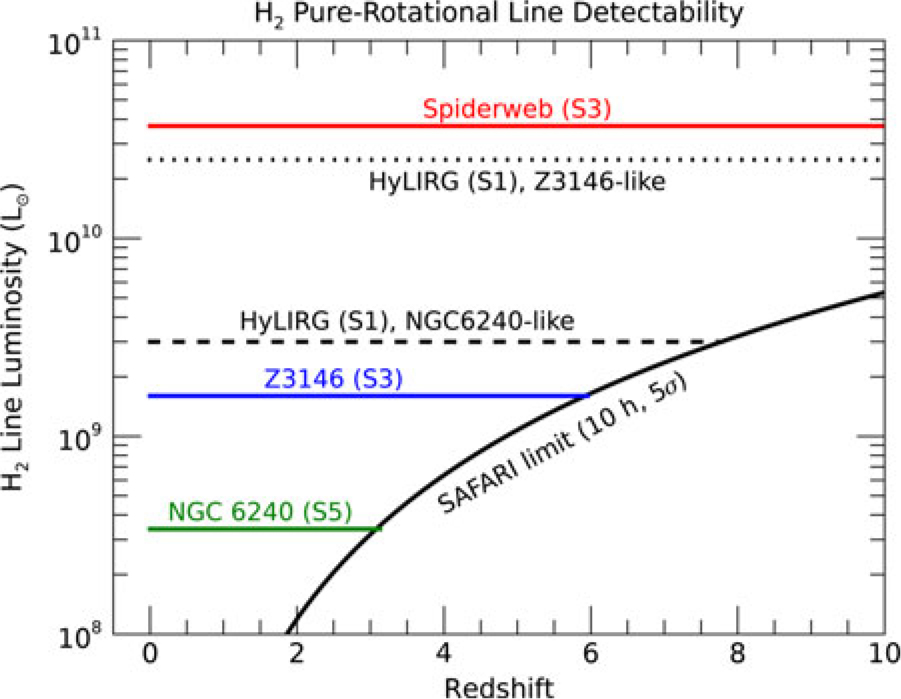
Figure 4. Detectability of H2 pure-rotational lines for three known extreme H2 emitters: (1) the Spiderweb radio galaxy at z = 2.16 with L(0–0 S(3)) = 3.7 × 10¹⁰ L⊙ (Ogle et al. Reference Ogle, Davies, Appleton, Bertincourt, Seymour and Helou2012); (2) Z3146 BCG at z = 0.29 with L(0–0 S(3)) = 1.6 × 10⁹ L⊙ (Egami et al. Reference Egami, Neugebauer, Soifer, Matthews, Becklin and Ressler2006a); (3) NGC 6240 at z = 0.0245 with L(0–0 S(3)) = 3.4 × 10⁸ L⊙ (Armus et al. Reference Armus2006). The brightest line was used for each case. With SAFARI’s line sensitivity, which is also plotted (10 h, 5σ), the Spiderweb galaxy would be visible beyond z = 10, while the Z3146 BGC would be visible up to z ∼ 6; NGC 6240, on the other hand, would drop out at z ∼ 3. Also shown are the visibilities of a HyLIRG (L IR = 1013 L⊙) through the 0–0 S(1) line assuming L 0—0 S (1)/L IR = 0.25% (Z3146-like) and 0.03% (NGC 6240-like).
It should be emphasised that H2 emission is sensitive only to warm (T ≳ 100 K) H2 gas, meaning that it allows sampling of only a limited fraction (∼ 10–20%) of the total molecular gas mass in a typical galaxy. However, it is also possible to estimate the total H2 gas mass from the measured warm H2 gas mass by making some assumptions. For example, Togi & Smith (Reference Togi and Smith2016) recently proposed such a method, estimating the total H2 gas mass from the observations of multiple H2 emission lines alone, assuming a continuous power-law distribution of rotational temperatures down to a certain cutoff value. For a sample of local galaxies with reliable CO-based molecular masses, this method has been shown to produce the total molecular gas mass within a factor of 2 of those derived from CO when a cut-off temperature of around 50 K is adopted. Though indirect and dependent on some assumptions, methods like this have the potential to provide useful estimates for total H2 gas masses, especially for low-metallicity galaxies, for which CO-/dust-based methods are known to underpredict molecular gas mass by a factor of approximately 100 locally, possibly due to the presence of CO-dark H2 gas (Wolfire, Hollenbach, & McKee Reference Wolfire, Hollenbach and McKee2010; Togi & Smith Reference Togi and Smith2016).
Taking these known extreme H2 emitters as a guide, we also simulated the spectra of H2 lines in Figure 3, by making the following two assumptions: (1) H2 level populations are fully thermalised (i.e., in the LTE); and (2) the galaxy contains two warm H2 gas components, one with a gas mass of 2 × 10¹⁰ M⊙ and a gas temperature of T = 200 K and the other with a gas mass of 2 × 10⁸ M⊙ and a gas temperature of T = 1 000 K. An ortho-to-para ratio of 3:1 is also assumed. Such a two-component LTE model is known to produce good fits to the excitation diagrams of H2 pure-rotational lines for lower-redshift galaxies (e.g., Higdon et al. Reference Higdon, Armus, Higdon, Soifer and Spoon2006), although this should probably be taken as a simple and effective parameterisation of more complex underlying gas temperature and mass distributions.
The red lines shown in Figure 3 indicate the H2 emission lines produced by such a model. These simulated H2 lines have luminosities of 0.5–1 × 10¹⁰ L⊙, exceeding SAFARI’s 10-h 5σ line-flux limit of 3 × 10⁹ L⊙ at z = 8. If detected, such luminous H2 lines would indicate the existence of a large warm H2 gas reservoir, as well as some mechanism that heats it (e.g., shocks), possibly marking the sites of galaxy formation/assembly.
3. Exploratory sciences
From a broader perspective, the 35–230-μm window targeted by SAFARI has a singular importance over the coming decades, as we try to detect and study the first-generation objects that appeared in the early Universe. This spectral range, which samples the rest-frame mid-infrared at z > 5, is uniquely powerful for probing first-generation objects because it contains: (1) key cooling lines of low-metallicity or metal-free gas, especially H2 lines; and (2) emission features of solid compounds that are thought to be abundant in the remnants of Pop III supernovae (SNe). Detections of such spectral features, if successful, will open up a new frontier in the study of the early Universe, shedding light on the physical properties of the first galaxies and first stars.
As soon as the Big-Bang cosmology was validated by the detection of the cosmic microwave background (CMB) radiation (Penzias & Wilson Reference Penzias and Wilson1965), it was recognised that H2 molecules must have played an important role as a coolant of pristine pre-galactic gas clouds (Saslaw & Zipoy Reference Saslaw and Zipoy1967; Peebles & Dicke Reference Peebles and Dicke1968; Hirasawa Reference Hirasawa1969; Matsuda, Satō, & Takeda Reference Matsuda, Satō and Takeda1969; Takeda, Satō, & Matsuda Reference Takeda, Satō and Matsuda1969). In the metal-free environment that existed in the early Universe, the only available coolants were hydrogen, helium, and molecular hydrogen; since the gas cooling curves of the former atomic species have a cutoff around 104 K (e.g., Thoul & Weinberg Reference Thoul and Weinberg1995), H2 molecules must have been the dominant coolant in pristine primordial gas clouds that are not massive enough (e.g., < 108 M⊙ at z ∼ 10) to have a virial temperature (T vir) of > 104 K. Put in another way, H2 cooling determines the minimum mass of a pristine gas cloud that can cool and contract at a given redshift (e.g., Tegmark et al. Reference Tegmark, Silk, Rees, Blanchard, Abel and Palla1997). As a result, H2 lines are considered to be the most powerful (and likely the only) probe of the first cosmological objects that appeared in the early Universe. In such pristine gas clouds, cooling is dominated by H2 pure-rotational lines, and at the expected formation redshift of such first-generation objects, z ∼ 10–30, these H2 lines will fall in the far-infrared.
From the discussion in the previous section, it is clear that SAFARI can only detect exceptionally luminous systems at high redshift (μL line > 109 L⊙ at z > 5). However, the abundance and physical properties of such luminous (and therefore likely massive) systems at z > 5, not to mention those of the first-generation objects, are barely known at present, preventing us from making realistic predictions for what SAFARI may be able to detect and study. The goal of this section, therefore, is to explore (as opposed to assess) SPICA ‘s potential to open up a new window towards the early Universe. Recognising that any current model predictions suffer from considerable uncertainties, we discuss various topics while allowing a gap of up to a factor of 100 between SAFARI’s expected sensitivity and model-predicted source luminosities. This is because any theoretical prediction could easily be off by an order of magnitude and gravitational lensing could bridge a gap of another factor of 10 (or even more). The aim here is to present scientific ideas for further refinement rather than making a quantitative assessment, which is not yet possible given the lack of direct observational constraints.
3.1. First objects: Current picture
Although first stars and galaxies are yet to be observed, they have been a major focus of theoretical studies over the years [see Ciardi & Ferrara (Reference Ciardi and Ferrara2005), Bromm & Yoshida (Reference Bromm and Yoshida2011), Yoshida, Hosokawa, & Omukai (Reference Yoshida, Hosokawa and Omukai2012), Bromm (Reference Bromm2013), Greif (Reference Greif2015), and Barkana (Reference Barkana2016) for review]. In the framework of the standard ΛCDM model, we expect the first (i.e., Pop III) stars to form in dark matter (DM) minihalos of around 106 M⊙ at redshifts z ⋍ 20–30, cooling via H2 molecular lines (Haiman, Thoul, & Loeb Reference Haiman, Thoul and Loeb1996; Tegmark et al. Reference Tegmark, Silk, Rees, Blanchard, Abel and Palla1997; Yoshida et al. Reference Yoshida, Abel, Hernquist and Sugiyama2003). The first stars formed in such a metal-free environment are believed to be quite massive (> 100 M⊙; e.g., Hirano et al. Reference Hirano, Hosokawa, Yoshida, Omukai and Yorke2015), and would emit strong H2 -dissociating UV radiation (e.g., Omukai & Nishi Reference Omukai and Nishi1999) and produce powerful supernova explosions (Bromm, Yoshida, & Hernquist Reference Bromm, Yoshida and Hernquist2003), essentially shutting off subsequent star formation. For this reason, these minihalos are not regarded as ‘first galaxies’ although they are the sites of the first star formation. The next generation of star formation will then take place in more massive halos (∼ 108 M⊙) collapsing at z ∼ 10, whose virial temperature is high enough (> 104 K) to sustain cooling due to atomic hydrogen (e.g., Oh & Haiman Reference Haiman2002). These so-called atomic cooling halos hosting the second generation of stars are often considered as ‘first galaxies’ (Bromm & Yoshida Reference Bromm and Yoshida2011).
Note that according to this current standard picture, first galaxies are not necessarily metal-free (Pop III), which is often taken as the observational definition of the first galaxies. In fact, ‘This popular definition of a first galaxy may be misleading and may render any attempts to find first galaxies futile from the very outset’ (Bromm & Yoshida Reference Bromm and Yoshida2011). This is because it is difficult to prevent minihalos, that is, the building blocks of first galaxies, from forming massive Pop III stars and chemically enriching their surroundings through SNe explosions. In other words, to produce genuine Pop III galaxies, it is necessary to inhibit star formation in the progenitor mini-halos by suppressing the formation of molecular hydrogen in them. This would require H2 -dissociating Lyman–Werner (LW) background radiation in the Far-UV (11.2–13.6-eV photons) and the source of such radiation before the formation of Pop III galaxies. This leads to a scenario in which the first galaxies that appeared in the Universe (in the chronological sense) were mostly Pop II galaxies; Pop III galaxies would appear subsequently in underdense regions where the star formation in minihalos was suppressed by radiation emitted by stars/galaxies formed earlier in overdense regions. For this reason, Pop III galaxies may be considered as the second-generation galaxies containing first-generation stars (e.g., Johnson, Greif, & Bromm Reference Johnson, Greif and Bromm2008; Trenti & Stiavelli Reference Trenti and Stiavelli2009; Johnson Reference Johnson2010; Stiavelli & Trenti Reference Stiavelli and Trenti2010; Johnson, Dalla Vecchia, & Khochfar Reference Johnson, Dalla Vecchia and Khochfar2013).
Adopting this theoretical picture as the baseline, we will discuss below the rest-frame mid-infrared spectral signatures of massive (M h ∼ 1011 – 1012 M⊙) forming galaxies containing low-metallicity or pristine (i.e., metal-free) gas clouds. By ‘forming’, we denote galaxies that are yet to form stars, meaning that the source of line luminosities is the gravitational energy released by the contraction of clouds under their self-gravity, rather than stellar radiation.
Production of the first dust by Pop III SNe would be another important scientific topic that could be uniquely addressed by rest-frame mid-infrared spectroscopy. However, considering that even larger uncertainties are involved in such a discussion, we limit ourselves here to providing a qualitative overview in Appendix B, deferring a more quantitative analysis to a forthcoming paper (R. Schneider et al., in preparation).
3.2. Massive forming galaxies
3.2.1. Population II
As already discussed above, formation of Pop II galaxies may precede that of Pop III galaxies in the history of the Universe. When the gas metallicity exceeds a certain thresholdFootnote e , gas cooling will be dominated by several key fine-structure lines, such as [C II] 158 μm and [O I] 63 μm in the far-infrared (Bromm & Loeb Reference Bromm and Loeb2003) and [Si II] 34.8 μm and [Fe II] 25.99/35.35 μm in the mid-infrared (Santoro & Shull Reference Santoro and Shull2006) if we assume that C, Si, and Fe atoms are photoionised by ambient UV radiation. The former far-infrared lines, when redshifted, can be studied with submillimetre/millimetre telescopes on the ground (e.g., ALMA), but the detection of the latter mid-infrared lines requires a space far-infrared telescope such as SPICA Footnote f .
For SAFARI to have any chance of detection, the target object must be exceptionally luminous and massive. As a maximal model, we consider here a Pop-II forming galaxy that has a gas mass (M gas) of 1011 M⊙. The corresponding halo mass (M h) would be ∼ 1012 M⊙, and such a massive halo has a comoving number density of ∼ 10−5 Mpc−3 at z ∼ 6. The resultant gas mass fraction would be ∼ 10%, which is still well below the cosmic baryon fraction of ∼ 0.19 (fb = Ω b / Ω c ; Planck Collaboration et al. 2016). Such a classical model of a massive forming galaxy containing a uniform gas is obviously an over-simplification, but it serves the purpose of illustrating the parameter space SAFARI could potentially probe.
Figure 5 plots the expected luminosities of key cooling lines from such a massive forming galaxy assuming a metallicity of Z = 0.01 Z⊙. Figure 5(a) shows that if the gas is sufficiently warm (T ≳ 200 K) and dense (n H ∼ 105–106 cm−3) to thermalise all these lines (i.e., in LTE), the mid-infrared fine-structure lines such as the [Fe II] 25.99/35.35- μm and [Si II] 34.8- μm lines can be quite luminous (≳ 1011 L⊙) and detectable with SAFARI to high redshift (Note, however, that these lines will be redshifted out of the SAFARI window at z = 7.8/5.5, and 5.6, respectively). On the other hand, if the typical gas density is more like ∼ 103 cm−3, these mid-infrared fine-structure lines will become undetectable beyond z ∼ 5 even for such a massive forming galaxy [Figure 5(b)].
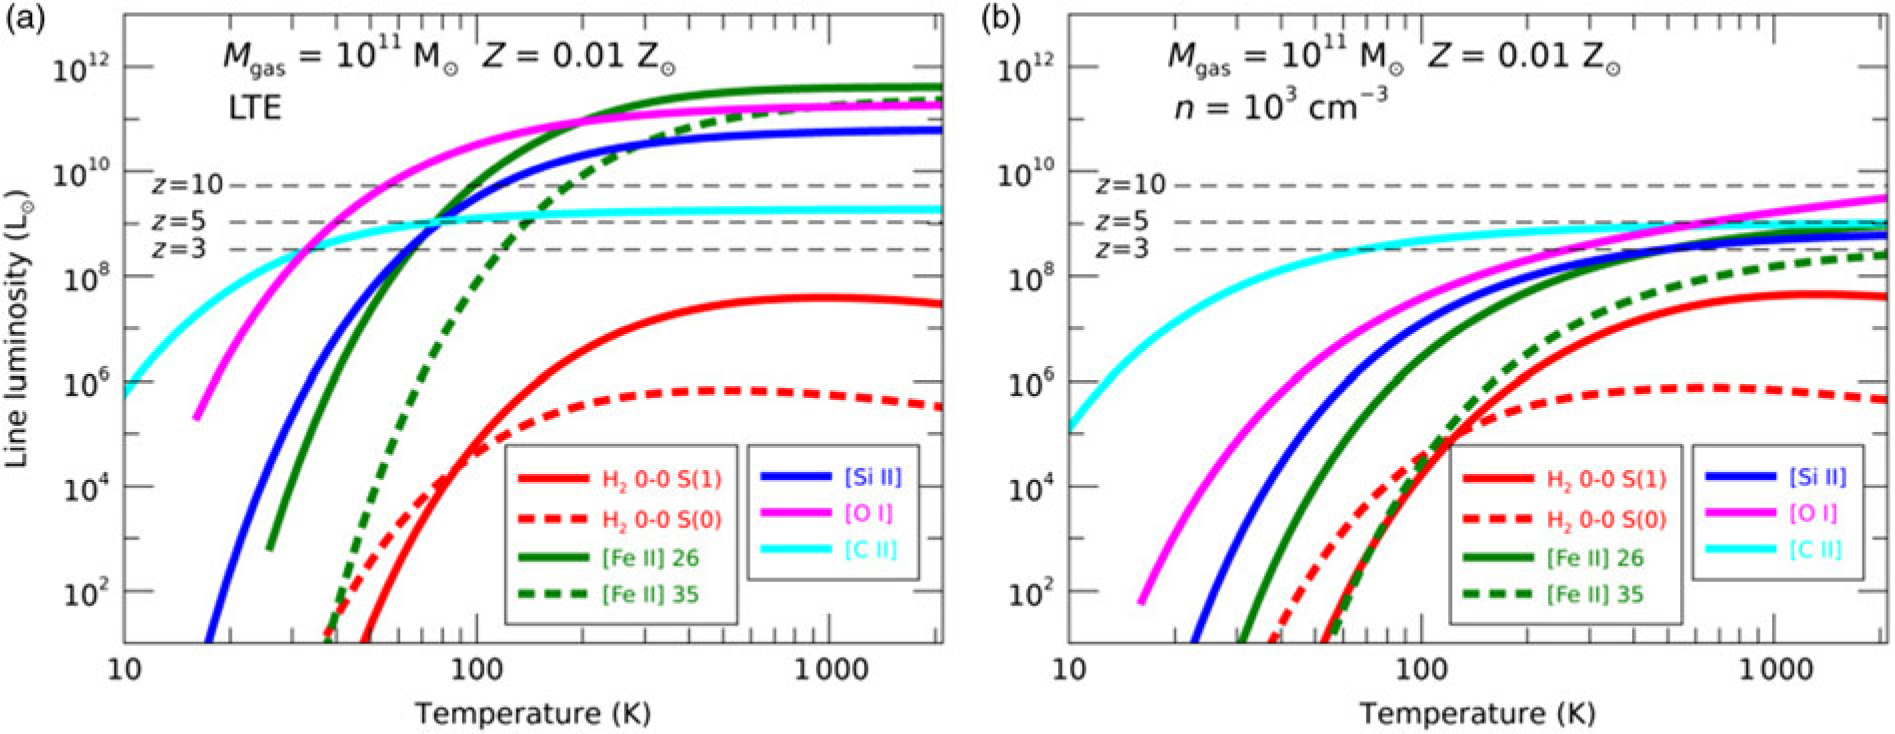
Figure 5. Luminosities of H2 lines (0–0 S(1) 17 μm and 0–0 S(0) 28 μm) and fine-structure lines ([Fe II] 25.99/35.35 μm, [Si II] 34.8 μm, [O I] 63 μm, and [C II] 158 μm) calculated for a low-metallicity (Z = 0.01 M⊙) forming galaxy with a gas mass of 1011 M⊙. The left panel (a) assumes a gas density high enough for these lines to be thermalised (i.e., in LTE) while the right panel (b) corresponds to the case with a gas density of 103 cm−3. A molecular fraction of 2 × 10⁻⁴ was assumed for both cases. The former is similar to the calculation presented by Santoro & Shull (Reference Santoro and Shull2006) (see their Figure 11 for a similar model with a gas mass of 108 M⊙). The horizontal dotted lines indicate the nominal 5σ detection limit of SAFARI with a 10-h on-source integration time for z = 3, 5, and 10. The LTE case on the left suggests that if the gas is sufficiently warm (T ≳ 200 K), fine-structure lines like [Fe II] 25.99/35.35 μm and [Si II] 34.8 μm can be quite luminous (note, however, that these lines will be redshifted out of the SAFARI window at z = 7.8/5.5, and 5.6, respectively).
As discussed by Santoro & Shull (Reference Santoro and Shull2006), H2 lines in these models are significantly fainter when compared to the fine-structure lines. This is because the molecular fraction was assumed to be 2 × 10⁻⁴ here, resulting in a total H2 gas mass of only 2 × 10⁷ M⊙. As already shown in Figure 3, for SAFARI to detect H2 lines at high redshift, the corresponding H2 gas mass needs to be ≳ 1010 M⊙. Note that the luminosities of H2 lines, as well as that of [C II] 158 μm, do not change much between the two cases because a gas density of 103 cm−3 is close to the critical densities of these transitions.
3.2.2. Population III
For the discussion of Pop-III forming galaxies, we refer to the model calculations by Omukai & Kitayama (Reference Omukai and Kitayama2003) as a guide. Because of the reduced cooling efficiency due to the absence of metal lines, Pop III systems with M h ≳ 1012 M⊙ cannot cool appreciably within the halo merging timescale, constantly heated by infalling subhalos. As a result, the most H2 -luminous Pop-III forming galaxies are expected to be those with a halo mass of ⋍ 1011 M⊙; H2 line luminosities will decline sharply for higher-mass systems. The z = 8 M h = 1011 M⊙ Pop-III forming galaxy modelFootnote g by Omukai & Kitayama (Reference Omukai and Kitayama2003) predicts the luminosity of the brightest H2 line (0–0 S(3)) to be 3.3 × 10⁷ L⊙, still two orders of magnitude below the SAFARI’s nominal detection limit (∼3 × 10⁹ L⊙ at z = 8, 10 h, 5σ). Other theoretical studies predicted similar H2 line luminosities (e.g., Mizusawa, Omukai, & Nishi Reference Mizusawa, Omukai and Nishi2005; Gong, Cooray, & Santos Reference Gong, Cooray and Santos2013), indicating that a successful detection of H2 lines will require some mechanism to boost the line luminosities (see Section 3.2.3) as well as magnification by lensing (see Section 4.1)Footnote h .
Note that the virial temperature of a M h ⋍ 1011 M⊙ halo is high enough (> 104 K) to sustain H I atomic cooling. As a result, these massive forming galaxies are also expected to be strong Lyα emitters (The source of Lyα emission here is the release of gravitational energy due to the contraction of pristine gas clouds and not the radiation from young stars). In fact, the Lyα line is more luminous (4.9 × 10⁷ L⊙) than any of the individual H2 lines, although the total H2 line luminosity is ∼108 L⊙, exceeding that of Lyα. Even with JWST, however, such a Lyα line will not be easy to detect. The estimated observed Lyα line flux will be 2.4 × 10⁻²² W m−2 at z = 8 while the line sensitivity of JWST/NIRSpec at the wavelength of the redshifted Lyα (∼1 μm) will be ⋍ 2.5 × 10⁻²¹ W m−2 (5σ, 1 h, with the R = 1 000 grating), which is one order of magnitude brighter. Furthermore, Lyα emission may be resonantly scattered and absorbed by the intervening neutral IGM.
3.2.3. Other H2 excitation mechanisms
The calculations above indicate that gravitational contraction of massive forming galaxies alone is unlikely to release enough energy to produce H2 lines that are detectable with SAFARI at high redshift. The next question is therefore if there could be any other H2 excitation mechanisms that would produce even more luminous H2 lines. Below, we discuss a few possibilities:
Pop III SNe: Explosions of Pop III SNe may produce strong H2 lines by blowing away the gas content of the parent galaxy and collecting it into a cooling shell where H2 rapidly forms (Ciardi & Ferrara Reference Ciardi and Ferrara2001). Such SN blowouts are expected to happen in low-mass Pop III galaxies, whose gravitational potential is shallow (Ferrara Reference Ferrara1998). According to the calculation by Ciardi & Ferrara (Reference Ciardi and Ferrara2001), a Pop III galaxy with a halo mass of 108 − 109 M⊙ could emit H2 lines with luminosities reaching 106 − 107 L⊙ at z ⋍ 8–10, corresponding to ∼10% of the explosion energy. These line luminosities are comparable to those of the M h = 1011 M⊙ Pop-III forming galaxy discussed in Section 3.2.2, but the halo mass here is 10–100× smaller, signifying the power of SN explosions to enhance H2 luminosities. Given the significant uncertainties associated with the simple analytic model of Ciardi & Ferrara (Reference Ciardi and Ferrara2001), a further theoretical investigation is needed to assess this model more quantitatively.
One interesting aspect of this Pop III SNe explosion model is that the ro-vibrational line 1–0 S(1) (2.12 μm) is expected to be significantly brighter than the pure-rotational line 0–0 S(1) (17 μm), reflecting a hotter temperature of the H2 -emitting gas. Strong ro-vibrational lines would make shorter-wavelength observations effective. For example, the 1–0 S(1) line would be redshifted to 19 μm at z = 8, which is shortward of the SAFARI wavelength coverage but within those of JWST /Mid-Infrared Instrument (MIRI) and SPICA /SMI. However, the line-luminosity predicted by Ciardi & Ferrara (Reference Ciardi and Ferrara2001) is ∼ 10−21 W m−2, still not bright enough for these instruments to make an easy detection.
Merging of massive halos: In the high-redshift Universe, where halos are constantly merging to create more massive galaxies, H2 formation and excitation due to strong shocks are likely important. Such a mechanism has been seen to be at work in some systems in the local Universe. One particularly interesting example is the Stephan’s Quintet, located in a compact group at 94 Mpc, which exhibits exceptionally luminous H2 emission (2 × 10⁸ L⊙ for 0–0 S(0) through S(5) combined) spreading over an area of approximately 50 × 35 kpc2 (Appleton et al. Reference Appleton2006; Cluver et al. Reference Cluver2010; Appleton et al. Reference Appleton2013, Reference Appleton2017). It is believed that in this system, one high-velocity ‘intruder’ galaxy is colliding with the intergroup medium and generating shocks (Sulentic et al. Reference Sulentic, Rosado, Dultzin-Hacyan, Verdes-Montenegro, Trinchieri, Xu and Pietsch2001). According to the model presented by Guillard et al. (Reference Guillard, Boulanger, Pineau Des Forêts and Appleton2009), H2 molecules form out of the shocked gas, and H2 emission is powered by the dissipation of kinetic turbulent energy of the H2 gas. A similar mechanism will likely generate luminous H2 lines through merging of massive halos (i.e., major mergers) at high redshift.
3.3. Pop III objects at lower redshift
Although detecting genuine Pop III objects at high redshift will likely require strong boosting of H2 line luminosities by some mechanism as well as lensing amplification, SAFARI may be able to probe the properties of such objects through the observations of similarly metal-poor objects that may exist at lower redshift. For example, a number of studies have suggested that Pop III star formation may continue towards low redshift and maybe even down to z ∼ 3 (e.g., Scannapieco, Schneider, & Ferrara Reference Scannapieco, Schneider and Ferrara2003; Jimenez & Haiman Reference Jimenez and Haiman2006; Schneider et al. Reference Schneider, Salvaterra, Ferrara and Ciardi2006a; Tornatore, Ferrara, & Schneider Reference Tornatore, Ferrara and Schneider2007; Ricotti, Gnedin, & Shull Reference Ricotti, Gnedin and Shull2008; Trenti & Stiavelli 887 Reference Trenti and Stiavelli2009; Johnson Reference Johnson2010; Johnson et al. Reference Johnson, Dalla Vecchia and Khochfar2013; Pallottini et al. Reference Pallottini, Ferrara, Gallerani, Salvadori and D’Odorico2014, Reference Pallottini, Gallerani, Ferrara, Yue, Vallini, Maiolino and Feruglio2015a). According to the recent Renaissance Simulations (Xu et al. Reference Xu, Norman, O’shea and Wise2016), only 6% of the volume and 13% of the gas mass are enriched to [Z/H] > −4 at z = 7.6 in the comoving survey volume of 220 Mpc3, indicating that there is a large amount of pristine gas available for Pop III star formation at z > 7.6 (although much of it likely resides in low-density diffuse IGM). Observationally, however, there has been no secure identification of a Pop III galaxy so far. Although there are indications of massive, low-metallicity stars in the nearby lowest-metallicity galaxy I Zw 18 (Kehrig et al. Reference Kehrig, Vílchez, Pérez-Montero, Iglesias-Páramo, Brinchmann, Kunth, Durret and Bayo2015), a clear detection of Pop III objects is still missing. Note that, at z = 3, the line-luminosity detection limit of SAFARI will be lower by an order of magnitude (∼3 × 10⁸ L⊙, 5σ in 10 h) compared to that at z = 8, potentially enhancing the probability of detecting Pop III objects.
4. Finding targets for SAFARI
SAFARI will conduct spectroscopy in the single-object mode, targeting one source at a time. Since the surface density of luminous z > 5 galaxies like those listed in Table 1 is small (e.g., the six SPT galaxies listed were discovered by a millimetre survey covering an area of ∼2 500 deg2), the success of SAFARI in the high-redshift exploration will heavily depend on how we will be able to discover exciting targets with the existing and future wide-field survey data. Below, we discuss strategies for such a target selection.
4.1. Surface density of massive halos at z > 5
Whether we try to detect hyper-luminous galaxies like HFLS3/SPT0311-58 (Section 2.4) or a massive Pop-II forming galaxy (Section 3.2.1), we will be searching for objects residing in massive halos with M h ≥ 1012 M⊙. Figure 6 shows the cumulative surface density of ≥ 1012 M⊙ halos per 1 000 deg2 (the black line). Together, we also plot the surface densities of ≥1011 M⊙ halos gravitationally lensed by a factor of ≥10 × (the red line) and ≥1010 M⊙ halos lensed by a factor of ≥100 × (the blue line). If we make a simple assumption that various physical properties of galaxies hosted by these halos (e.g., SFR, M *) roughly scale linearly with the halo mass at z > 5 (i.e., maintaining a constant mass-to-light ratioFootnote i ), these three populations of halos would contain galaxies that have comparable apparent brightnesses. The cumulative surface density of the three halo populations combined (the thick grey line) is about 2 200 at z ≥ 7, 280 at z ≥ 8, 50 at z ≥ 9, and 12 at z ≥ 10 (per 1 000 deg2). The figure also shows that lensed populations would start to dominate in number at z ≳ 8.5, especially ≥ 1010 M⊙ halos magnified by a factor of ≥100 ×.
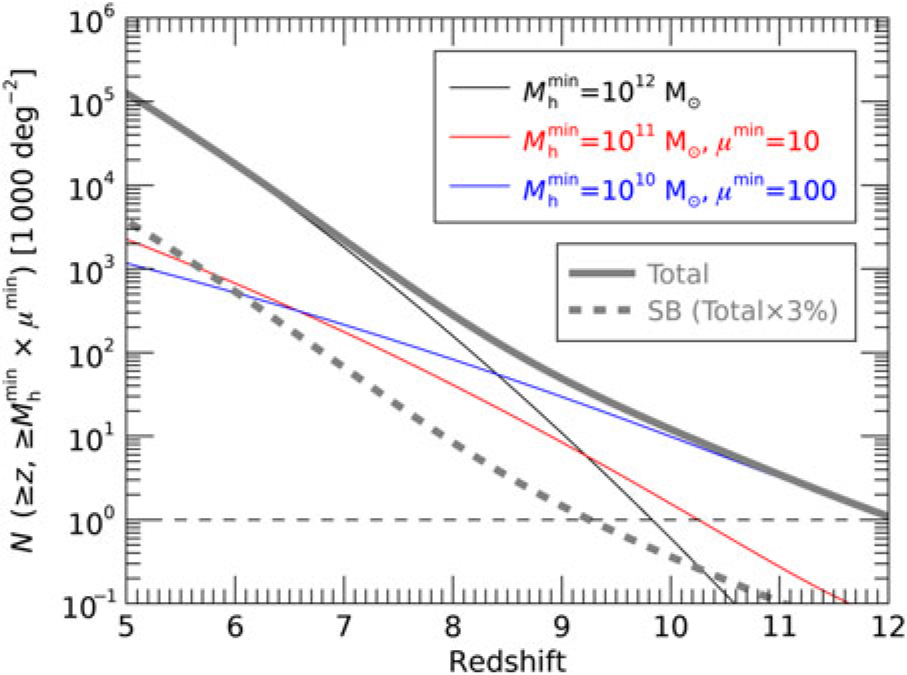
Figure 6. Cumulative surface densities of DM halos per 1 000 deg2 as predicted by the standard ΛCDM model. The black line indicates the cumulative surface density of ≥ 1012 M⊙ halos down to given redshifts while the blue and red lines plot the corresponding numbers for ≥ 1011 M⊙ halos gravitationally lensed by a factor of ≥ 10 × (μ ≥ 10) and for ≥ 1010 M⊙ halos lensed by a factor of ≥ 100 × (μ ≥ 100), respectively. According to the calculation by Zackrisson et al. (Reference Zackrisson, González, Eriksson, Asadi, Safranek-Shrader, Trenti and Inoue2015), when the source redshift is above ∼ 5, the corresponding lensing probability is roughly constant and ∼ 10−4 for μ ≥ 10 and ∼ 10−6 for μ ≥ 100 along an average line of sight. These probabilities have been multiplied with the ≥ 1011 and ≥ 1010 M⊙ halo surface densities. The thick grey line plots the total surface density of the three halo populations combined while the thick grey dashed line plots 3% of the total number, comparable to the starburst fraction estimated at lower redshift (e.g., Béthermin et al. Reference Béthermin2017). The halo comoving number density was computed with the Press–Schechter formalism (Press & Schechter Reference Press and Schechter1974). The horizontal dashed line corresponds to N = 1.
Note, however, that translating the surface density of halos into that of HyLIRGs (μ L > 1013 L⊙) or massive forming galaxies is not trivial due to a number of astrophysical processes involved. In this sense, Figure 6 sets the upper limit on the number of possible detections (i.e., there cannot be more galaxies than there are halos). In practice, we may assume that only a fraction of these halos hosts luminous objects that are observable with SAFARI. As an illustration, we also plot a line denoting 3% of the total halo number, comparable to a starburst fraction assumed by some models (e.g., Béthermin et al. Reference Béthermin2017). Although luminous objects may be more abundant at high redshift due to increased star/structure-formation activities, these simple calculations indicate that it will likely be necessary to survey hundreds/thousands of square degrees to find a handful of high-redshift objects that are luminous enough for SAFARI to observe, which is consistent with the outcomes of the wide-field Herschel /SPT surveys so far.
4.2. Submillimetre/millimetre surveys
Wide-field submillimetre/millimetre surveys have proven to be extremely effective in finding gravitationally lensed infrared-luminous galaxies at high redshift (e.g., Negrello et al. Reference Negrello2010; Vieira 950 et al. Reference Vieira2013; Weiß et al. Reference Weiß2013). This is because (1) the apparent brightnesses of infrared-luminous galaxies do not fade much in the submillimetre/millimetre to high redshift (up to z ∼ 10 at ∼1 mm) due to a strong negative K correction and (2) foreground galaxies are faint in the submillimetre/millimetre unless they contain strong AGN or they are at really low redshift. As a result, it is straightforward to identify lensed infrared-luminous galaxies at high redshift by just inspecting the brightest sources in the submillimetre/millimetre, 20–30% of which are typically lensed galaxies at z ≳ 1 (Negrello et al. Reference Negrello2010).
Recent results from Herschel /SPIRE wide-field surveys show that the surface density of bright (S 500 > 100 mJy) lensed infrared-luminous galaxies ranges from 0.13 deg−2 (80 sources over 600 deg2, Negrello et al. Reference Negrello2017) to 0.21 deg−2 (77 sources over 372 deg2, Nayyeri et al. Reference Nayyeri2016). The surface density of SPT-selected galaxies has been shown to be consistent with that of these Herschel /SPIRE-selected galaxies (Mocanu et al. Reference Mocanu2013). These low (<1 deg−2) surface densities clearly indicate that wide submillimetre/millimetre surveys covering hundreds/thousands of square degrees are needed to produce a large sample of such lensed infrared-luminous galaxies, only a limited fraction of which will be at z > 5.
The depth of Herschel /SPIRE wide surveys matches well with the spectroscopic sensitivity of SAFARI. HFLS3 (z = 6.34) shown in Figure 1 has a SPIRE 500- μm flux density of 47 mJy, while the corresponding 5σ confusion limit is approximately 35 mJy (Nguyen et al. Reference Nguyen2010). The figure indicates that it will be difficult for SAFARI to obtain good-quality spectra for sources much fainter than HFLS3. In this sense, SPICA will be a well-matched spectroscopic follow-up mission for Herschel -selected z > 5 galaxies.
Note also that most of these submillimetre/millimetre-detected lensed galaxies are located at moderate redshift (z = 1–4). Although these lower-redshift galaxies will make excellent SAFARI targets in general (with a typical magnification factor of 10, integration times will be reduced by a factor of 100), z > 5 galaxies are much more scarce. Compared to the Herschel surveys, the SPT survey has been more successful in finding z > 5 galaxies (see (see Table 1) presumably because the effect of the negative K correction extends towards higher redshift in the millimetre. This suggests that future/ongoing millimetre surveys offer great potential for finding bright targets for SAFARI at the highest redshifts (e.g., Advanced ACT, SPT3G, as well as new cameras on the APEX, IRAM 30-m, and LMT telescopes).
A complementary approach would be to search for lensed infrared-luminous galaxies in the fields of massive lensing clusters. In fact, HLSJ0918, one of the most infrared-luminous galaxies at z ≳ 5 identified so far (see Table 1 and Figure 1) was discovered by the Herschel Lensing Survey (HLS) targeting such lensing cluster fieldsFootnote j (Egami et al. Reference Egami2010; Combes et al. Reference Combes2012; Rawle et al. Reference Rawle2016).
4.3. Lyα survey
Although submillimetre/millimetre surveys have been quite successful so far for finding luminous (often lensed) infrared-luminous galaxies at high redshift (up to z = 6.9), the fraction of such an infrared-luminous galaxy population will likely decrease at higher redshift, where the metallicities of galaxies are significantly lower on average. For the detection of less dusty and therefore UV-bright galaxies, wide-field Lyα emitter surveys will be effective. Although Lyα emission can be strongly suppressed at z > 6 by increasingly neutral IGM, the line may survive if the Lyα-emitting galaxy is located in a large H ii bubble (e.g., Cen & Haiman Reference Cen and Haiman2000; Haiman Reference Haiman2002). In fact, the tentative detection of Lyα emission from the z = 9.1 galaxy recently reported by Hashimoto et al. (Reference Hashimoto2018b) supports this idea. In the next subsection (Section 4.4), we will discuss how we can find such H ii bubbles with the Square Kilometer Array (SKA).
Search for strong Lyα emitters will be particularly powerful for finding massive forming galaxies discussed in Section 3.2. These objects will have little continuum emission before stars are formed, so strong emission lines like Lyα will be the only available tracers for such objects. As already discussed in Section 3.2.2, luminous Pop III H2 emitters are likely luminous Lyα emitters as well.
In this sense, one particularly interesting recent example is CR7 at z = 6.6 (Sobral et al. Reference Sobral, Matthee, Darvish, Schaerer, Mobasher, Röttgering, Santos and Hemmati2015). Its exceptionally bright but narrow Lyα line (2 × 10¹⁰ L⊙), coupled with the detection of a strong He II 1640 Å line and a lack of any metal lines, was originally taken as the sign that this object might harbour a Pop III stellar population. Such a Pop III scenario, however, encountered many difficulties because of the extreme conditions required for the underlying Pop III stellar population (e.g., Pallottini et al. Reference Pallottini2015b; Yajima & Khochfar Reference Yajima and Khochfar2017; Visbal, Bryan, & Haiman Reference Visbal, Bryan and Haiman2017) as well as of the possible presence of strong [O III] 4959/5007 Å lines inferred from the Spitzer /IRAC photometric data (Bowler et al. Reference Bowler, McLure, Dunlop, McLeod, Stanway, Eldridge and Jarvis2017). Although other interpretations were also put forth for the nature of CR7, such as a direct collapse black hole (DCBH, Pallottini et al. Reference Pallottini2015b; Agarwal et al. Reference Agarwal, Johnson, Zackrisson, Labbe, van den Bosch, Natarajan and Khochfar2016; Dijkstra, Gronke, & Sobral Reference Dijkstra, Gronke and Sobral2016; Smith, Bromm, & Loeb Reference Smith, Bromm and Loeb2016; Agarwal et al. Reference Agarwal, Johnson, Khochfar, Pellegrini, Rydberg, Klessen and Oesch2017; Pacucci et al. Reference Pacucci, Pallottini, Ferrara and Gallerani2017), the recent ALMA observations by Matthee et al. (Reference Matthee2017) with the detection of the [C II] 158-μm line have concluded that CR7 is a system that is undergoing the build-up process of a central galaxy through complex accretion of star-forming satellites. The original He ii line detection was also not reproduced by the reanalysis of the same data by Shibuya et al. (Reference Shibuya2018) although a re-analysis done by the CR7 discovery team still detects the line (Sobral et al. Reference Sobral2017), leaving the situation unclear.
Although CR7 is not likely to be a Pop III galaxy, identifying similarly luminous LAEs may prove to be the key to finding luminous H2 emitters at high redshift. The most luminous H2 emitters are those hosted by H i atomic cooling halos, which would also emit comparably luminous Lyα if the line is not significantly absorbed by the IGM (see Section 3.2.2). Since the typical line detection limit of current z ∼ 6–7 narrow-band LAE surveys is ∼ 2 × 10⁹ L⊙ (e.g. Ouchi et al. Reference Ouchi2018), if the corresponding H2 line luminosities are on the same order, SAFARI should be able to detect such H2 lines in ∼10 h (5σ). Without having the capability to conduct a sensitive wide-field H2 line survey in the mid-/far-infrared directly, Lyα -based surveys will likely play an important role for finding strong H2 emitters (and strong mid-infrared line emitters in general) at high redshift.
4.4. SKA survey
In the coming decade, the SKA will start to provide tomographic views of the high-redshift Universe through the 21-cm emission line of neutral hydrogen (e.g., Koopmans et al. Reference Koopmans2015). The wide-field SKA map will be ideal for identifying large bubbles of ionised (H ii) gas at high redshift, marking the concentrations of star-forming galaxies in the early Universe. Multi-wavelength imaging observations targeting these H ii bubbles and the area around them will likely provide interesting targets for SAFARI.
Figure 7 shows halos with M h > 1011 M⊙ (the blue dots) superimposed on the background ionisation field from the simulated tomographic map at z = 8, both projected from a 100-Mpc thick slice (see Sobacchi & Mesinger Reference Sobacchi and Mesinger2014 for the methodology of the simulation). The figure shows that halos are significantly clustered towards the centre of H ii bubbles (seen as bright white spots) because these halos are the sites of star formation and therefore the sources of ionising radiation. These H ii bubbles have a size of 20–30 Mpc (comoving), corresponding to approximately 10 arcmin on the sky.
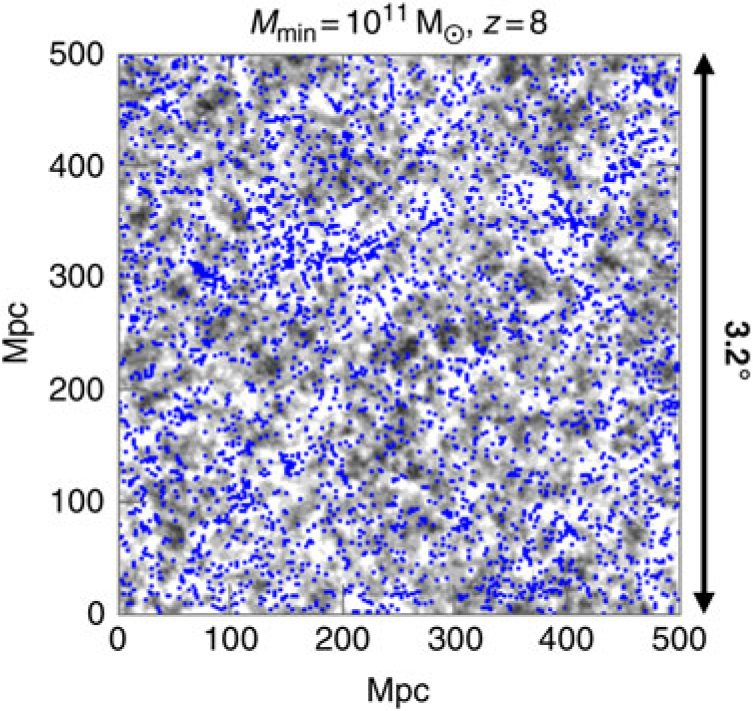
Figure 7. Distribution of dark halos with M h ≥ 1011 M⊙ at z = 8 (blue dots) superimposed on the background ionisation field (grey scale) taken from the simulated tomographic map at z = 8 shown over an area of 500 Mpc (comoving) on a side, which corresponds to 3.2 deg. This map was smoothed over a scale of 30 Mpc. The darker (brighter) regions correspond to more neutral (ionised) regions. Both distributions were projected from a 100-Mpc thick slice at z = 8. The map of ionisation field was produced based on the FULL model of Sobacchi & Mesinger (Reference Sobacchi and Mesinger2014).
Such an SKA H i map can be used in two ways. First, we can look for hyper-luminous galaxies and massive Pop-II forming galaxies inside large H ii bubbles, which mark rare high-σ peaks of the background cosmic density field and harbour many star-forming galaxies. Second, we can search for massive Pop-III forming galaxies around H ii bubbles. The formation of massive Pop III galaxies would require not only pristine metal-free environments (i.e., outside H ii bubbles) but also strong UV radiation to suppress H2/H i cooling and therefore star formation until minihalos are assembled into galaxy-size halos (i.e., around H ii bubbles; see the discussion in Section 3.1).
4.5. Next-generation optical/near-infrared wide-field surveys
If accepted as the ESA M5 mission, SPICA will be launched around 2030. From the SPICA high-redshift science point of view, this lead time will allow us to take advantage of the next-generation optical/near-infrared wide-field surveys for target selection, such as Large Synoptic Survey Telescope (LSST), Euclid, and Wide Field Infrared Survey Telescope (WFIRST). For example, the High Latitude Survey of WFIRST is expected to detect around 100 bright (m 160, AB < 26 mag) galaxies at z > 10 over a survey area of 2 200 deg2 using the continuum drop-out technique (Spergel et al. Reference Spergel2015). Galaxies at such high redshift represent rare peaks in the cosmic density field, marking the underlying regions of large-scale density enhancement, where we can expect the existence of many more objects at the same redshift (e.g., Barkana Reference Barkana2016). z > 10 objects discovered by WFIRST (as well as Euclid) will be strong rest-frame UV-continuum sources, which are likely unobscured star-forming galaxies, but the regions marked by these sources would likely harbour other types of high-redshift objects, such as infrared-luminous (dusty/dust-obscured) galaxies and massive forming galaxies. Grism slitless spectroscopic surveys with Euclid and WFIRST will also discover high-redshift Lyα emitters ((e.g., Bagley et al. Reference Bagley2017; Marchetti, Serjeant, & Vaccari Reference Marchetti, Serjeant and Vaccari2017), some of which may turn out to be genuine Pop III galaxies. These wide-field surveys will also be useful for finding exceptionally bright gravitationally lensed galaxies, which are expected to dominate the WFIRST sample of bright z > 10 galaxies (Spergel et al. Reference Spergel2015).
Another exciting possibility is that these next-generation deep wide-field surveys may detect directly the explosions of massive Pop III SNe, so-called pair-instability SNe (PISNe; see see Appendix B), at z ≲ 7–8 with LSST, out to z ∼ 15–20 with WFIRST, and out to z ≳ 30 with JWSTFootnote k (Whalen et al. Reference Whalen2013a; see also Wang et al. Reference Wang2017). These observations will catch PISNe in the initial UV-bright unobscured phase, and if they are detected and studied, they will help us extend our understanding to the subsequent dust-enshrouded phase, which is directly relevant to SAFARI observations as further discussed in Appendix B. Furthermore, it is possible that some supermassive stars (∼ 105 M⊙) may explode as thermonuclear SNe with energies of ∼ 1055 erg, 100 times higher than those of Pop III PISNe, making them the most energetic explosions in the Universe (Whalen et al. Reference Whalen2013b). Such energetic events, if they exist, may also produce objects that can be studied with SAFARI.
4.6. SPICA/SMI surveys
SPICA /SMI (Kaneda et al. Reference Kaneda2017; Roelfsema et al. Reference Roelfsema2018) has the ability to conduct low-resolution (LR; R = 50–120) multi-slit prism spectroscopy covering 17–36 μm over a field of view of 12 arcmin × 10 arcmin. It also has a slit-viewer camera (CAM), which can perform 34 μm imaging over the same field of view. These SMI modes will allow wide-field survey programs, and some preliminary ideas have been presented in the companion papers, such as the SMI/LR deep (1 deg2) and wide (10 deg2) spectroscopic surveys (Kaneda et al. Reference Kaneda2017) and SMI/CAM ultra-deep (0.2 deg2), deep (1 deg2), and shallow (600 deg2) imaging surveys (Gruppioni et al. Reference Gruppioni2017).
For the purpose of finding bright z > 5 targets for SAFARI, these SMI surveys are particularly effective for detecting AGN-dominated galaxies, which can be substantially brighter than star-forming galaxies in the rest-frame mid-infrared. At z > 5, SMI will observe <6 μm in the rest-frame, where the SEDs of typical star-forming galaxies exhibit a broad trough between a stellar continuum peaking in the near-infrared and a dust continuum peaking in the far-infrared (see Gruppioni et al. Reference Gruppioni2017). In the case of AGN-dominated galaxies, however, a bright power-law AGN continuum could fill this SED trough and could even overwhelm the light from the host galaxy all together. As a result, the SMI-selected sample of z > 5 HyLIRGs is expected to be dominated by galaxies with AGNFootnote l (Gruppioni et al. Reference Gruppioni2017; Kaneda et al. Reference Kaneda2017). Such a sample will be particularly useful for studying the interplay between star formation and black-hole accretion (Spinoglio et al. 1157 Reference Spinoglio2017; Gruppioni et al. Reference Gruppioni2017).
The SMI/CAM 600 deg2 shallow survey offers the potential to discover exceptionally luminous z > 5 galaxies for which SAFARI follow-up spectroscopy will be possible. Unlike submillimetre/millimetre surveys, in which high-redshift galaxies would often stand out in brightness, SMI mid-infrared surveys will see a large number of foreground galaxies, among which a small number of high-redshift objects will be hidden. Selecting z > 5 galaxies will therefore require a detailed analysis of good-quality multi-wavelength data covering the same fields like those mentioned in Section 4.5. Follow-up submillimetre/millimetre observations will especially be useful for discriminating z > 5 galaxies against lower-redshift galaxies.
It should also be noted that the SMI surveys have the potential to identify z > 5 HyLIRGs that may be missing in submillimetre/millimetre surveys. The all-sky mid-infrared survey with the Wide-Field Infrared Survey Explorer (WISE) has discovered hyper-luminous versions of dust-obscured galaxies (DOGs; Dey et al. Reference Dey2008), so-called Hot DOGs, up to a redshift of z = 4.59 (Eisenhardt et al. Reference Eisenhardt2012; Wu et al. Reference Wu2012; Tsai et al. Reference Tsai2015). These mid-infrared-selected Hot DOGs have bolometric luminosities of ≳ 1014 L⊙, as luminous as the brightest submillimetre/millimetre-selected lensed infrared-luminous galaxies listed in Table 1. However, most of these galaxies do not appear to be lensed, suggesting that Hot DOGs are likely dominated by AGN (Tsai et al. Reference Tsai2015). Such AGN-dominated galaxies like Hot DOGs may constitute an important population of infrared-luminous galaxies at high redshift, which may be difficult to detect in the submillimetre/millimetres surveys unless they are also forming stars vigorously. The SMI surveys will be sensitive to this type of AGN-dominated galaxies and can detect them to higher redshift.
5. Summary
SPICA /SAFARI will be a uniquely powerful instrument, allowing us to obtain good-quality rest-frame mid-infrared spectra of z > 5 objects and to bridge the wavelength gap left unexplored by ALMA and JWST, which is so crucial for the studies of the high-redshift Universe. In this paper, we have examined the scientific potential of SAFARI based on recent observational and theoretical studies. The following is a summary of the major points:
1. SAFARI is capable of delivering good-quality rest-frame mid-infrared spectra for HyLIRGs (L IR > 1013 L⊙) at z = 5–10. Currently, there are about a dozen such DSFGs known at z = 5.2–6.9 (mostly lensed) and around 30 quasars at z = 5.0–6.4. The list of potential targets will grow over the coming years in terms of number and redshift range, allowing SAFARI to conduct the first rest-frame mid-infrared spectroscopic survey of z > 5 galaxies in a significant number.
2. To characterise the physical and chemical properties of z > 5 galaxies, especially of those that are infrared-luminous (i.e., dusty/dusty-obscured), SAFARI’s spectroscopic data will be essential, allowing us to examine a wealth of information, such as atomic fine-structure lines, molecular hydrogen lines (H2), PAH features, and silicate emission/absorption features. For example, low-metallicity galaxies will be easily recognised with distinct spectral characteristics such as weak PAH features, strong high-ionisation lines, and a sharply rising mid-infrared continuum as observed in local BCDs.
3. The rest-frame mid-infrared spectral range is particularly powerful for probing the first-generation objects because it contains (1) key cooling lines of low-metallicity or metal-free gas (e.g., [Si II], [Fe II], and H2 lines) and (2) emission features of solid compounds that are likely abundant in the remnants of Pop III SNe (e.g., SiO2; see Appendix B). The feasibility of such SAFARI observations, however, is not yet clear, requiring more theoretical studies for further guidance, especially those focused on the most massive/luminous objects. SAFARI detections of such spectral features, if successful, will open up a new frontier in the study of the early Universe, shedding light on the physical properties of the first galaxies and first stars.
4. SAFARI’s ability to explore the high-redshift Universe will be determined by the availability of sufficiently bright targets, whether intrinsically bright or gravitationally lensed. In this regard, a series of wide-field surveys taking place over the coming decade (e.g., Advanced ACT, SPT3G, LSST, SKA, Euclid, and WFIRST) as well as the SPICA /SMI surveys will greatly enhance our ability to discover extraordinary objects as exciting targets for SAFARI.
If we take various theoretical predictions at their face value, there will not be many first-generation objects that are bright enough for SAFARI to detect and study. However, it should also be remembered that among the hundreds of millions of objects that the Sloan Digital Sky Survey (SDSS) has catalogued, it only took the detections of a handful of z ≳ 6 quasars to completely change the landscape in extragalactic astronomy and open up our view towards the epoch of reionisation (Fan et al. Reference Fan2001). With so many powerful wide-field surveys on the horizon, which will explore a new parameter space in terms of sensitivity and area coverage, we may be on the verge of witnessing some totally unexpected discoveries, which have always been the driver for astronomy. With its expected launch around 2030, SPICA is ideally positioned to take full advantage of these upcoming wide-field surveys and their surprising discoveries.
Author ORCIDs
E. Egami, http://orcid.org/0000-0003-1344-9475; S. Gallerani, http://orcid.org/0000-0002-7200-8293; Andrea Pallottini, http://orcid.org/0000-0002-7129-5761; J. A. Fernández-Ontiveros, http://orcid.org/0000-0001-9490-899X; C. Gruppioni, http://orcid.org/0000-0002-5836-4056.
Acknowledgements
This paper is dedicated to the memory of Bruce Swinyard, who initiated the SPICA project in Europe, but unfortunately passed away on 2015 May 22 at the age of 52. He was ISO -LWS calibration scientist, Herschel -SPIRE instrument scientist, first European PI of SPICA, and first design lead of SAFARI. E. E. would like to thank Scuola Normale Superiore (Pisa, Italy) for hosting his visit to discuss this work, and Justin Spilker for providing information on some of the z > 5 SPT galaxies. He would also like to thank Leon Koopmans, Jianwei Lyu, and Fengwu Sun for helpful discussions. L. V. acknowledges funding from the European Union’s Horizon 2020 research and innovation programme under the Marie Skłodowska-Curie Grant Agreement No. 746119. F. N. acknowledges financial support through Spanish grants ESP2015-65597-C4-1-R and ESP2017-86582-C4-1-R (MINECO/FEDER), and PGP-G acknowledges support from the Spanish Government grant AYA2015-63650-P. The research leading to these results has received funding from the European Research Council under the European Union Seventh Framework Programme (FP/2007-2013)/ERC Grant Agreement no. 306476.
Appendix A. H2 Emission: simulation for a z ⋍ 6 LBG
Here, we use the model presented by Pallottini et al. (Reference Pallottini, Ferrara, Bovino, Vallini, Gallerani, Maiolino and Salvadori2017b) as an example to illustrate the basic properties of the warm H2 gas component in a typical z ⋍ 6 LBG. The modelling methodology is fully described by Vallini et al. (Reference Vallini, Ferrara, Pallottini and Gallerani2017), Pallottini et al. (Reference Pallottini, Ferrara, Bovino, Vallini, Gallerani, Maiolino and Salvadori2017b), and Vallini et al. (Reference Vallini, Pallottini, Ferrara, Gallerani, Sobacchi and Behrens2018). The target halo has a mass M h ⋍ 1011 M⊙ and hosts a galaxy with a stellar mass M* ⋍ 1010 M⊙ and SFR of about 100 M⊙ yr−1, consistent with typical z ∼ 6 LBGs (cf., Capak et al. Reference Capak2015; Jiang et al. Reference Jiang2016). Following the convention of Pallottini et al. (Reference Pallottini, Ferrara, Bovino, Vallini, Gallerani, Maiolino and Salvadori2017b), we refer to this particular simulated galaxy as ‘Althæa’.
The H2 emission maps of Althæa are shown in Figure 8. It has a total H2 mass of about 108 M⊙, which is seen to be mainly concentrated in a disk-like structure (effective radius ⋍ 0.5 kpc) that is pressure supported by radiation and composed of dense (n ≳ 102.5 cm−3), metal-rich (Z ⋍ 0.5 Z⊙) gas. The most luminous pure-rotational H2 lines are the 0–0 S(1) line at 17 μm and 0–0 S(0) line at 28 μm. About 95% of the H2 gas is characterised by a temperature of T ⋍ 100 K, while 1% (4%) has T ⋍ 1 000 K (20 K). Because of the dominance of the ⋍ 100 K component, 0–0 S(0) and 0–0 S(1) transitions are the brightest, even though their oscillator strengths are small. The spatially integrated luminosity of 0–0 S(1), the brightest H2 line emitted by Althæa, is 3.3 × 10⁶ L⊙, a factor of ∼500 below the SAFARI detection limit of 1.6 × 10⁹ L⊙ at z = 6 (5σ, 10 h).
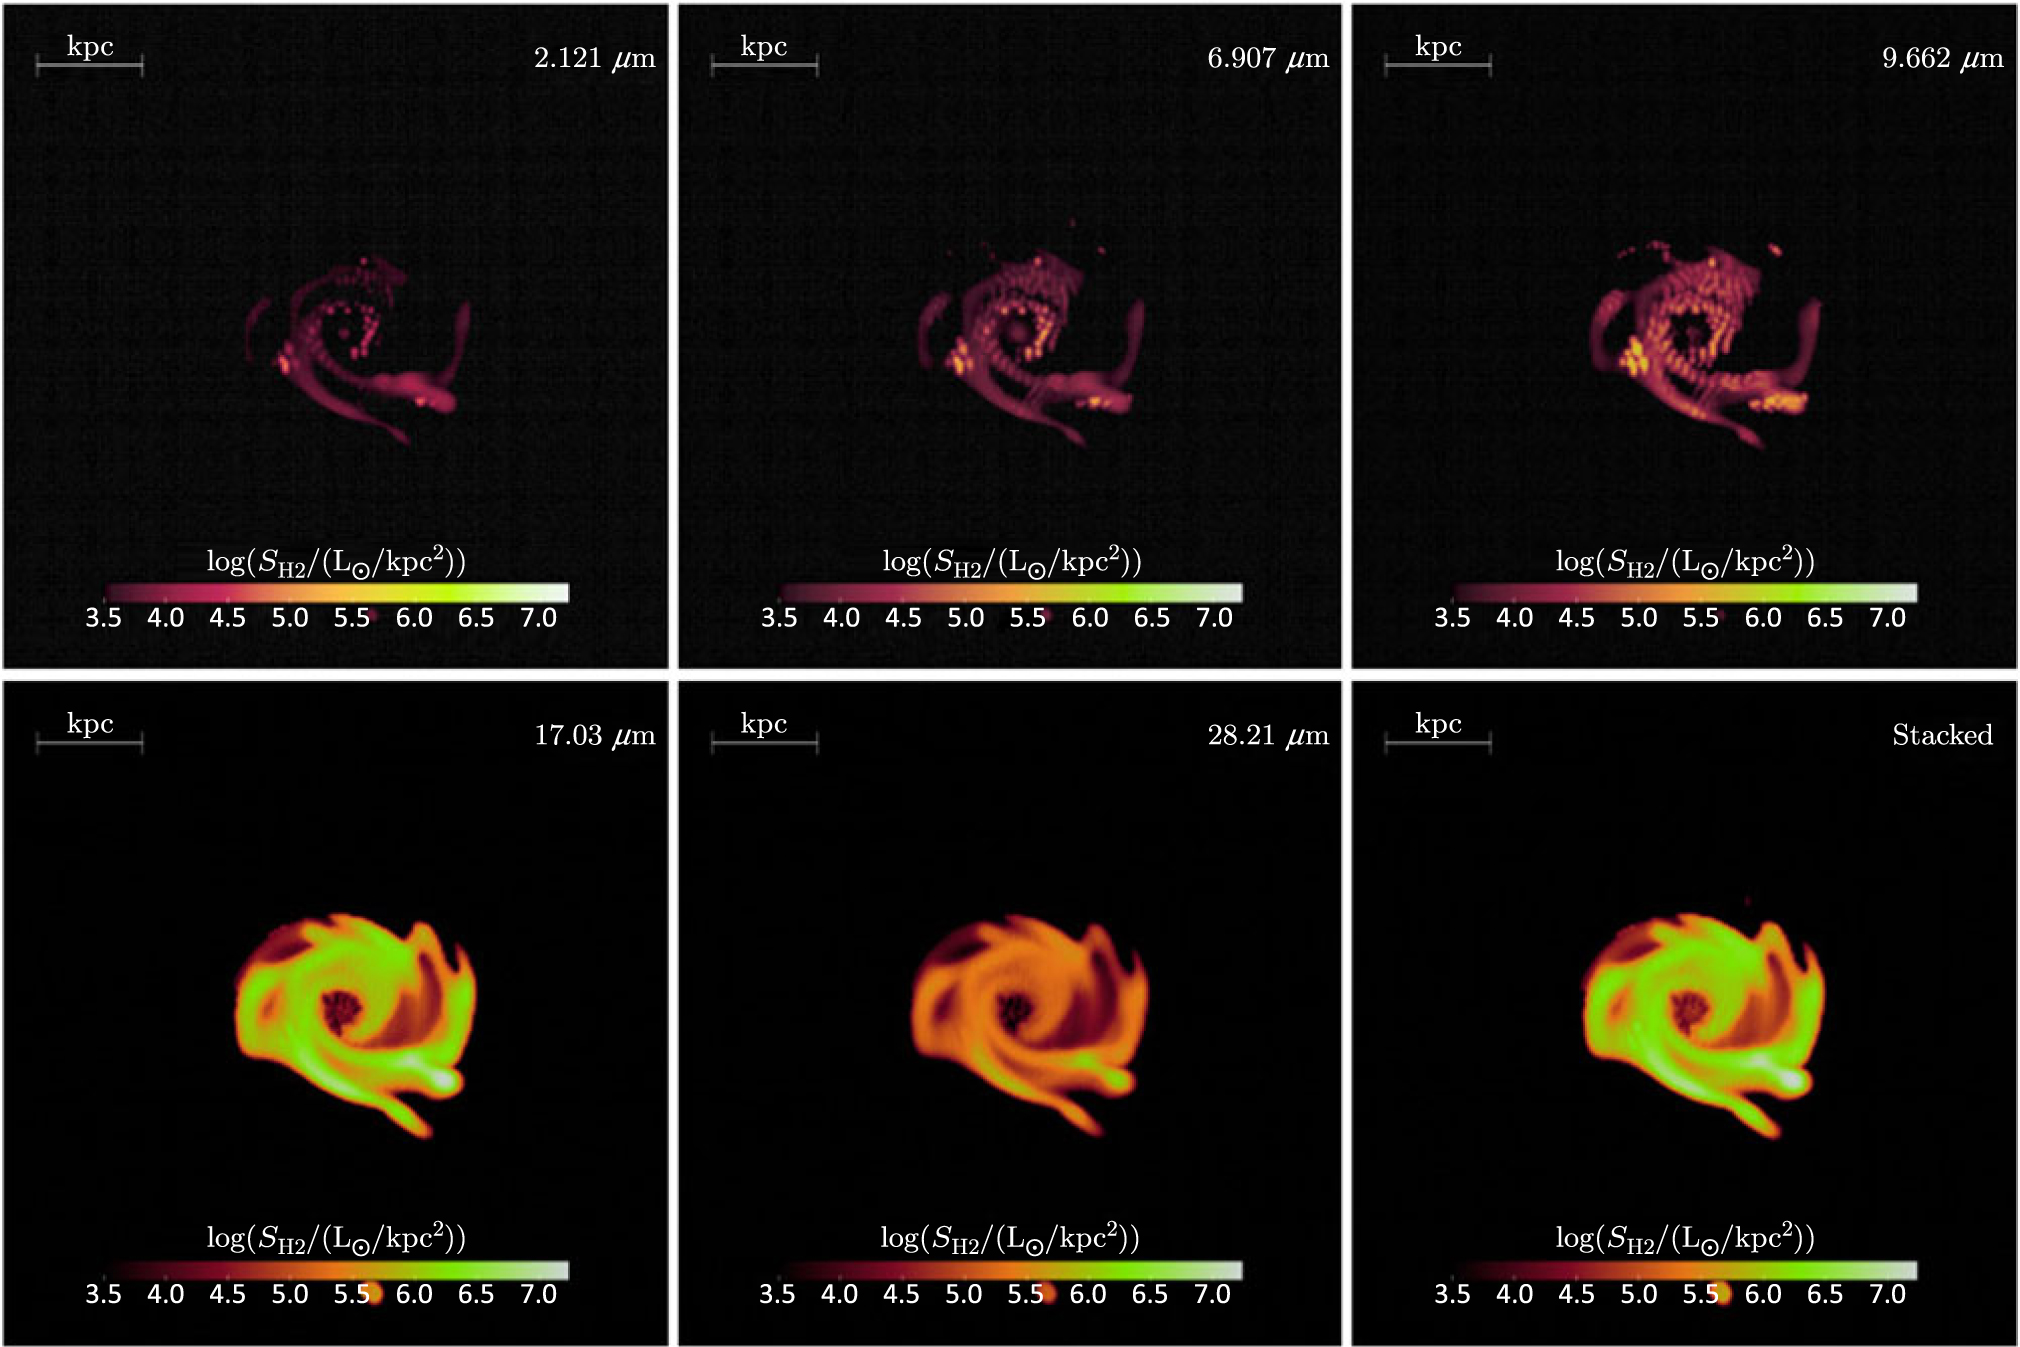
Figure 8. Synthetic H2 line emission for the z = 6 galaxy Althæa (Pallottini et al. Reference Pallottini, Ferrara, Bovino, Vallini, Gallerani, Maiolino and Salvadori2017b). The lines shown are (from top left to bottom right) 1–0 S(1) 2.12 μm, 0–0 S(5) 6.91 μm, 0–0 S(3) 9.66 μm, 0–0 S(1) 17.0 μm, and 0–0 S(0) 28.2 μm. The last panel at bottom right shows the stacked sum of all the lines, which is dominated by the 0–0 S(1) line.
Appendix B. Formation of the first dust
The first stars are predicted to be very massive, possibly with masses over 100 M⊙ (e.g., Abel, Bryan, & Norman Reference Abel, Bryan and Norman2002; Bromm, Coppi, & Larson Reference Bromm, Coppi and Larson2002; Omukai & Palla Reference Omukai and Palla2003). Given that the initial mass function (IMF) of Pop III stars was likely top-heavy and extending to >100 M⊙ (e.g., Hirano et al. Reference Hirano, Hosokawa, Yoshida, Omukai and Yorke2015; Stacy, Bromm, & Lee Reference Stacy, Bromm and Lee2016), among the main contributors of dust in the early Universe were likely the so-called pair-instability SNeFootnote m (PISNe), whose progenitors have main-sequence masses in the range of 140–260 M⊙ (Heger & Woosley Reference Heger and Woosley2002). Pop III stars in the mass ranges just above (>260 M⊙) or below (40–140 M⊙) are thought to collapse directly into black holes, locking inside all the nucleosynthesis products, while those in the 140–260 M⊙ range are thought to end their lives as PISNe with powerful explosions, leaving no compact remnant behind and ejecting 15–30% of the PISN progenitor mass as dust (30–60 M⊙ per star) into the surroundings (Nozawa et al. Reference Nozawa, Kozasa, Umeda, Maeda and Nomoto2003; Schneider, Ferrara, & Salvaterra Reference Schneider, Ferrara and Salvaterra2004; Cherchneff & Dwek Reference Cherchneff and Dwek2010). Considering such a large dust production rate of PISNe, which is >10 times larger than the value for typical core-collapse (i.e., Type II) SNe, it is conceivable that clusters of Pop III stars would quickly enshroud themselves with dust and become strong mid-infrared sources as PISNe explode and the yet-to-explode less massive stars shine and heat the ejected dust. If such a scenario is correct, this implies that a significant fraction of Pop III star clusters may be faint in the optical/near-infrared (i.e., rest-frame UV/optical) but bright in the far-infrared (i.e., rest-frame mid-infrared). Far-infrared spectroscopy of such dust-enshrouded Pop III star clusters could detect spectral features produced by the first dust, revealing its composition and production mechanisms.
Observations of young supernova remnants in the Milky Way and in the Large Magellanic Cloud have provided evidence that dust can form in the ejecta a few hundred days after the explosion (e.g. Matsuura et al. Reference Matsuura2009; Dunne et al. Reference Dunne2009; Gall et al. Reference Gall2014; Matsuura et al. Reference Matsuura2015; De Looze et al. Reference De Looze, Barlow, Swinyard, Rho, Gomez, Matsuura and Wesson2017; Temim et al. Reference Temim, Dwek, Arendt, Borkowski, Reynolds, Slane, Gelfand and Raymond2017). Theoretical models are able to reproduce the observational data (Bocchio et al. Reference Bocchio, Marassi, Schneider, Bianchi, Limongi and Chieffi2016) and show that, depending on the progenitor mass and metallicity, a variety of dust species can form (Todini & Ferrara Reference Todini and Ferrara2001; Schneider et al. Reference Schneider, Ferrara and Salvaterra2004; Nozawa et al. Reference Nozawa, Kozasa, Habe, Dwek, Umeda, Tominaga, Maeda and Nomoto2007; Bianchi & Schneider Reference Bianchi and Schneider2007; Cherchneff & Dwek Reference Cherchneff and Dwek2010; Marassi et al. Reference Marassi, Chiaki, Schneider, Limongi, Omukai, Nozawa, Chieffi and Yoshida2014, Reference Marassi, Schneider, Limongi, Chieffi, Bocchio and Bianchi2015; S. Marassi et al., in preparation; Sarangi & Cherchneff Reference Sarangi and Cherchneff2015).
Since dust grains condense out of metals freshly synthesised by the stellar progenitor, the process is expected to work even at very high redshifts, right after the formation of the first generation of Pop III stars (Todini & Ferrara Reference Todini and Ferrara2001; Schneider et al. Reference Schneider, Ferrara and Salvaterra2004; Nozawa et al. Reference Nozawa, Kozasa, Habe, Dwek, Umeda, Tominaga, Maeda and Nomoto2007; Marassi et al. Reference Marassi, Chiaki, Schneider, Limongi, Omukai, Nozawa, Chieffi and Yoshida2014, Reference Marassi, Schneider, Limongi, Chieffi, Bocchio and Bianchi2015). While the validity of these predictions relies on extrapolations of models that have been shown to work at Z ≥ 0.4 Z⊙ (Bocchio et al. Reference Bocchio, Marassi, Schneider, Bianchi, Limongi and Chieffi2016), indirect support for an early phase of rapid dust enrichment comes from the analysis of the large dust masses detected in the host galaxies of the first quasars (Valiante et al. Reference Valiante, Schneider, Bianchi and Andersen2009, Reference Valiante, Schneider, Salvadori and Bianchi2011, Reference Valiante, Schneider, Salvadori and Gallerani2014) and in the colour evolution of normal star-forming galaxies at z > 6 (Mancini et al. Reference Mancini, Schneider, Graziani, Valiante, Dayal, Maio, Ciardi and Hunt2015, Reference Mancini, Schneider, Graziani, Valiante, Dayal, Maio and Ciardi2016), as well as from the measurements of dust extinction in z > 4 quasars (e.g., Maiolino et al. Reference Maiolino, Schneider, Oliva, Bianchi, Ferrara, Mannucci, Pedani and Roca Sogorb2004; Gallerani et al. Reference Gallerani2010). In addition, dust enrichment by Pop III SNe increases gas cooling at very low metallicity, opening a formation pathway to the first low-mass stars (Schneider et al. Reference Schneider, Omukai, Inoue and Ferrara2006b, Reference Schneider, Omukai, Bianchi and Valiante2012a, Reference Schneider, Omukai, Limongi, Ferrara, Salvaterra, Chieffi and Bianchi2012b) and matching the constraints from stellar archaeology studies (De Bennassuti et al. Reference De Bennassuti, Schneider, Valiante and Salvadori2014, Reference De Bennassuti, Salvadori, Schneider, Valiante and Omukai2017).
Dust enrichment by Pop III SNe occurs on very short timescales, comparable to the stellar evolutionary timescale of the most massive SN progenitor present in the Pop III star cluster. This, in turn, depends on the Pop III IMF, which is still very poorly constrained by ab-initio simulations (Hirano et al. Reference Hirano, Hosokawa, Yoshida, Omukai and Yorke2015; Stacy et al. Reference Stacy, Bromm and Lee2016). Dust production starts to affect the colours of Pop III galaxies a few Myrs after star formation, when PISNe from 140–260 M⊙ stars or core-collapse SNe with M < 40 M⊙ release their chemical yields into the surrounding medium.
By combining a Pop III stellar population synthesis model (e.g., Zackrisson et al. Reference Zackrisson, Rydberg, Schaerer, Östlin and Tuli2011) with dust production models of Pop III SNe, such as that of Schneider et al. (Reference Schneider, Ferrara and Salvaterra2004) for PISNe and Marassi et al. (Reference Marassi, Schneider, Limongi, Chieffi, Bocchio and Bianchi2015) for Type-II SNe, it is possible to calculate the infrared spectral evolution of a Pop III star cluster and examine its spectral characteristics (R. Schneider et al., in preparation). In the rest-frame mid-infrared range, particularly prominent will be quartz (SiO2) emission features at 9, 12.4, and 21.5 μm, which can be quite strong because quartz is expected to be one of the most abundant solid compounds formed in the ejecta of PISNe (e.g., Nozawa et al. Reference Nozawa, Kozasa, Umeda, Maeda and Nomoto2003; Schneider et al. Reference Schneider, Ferrara and Salvaterra2004). Note that the detection of such spectral features, if successful, will allow us to investigate directly the properties of the first dust freshly produced by the first generation of SNe.
For SAFARI to be able to make such detection, the target Pop III star cluster needs to be extremely luminous. In practice, this would mean that the target star cluster must be maximally massive (the limit is thought to be ∼105 − 106 M⊙), very young (ages up to a few/several Myr), and gravitationally lensed by a large factor (⨠100×). The detectability of such a luminous lensed Pop III star cluster was discussed by Zackrisson et al. (Reference Zackrisson, González, Eriksson, Asadi, Safranek-Shrader, Trenti and Inoue2015). Considering the challenge of detecting such Pop III objects at high redshift, an alternative approach may be to search for lower-redshift analogues (see Section 3.3).


