


Introduction
Bipolar disorder (BD) is uniquely characterized by fluctuations of opposing moods (mania/hypomania and depression) as well as shifts between pathologic and euthymic states (Harrison, Geddes, & Tunbridge, Reference Harrison, Geddes and Tunbridge2018). Depression is typically characterized by a mood bias toward negative affect (NA) and loss of interest, while mania or hypomania is characterized by an elevated, expansive, or irritable mood. Without appropriate mood stabilizing treatments, patients may experience extreme emotional fluctuations (Phillips & Kupfer, Reference Phillips and Kupfer2013). Notably, the pathophysiology underlying mood instability, mood switching, and the development of extreme mood states is less well understood (Strakowski et al., Reference Strakowski, Adler, Almeida, Altshuler, Blumberg, Chang and Townsend2012). Several models (Harrison et al., Reference Harrison, Geddes and Tunbridge2018; Magioncalda & Martino, Reference Magioncalda and Martino2022; Mason, Eldar, & Rutledge, Reference Mason, Eldar and Rutledge2017; Northoff et al., Reference Northoff, Magioncalda, Martino, Lee, Tseng and Lane2018; Rantala, Luoto, Borraz-Leon, & Krams, Reference Rantala, Luoto, Borraz-Leon and Krams2021) have been proposed to understand the neurobiology of BD at the cellular, system, and population levels. These findings emphasize the importance of exploring the neural basis related to different mood states to provide novel insights into BD pathogenesis.
Over the years, an abundance of research has implicated abnormal activation related to specific mood state in a multitude of brain regions, including the amygdala, hippocampus, ventral striatum, and anterior cingulate cortex, as well as ventrolateral and dorsolateral prefrontal cortex, particularly in response to emotion processing and regulation paradigms (Cotovio & Oliveira-Maia, Reference Cotovio and Oliveira-Maia2022; Townsend & Altshuler, Reference Townsend and Altshuler2012). These studies, especially those that include patients in different mood states simultaneously within a single sample, suggest trait-related abnormalities in the limbic-striatal circuit (Chen et al., Reference Chen, Lennox, Jacob, Calder, Lupson, Bisbrown-Chippendale and Bullmore2006; Hulvershorn et al., Reference Hulvershorn, Karne, Gunn, Hartwick, Wang, Hummer and Anand2012) during emotional tasks and in the medial frontal cortex (Pomarol-Clotet et al., Reference Pomarol-Clotet, Alonso-Lana, Moro, Sarro, Bonnin, Goikolea and Salvador2015) and dorsolateral prefrontal cortex (Townsend, Bookheimer, Foland-Ross, Sugar, & Altshuler, Reference Townsend, Bookheimer, Foland-Ross, Sugar and Altshuler2010) during cognitive tasks. Findings of state-specific abnormalities, on the other hand, remain heterogenous and difficult to compare among different studies or to interpret across studies, partly due to paradigm differences (Phillips & Swartz, Reference Phillips and Swartz2014). Thus, earlier findings support the role of corticolimbic circuit in the abnormal emotional regulation that underpins mood instability in BD but state-dependent functional changes yet remained ambiguous.
Building upon earlier regional functional findings, some studies have examined shared and specific abnormal localized networks in the amygdala (Brady, Margolis, Masters, Keshavan, & Ongur, Reference Brady, Margolis, Masters, Keshavan and Ongur2017; Brady et al., Reference Brady, Masters, Mathew, Margolis, Cohen, Ongur and Keshavan2016; Li et al., Reference Li, Huang, Deng, Ma, Han, Wang and Li2015; Wei et al., Reference Wei, Geng, Jiang, Zhou, Chang, Zhou and Wang2017), striatum (Altinay, Hulvershorn, Karne, Beall, & Anand, Reference Altinay, Hulvershorn, Karne, Beall and Anand2016; Shi et al., Reference Shi, Guo, Liu, Xue, Fan, Fan and Tan2020; Xi et al., Reference Xi, Lai, Du, Ng, Jiang, Wu and Hu2021), and inferior frontal gyrus (Yu et al., Reference Yu, Li, Meng, Li, Wei, Li and Li2021; Zhang et al., Reference Zhang, Li, Wang, Bai, Ji, Wang and Tian2020) underlying (hypo)manic or depressive state. However, focusing solely on a priori corticolimbic regions of interest (ROI) may limit inferences about potential roles of other neural circuitries (Phillips & Swartz, Reference Phillips and Swartz2014). Further research using a broader perspective, such as global network approaches, may expand the scope of our understanding of the neural substrates related to mood states (Chase & Phillips, Reference Chase and Phillips2016; Yoon, Kim, Kim, & Lyoo, Reference Yoon, Kim, Kim and Lyoo2021). For this reason, several studies have examined large-scale functional brain network alterations across mood states and the results support the significant roles of functional brain networks (Vargas, Lopez-Jaramillo, & Vieta, Reference Vargas, Lopez-Jaramillo and Vieta2013). Prominent among these are reports of the default mode network (DMN), ventral attention network (VAN), frontoparietal network (FPN), and limbic network (LN) (Claeys, Mantingh, Morrens, Yalin, & Stokes, Reference Claeys, Mantingh, Morrens, Yalin and Stokes2022; Wang et al., Reference Wang, Gao, Tang, Lu, Zhang, Bu and Huang2020; Yoon et al., Reference Yoon, Kim, Kim and Lyoo2021). Stability of the DMN, FPN, and VAN was posited as a possible state marker for euthymia (Syan et al., Reference Syan, Smith, Frey, Remtulla, Kapczinski, Hall and Minuzzi2018a). With graph theory approach, brain network disturbances were fractionated into components associated with (hypo)manic and depressive symptoms, centered in left superior frontal gyrus and right middle orbitofrontal cortex, respectively (Spielberg et al., Reference Spielberg, Beall, Hulvershorn, Altinay, Karne and Anand2016). Pioneer work from Northoff et al. observed decreased intra-network functional connectivity (FC) and neuronal variability in the DMN during mania and in the somatosensory network (SMN) during depression (Magioncalda et al., Reference Magioncalda, Martino, Conio, Escelsior, Piaggio, Presta and Amore2015; Martino et al., Reference Martino, Magioncalda, Huang, Conio, Piaggio, Duncan and Northoff2016; Russo et al., Reference Russo, Martino, Magioncalda, Inglese, Amore and Northoff2020).
Thus far, evidence supports the existence of functional network alterations across mood states, but the nature of such alterations and the extent to which such alterations produce mood switching remain to be further explored (Phillips & Swartz, Reference Phillips and Swartz2014). The cause for ambiguity in previous findings may lay on the following reasons. First, there are few extant studies that compared the (hypo)manic, depressive, and euthymic states in parallel within one sample, with a particular lack of studies that intentionally employ replication analyses. Previous evidence has proposed that functional disturbances are highly sensitive to current mood states (Strakowski et al., Reference Strakowski, Adler, Almeida, Altshuler, Blumberg, Chang and Townsend2012). Despite the absence of acute episodes, euthymic patients may experience persistent mood instability (Harrison et al., Reference Harrison, Geddes and Tunbridge2018). Therefore, it is advantageous to include euthymic state to investigate this ‘real-world’ phenotype of BD. Second, cross-sectional studies of BD patients in different mood states cannot completely address within-subject variations in phenotype (Perry, Roberts, Mitchell, & Breakspear, Reference Perry, Roberts, Mitchell and Breakspear2019). The within-subject design has the potential to identify neural basis that better reflects pathophysiological processes underlying mood switching in BD. Third, one of the key implications of network-based studies is the identification of specific brain region related to mood instability. However, there are relatively small number of studies employing graph-theoretical approach, which may better capture local changes in a global network manner (which survive across all nodes) (Perry et al., Reference Perry, Roberts, Mitchell and Breakspear2019). Hence, topological nodal properties deserve further exploration to determine the nature of brain network changes across mood states in BD.
In this study, we aimed to investigate functional brain network changes across three mood states and potential connectors in shifts between mood states in BD. Specifically, we examined large-scale brain network FC alterations and topological nodal properties of brain regions. First, we investigated the large-scale brain network alterations related to mood state using a cross-sectional case–control design. We recruited BD patients in depressive state (BDD), in hypomanic/manic state (BDM), and in euthymic state (BDE) and healthy controls (HCs). Second, we recruited a small longitudinal sample to examine the ‘group-to-individual’ generalizability of mood-state-related findings in the cross-sectional sample. Third, we described the relationship between mood-state-related network alterations and emotional symptoms. Fourth, we examined topological nodal properties of brain regions using graph theory-based approaches as exploratory analysis. We hypothesized that a large-scale network perspective and a combination of case–control and longitudinal design would allow better demonstration of the state-related neural signature and a graph-theoretical approach would provide insight into potential connectors related to mood switching.
Methods
Participants
BD patients aged 18–55 years were recruited from the Outpatient Department of Peking University Sixth Hospital. Diagnoses were confirmed according to Diagnostic and Statistical Manual of Mental Disorders (DSM-IV-TR) criteria for BD by two qualified psychiatrists using the Mini-International Neuropsychiatric Interview (M.I.N.I.) (Sheehan et al., Reference Sheehan, Lecrubier, Sheehan, Amorim, Janavs, Weiller and Dunbar1998). BD patients with a diagnosis of the rapid cycling disorder subtype or current mixed episode were excluded from the study. Symptom severity was assessed using the 17-item Hamilton Rating Scale for Depression (HRSD-17) (Hamilton, Reference Hamilton1960) and Young Mania Rating Scale (YMRS) (Young, Biggs, Ziegler, & Meyer, Reference Young, Biggs, Ziegler and Meyer1978). BDD patients were required to have HRSD-17 ⩾ 17 and YMRS ⩽ 10 (Spielberg et al., Reference Spielberg, Beall, Hulvershorn, Altinay, Karne and Anand2016) and BDM patients to have HRSD-17 < 17 and YMRS > 10 (Hulvershorn et al., Reference Hulvershorn, Karne, Gunn, Hartwick, Wang, Hummer and Anand2012). BDE patients were required to have had no episodes of illness for at least 2 months and to have HRSD-17 ⩽ 7 and YMRS ⩽ 5. Emotion level was measured using the self-rated Positive And Negative Affect Schedule (PANAS) (Watson, Clark, & Tellegen, Reference Watson, Clark and Tellegen1988), and a well-validated self-report of current mood state (i.e. defined as past 2 weeks in this study) was administered on the day before scanning. The PANAS contains 10 positive affect (PA) and 10 NA items to assess opposing valences of affect. Heathy controls matched by sex/age/educational years were recruited from the local community, with the following criteria: aged 18–55 years, no personal or family history of any psychiatric disorder, and no history of psychotropic drug use.
Considering that the findings related to (hypo)mania were observed in the cross-sectional sample, we recruited a longitudinal sample. BD patients were assessed and scanned twice, during a (hypo)manic episode and a non-(hypo)manic episode, respectively, to examine whether the findings would be replicated within-subject. Diagnoses were confirmed and symptom severity was assessed as described above. During the (hypo)manic episode, these participants were required to fulfill the same criteria for symptom severity as BDM patients at the time of imaging. They fulfilled the criteria for symptom severity for BDD or BDE patients during the non-(hypo)manic episode. There was no overlap of participants between the two samples.
Further exclusion criteria for all participants included: serious physical illness, current pregnancy or breast feeding, alcohol/substance misuse in the last 12 months, electroconvulsive therapy in the last 6 months, acute suicidal ideation or behavior, and any contraindications to magnetic resonance imaging (MRI) scanning. The authors assert that all procedures contributing to this work comply with the ethical standards of the relevant national and institutional committees on human experimentation and with the Helsinki Declaration of 1975, as revised in 2008. The study was approved by the independent Ethics Committee of Peking University Sixth Hospital and written informed consent was obtained from all participants before data collection.
MRI acquisition and preprocessing
MRI data were acquired on a 3-Tesla Siemens Trio MR scanner in the 306th Hospital. Functional images were collected using an echo-planar imaging sequence (repetition time [TR], 2 s; echo time [TE], 30 ms; slice thickness, 4 mm; 30 slices; 210 volumes) and structural images were collected using T1-weighted, magnetization-prepared, rapidly acquired gradient-echo sequence (TR, 2.3 s; TE, 3.01 ms; slice thickness, 1 mm; 176 sagittal slices). To minimize head motion effects on the data, we set an rigorous exclusion criterion for head motion (max translation >3 mm in each direction, max rotation >3° in each direction, mean frame-wise displacement [FD, measured by Jenkinson method; Jenkinson, Bannister, Brady, & Smith, Reference Jenkinson, Bannister, Brady and Smith2002] >0.3 mm). Participants with over-threshold head motion were excluded. The details of MRI data acquisition and preprocessing are shown in online Supplementary methods.
Construction of FC matrix
Blood oxygen level-dependent signals were extracted from 400 ROIs according to the Schaefer's 400 brain atlas (Schaefer et al., Reference Schaefer, Kong, Gordon, Laumann, Zuo, Holmes and Yeo2018). We computed the Pearson correlation in the functional MRI time-series between all pairs of brain regions. The Pearson correlation coefficients were transformed to z-scores using the Fisher r-to-z formula. This yielded a 400 × 400 FC matrix for each subject for subsequent analyses (Fig. 1a).

Figure 1. Schematic overview of the processing and analysis procedure. (a) Construction of FC matrix: the brain was divided into 400 regions based on the Shaeffer's 400 atlas to produce a 400 × 400 matrix for each subject. (b) Construction of large-scale brain network connectivity matrixes according to Yeo et al. based on the FC matrixes. (c) Calculation of topological nodal properties for each brain region. (d) Cross-sectional investigation of mood-state-related functional network alterations. (e) Longitudinal investigation of mood-state-related functional network alterations. (f) Schematic illustration for relationship between mood-state-related network FC and emotional symptoms. (g) Nodal metric comparison among the BDD, BDM, BDE patients, and HCs.
According to Yeo et al. (Reference Yeo, Krienen, Sepulcre, Sabuncu, Lashkari, Hollinshead and Buckner2011), the 400 brain regions were classified into 7 networks: visual network (VN), SMN, dorsal attention network (DAN), VAN, LN, FPN, and DMN (Fig. 1b). We averaged the FC z-scores in the same between-network or in the same within-network to generate a large-scale network FC map, i.e. a 7 × 7 FC matrix. The lower triangle of this matrix was considered in subsequent analyses.
Nodal metric calculation
To examine which brain regions may constitute potential connectors, we calculated the nodal metric, degree, for each of the 400 ROIs (Fig. 1c; Yang et al., Reference Yang, Zhu, Yan, Peng, Bagonis, Laurienti and Wu2021a). Degree is one popular measurement to select a set of highly connected nodes (Yang et al., Reference Yang, Zhu, Yan, Peng, Bagonis, Laurienti and Wu2021a). Weighted degree was the sum of links’ weights connected to a node (Rubinov & Sporns, Reference Rubinov and Sporns2010), defined as

wij was the connection weights between nodes i and nodes j. N was the set of all nodes in the network. We applied a sparsity threshold to the FC matrixes (matrix size 400 × 400), which was defined as the ratio of the number of existing edges divided by the maximum possible number of edges in the FC matrix. Instead of selecting a single threshold, we computed nodal degree across a range of sparsities to alleviate the effects of thresholding on the final topological metric (Fornito, Zalesky, & Breakspear, Reference Fornito, Zalesky and Breakspear2013). The sparsity threshold was set ranged from 0.10 to 0.34, with an interval of 0.01. With this strategy, the thresholded network was estimable for small-worldness (Zhang et al., Reference Zhang, Wang, Wu, Kuang, Huang, He and Gong2011) and less affected by the head motion of participants (Yang et al., Reference Yang, Chen, Chen, Li, Li, Castellanos and Yan2021b). The area under the curve (AUC) across the sparsity range was computed. The AUC was selected for statistical analyses because of its superior sensitivity (Achard & Bullmore, Reference Achard and Bullmore2007).
Statistical analysis
Large-scale network FC comparison and correlation analyses
To examine the brain functional changes related to mood state, we initially examined the between-group differences in network FC map among the BDD, BDM, BDE patients, and HCs (Fig. 1d) using analysis of covariance (ANCOVA) with sex, age, educational years, and mean FD as covariates. The education attainment was controlled for the potential impact on brain structure and network organization (Chan et al., Reference Chan, Han, Carreno, Zhang, Rodriguez, LaRose and Wig2021; Persson & Andersson, Reference Persson and Andersson2022). A subsidiary analysis to control for potential medication effects was conducted by entering the number of different treatments as covariates. False discovery rate (FDR) correction was applied to control for multiple comparisons. For those network FCs survived FDR correction, we conducted post hoc analyses using two-sample t tests with Bonferroni correction.
To validate our findings of (hypo)mania-related functional network alterations in a within-subject design (Fig. 1e), we examined differences between (hypo)manic episode and non-(hypo)manic episode by running a linear mixed effect model in R: network FC ~ 1 + episode + order + episode:order + duration + age + sex + education + mean FD + (1|subject). The fixed factor ‘order’, which quantifies the scanning order, and the order × episode interaction were tested to account for the effect of the order between episodes. FDR correction was performed.
For those network FCs which survived FDR correction based on the Shaeffer's 400 atlas and on the Dosenbach's 160 atlas (described below), we performed partial correlation analyses between these FCs and depressive/manic symptom scores, as well as between these FCs and PANAS-PA/PANAS-NA scores (Fig. 1f), controlling for sex, age, educational years, and mean FD. FDR correction was performed.
Nodal metric comparison and correlation analyses
The AUC of degree was compared among the four groups (Fig. 1g) using ANCOVA with sex, age, educational years, and mean FD as covariates. FDR correction was applied. Post hoc analyses were performed with Tukey correction.
To examine the clinical correlation of the significant region, we extracted the AUC values of degree in those significant regions and performed partial correlation analyses between these AUC values and clinical measurement scores described above, controlling for sex, age, education years, and mean FD. FDR correction was performed.
Methodological validations on large-scale network connections
To minimize the impact of methodological issues on the main analyses, we replicated the cross-sectional and longitudinal network FC comparison analyses in two ways (see details in online Supplementary methods): using scrubbing method during MRI processing procedures to minimize the head motion effect on network connections and using the Dosenbach's 160 brain atlas (Dosenbach et al., Reference Dosenbach, Nardos, Cohen, Fair, Power, Church and Schlaggar2010) to validate our findings on network FC.
Results
Demographic and clinical characteristics
One hundred and seventy-four BD patients (70 BDD, 34 BDM, and 70 BDE) and 80 HCs were recruited. Twelve patients (5 BDD, 1 BDM, and 6 BDE) were excluded for excessive head motion. Overall, 65 BDD, 33 BDM, and 64 BDE were analyzed in the cross-sectional sample and 11 BD patients were analyzed in the longitudinal sample. Among the 33 BDM subjects, 16 were manic and 17 were hypomanic. Online Supplementary Tables S1 and S2 list the demographic and clinical characteristics of the cross-sectional and longitudinal samples. No significant differences were found in age, sex, educational years, and mean FD value. Notably, both BDD and BDM subjects had higher PANAS-NA scores than the BDE patients, with BDD patients having the highest PANAS-NA scores. BDE patients were more likely to be prescribed mood stabilizers and BDD patients were more likely to be prescribed antidepressants. The proportion of patients who were not taking medications was greater in patients in acute episodes of (hypo)mania or depression.
Alterations in large-scale network connections
As shown in online Supplementary Table S3 and Fig. 2a, significant differences among BDD, BDM, BDE patients, and HCs were observed in 13 between-network FCs, including VN-DAN, VN-LN, VN-FPN, LN-SMN, LN-VAN, FPN-VAN, FPN-LN, DMN-VN, DMN-SMN, DMN-DAN, DMN-VAN, DMN-LN, and DMN-FPN, and 3 within-network FCs, i.e. within VN, LN, and DMN.
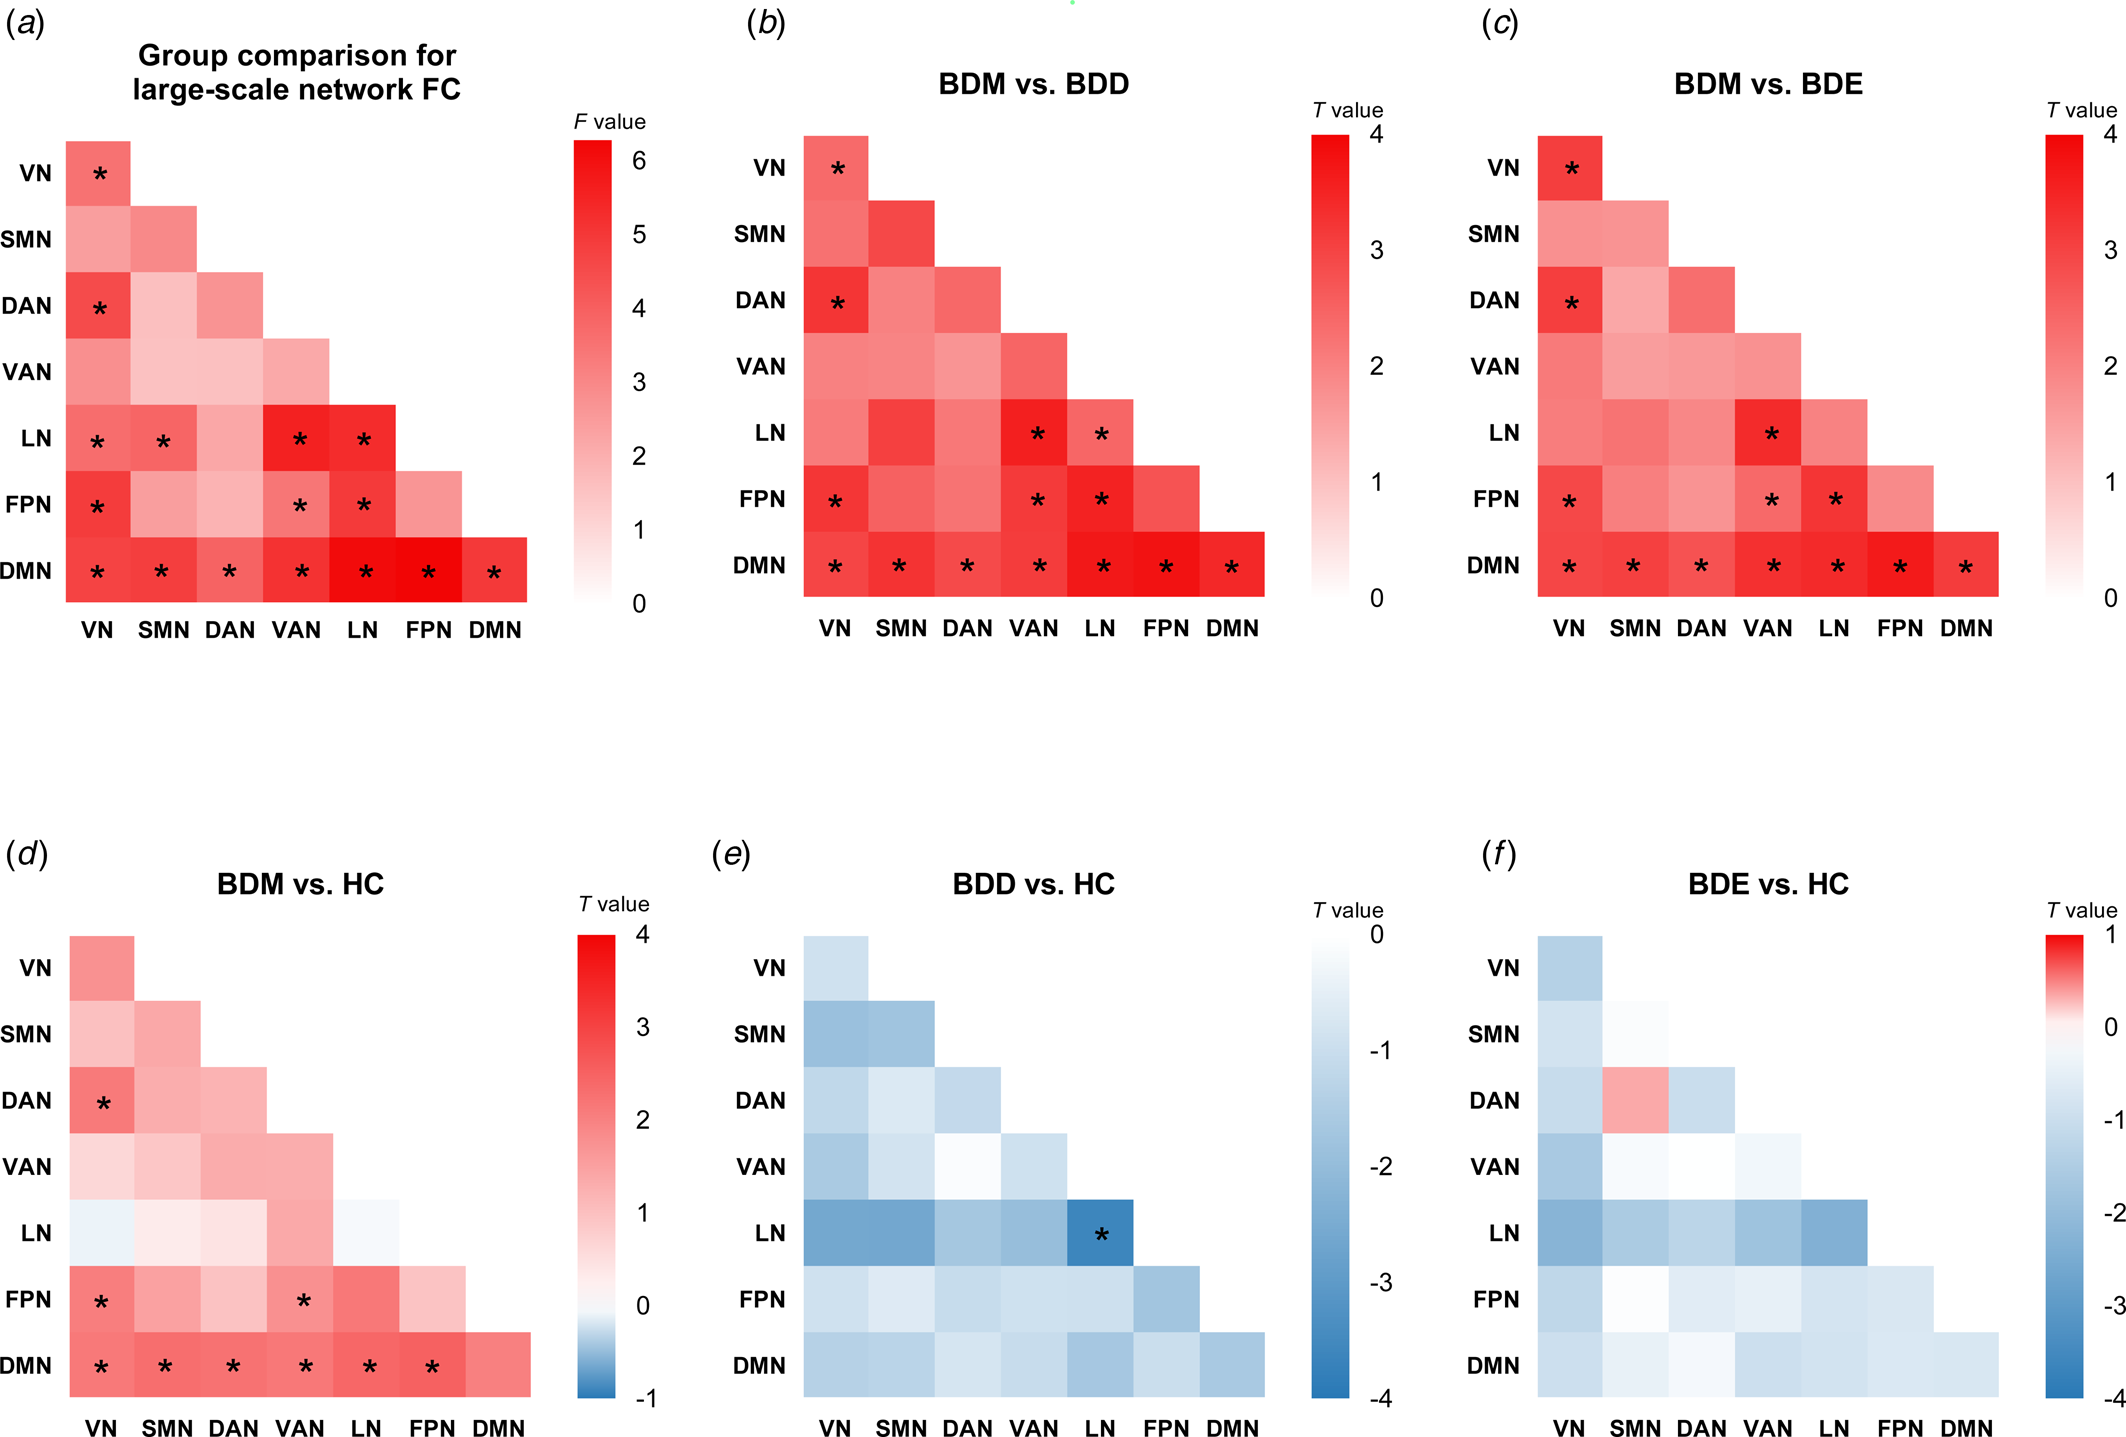
Figure 2. Cross-sectional comparison for large-scale network FC. (a) The F values of cross-sectional four-group comparison on large-scale network FC. Other heatmaps show the T values of network FC for five contrasts: (b) BDM v. BDD, (c) BDM v. BDE, (d) BDM v. HC, (e) BDD v. HC, and (f) BDE v. HC. *P corrected < 0.05. For four-group comparison, the results were corrected for multiple comparison using FDR. For post hoc analyses, the results were corrected for multiple comparisons using Bonferroni correction.
We conducted post hoc analyses in the 16 network FCs (online Supplementary Fig. S1 and Tables S4–S9). Compared with BDD, BDE patients, and HCs, BDM patients showed uniquely increased FCs in VN-DAN, VN-FPN, FPN-VAN, and all DMN-related between-network FC (Fig. 2b, c, d). We also observed decreased FC within LN in BDD patients compared with BDM patients and HCs (Fig. 2b, e). No significant differences were found between BDE patients and HCs (Fig. 2f) as well as between BDE patients and BDD patients. The results were almost unchanged after adding the number of different treatments as covariates (see online Supplementary results and Supplementary Fig. S2) and were all replicated using scrubbing during processing (see online Supplementary results and Supplementary Fig. S3). When adopting the Dosenbach's 160 brain atlas to construct network FC matrix, the findings were mainly replicated except the LN-related FC (online Supplementary Fig. S4). Of note, the LN is not covered by this brain atlas and the subcortical network was used instead.
No significant order × episode interaction was observed. The within-subject analysis revealed a significant main effect of episode in LN-VN (F 1,11 = 13.1, p = 3.9 × 10⁻³), LN-SMN (F 1,11 = 13.3, p = 3.7 × 10⁻³), LN-VAN (F 1,11 = 25.4, p = 3.6 × 10⁻⁴), and DMN-VAN FC (F 1,11 = 9.7, p = 0.01) (Fig. 3; online Supplementary Table S10). Specifically, increased network FC were found in BD patients during (hypo)manic episode in the LN-VN, LN-SMN, LN-VAN, and DMN-VAN. However, except for the DMN-VAN FC, a significant main effect of scanning order was also observed, indicating that scanning order may account for between-subject differences in LN-VN, LN-SMN, and LN-VAN FC. The results replicated using scrubbing and the Dosenbach's 160 brain atlas, see online Supplementary results and Supplementary Fig. S5.
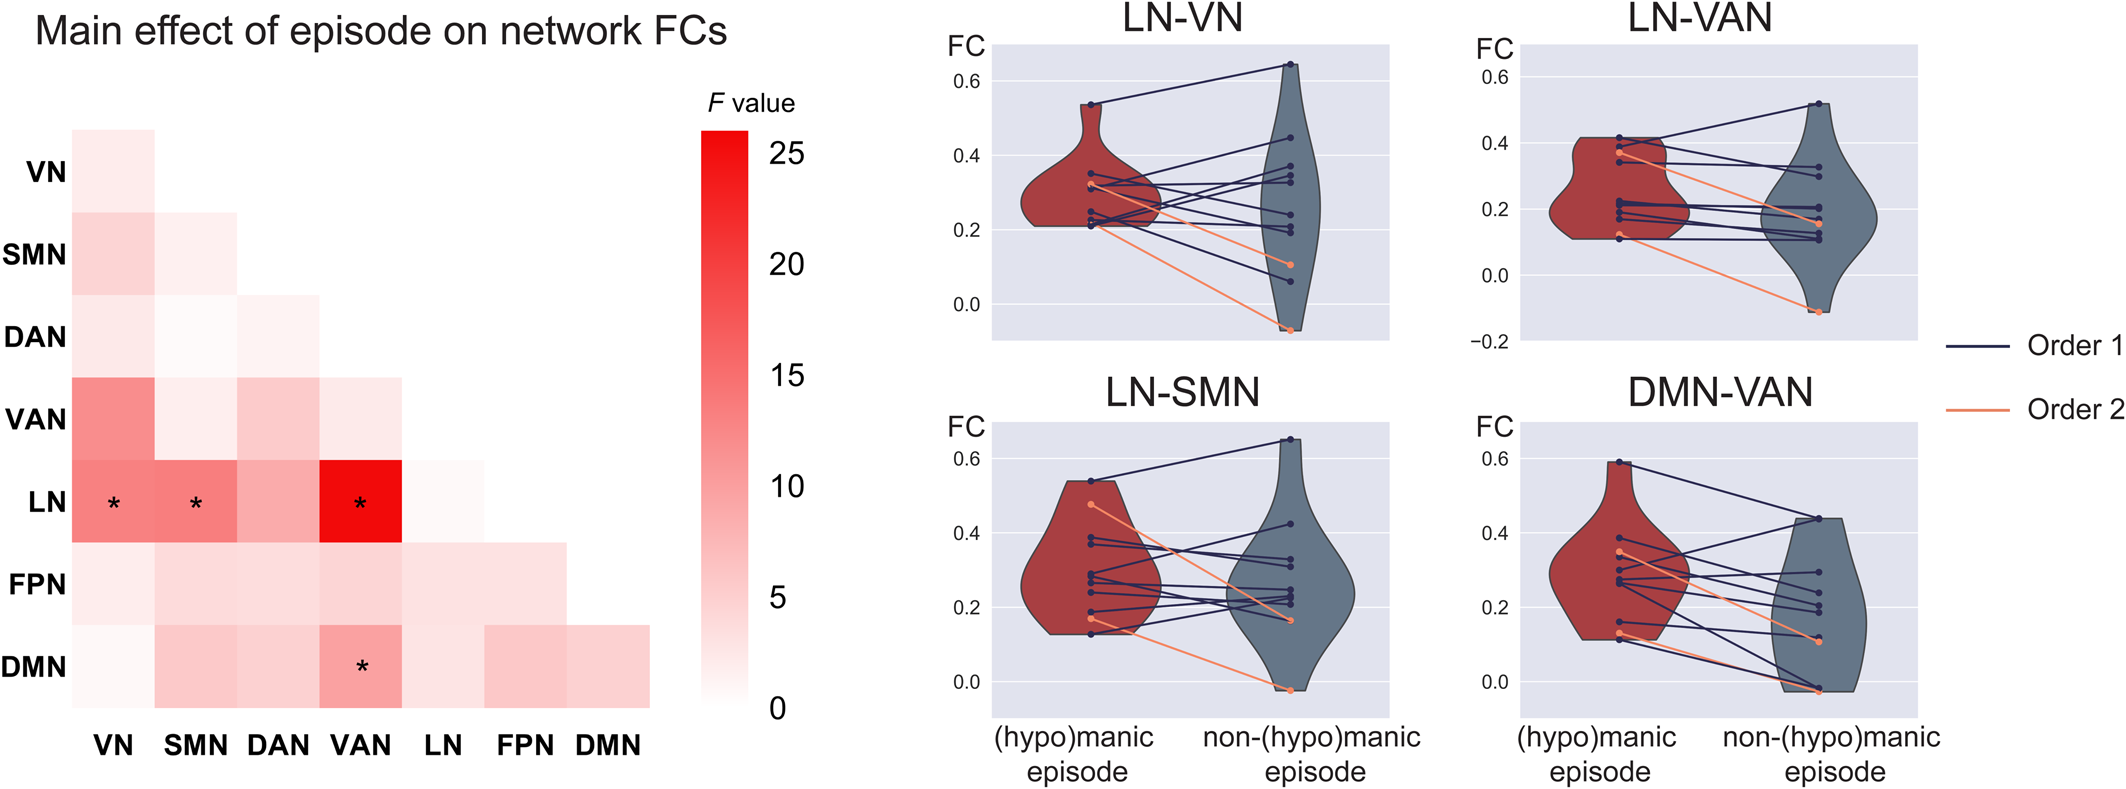
Figure 3. Increased FC related to (hypo)manic episode in BD. The left heatmap shows the F values of the main effect of episode in the mixed effect model on FC for each pair of networks. Violin plots show within-subject differences in the significant network FCs between (hypo)manic episode and non-(hypo)manic episode with different scanning order (mean(hypo)manic ± SD(hypo)manic/meannon−(hypo)manic ± SDnon−(hypo)manic: 0.29 ± 0.09/0.26 ± 0.20 for LN-VN, 0.25 ± 0.11/0.19 ± 0.16 for LN-VAN, 0.30 ± 0.13/0.27 ± 0.17 for LN-SMN, 0.29 ± 0.13/0.18 ± 0.17 for DMN-VAN). *Significant after FDR correction to p < 0.05 among the 16 significant network connections in the cross-sectional comparison. Order 1 indicates the first scan was during (hypo)manic episode and the second scan was during non-(hypo)manic episode. Order 2 indicates a reverse scanning order.
Taken together, among the 16 significant network FCs in the cross-sectional comparison, the DMN-VAN FC could be replicated both in methodological validations/subsidiary analysis of the cross-sectional sample and in the longitudinal analysis with a significant main effect of episode.
Manic symptoms/PA link with altered network FC
All the 10 significant network FCs based on both brain atlases (i.e. within VN, VN-DAN, VN-FPN, and all DMN-related FCs) were found to be positively correlated with YMRS and PANAS-PA score in BD patients (online Supplementary Table S11), including the DMN-VAN FC mentioned above (r 156 = 0.32, P FDR < 0.001 for the YMRS score; r 139 = 0.27, P FDR = 0.01 for the PANAS-PA score) (Fig. 4).
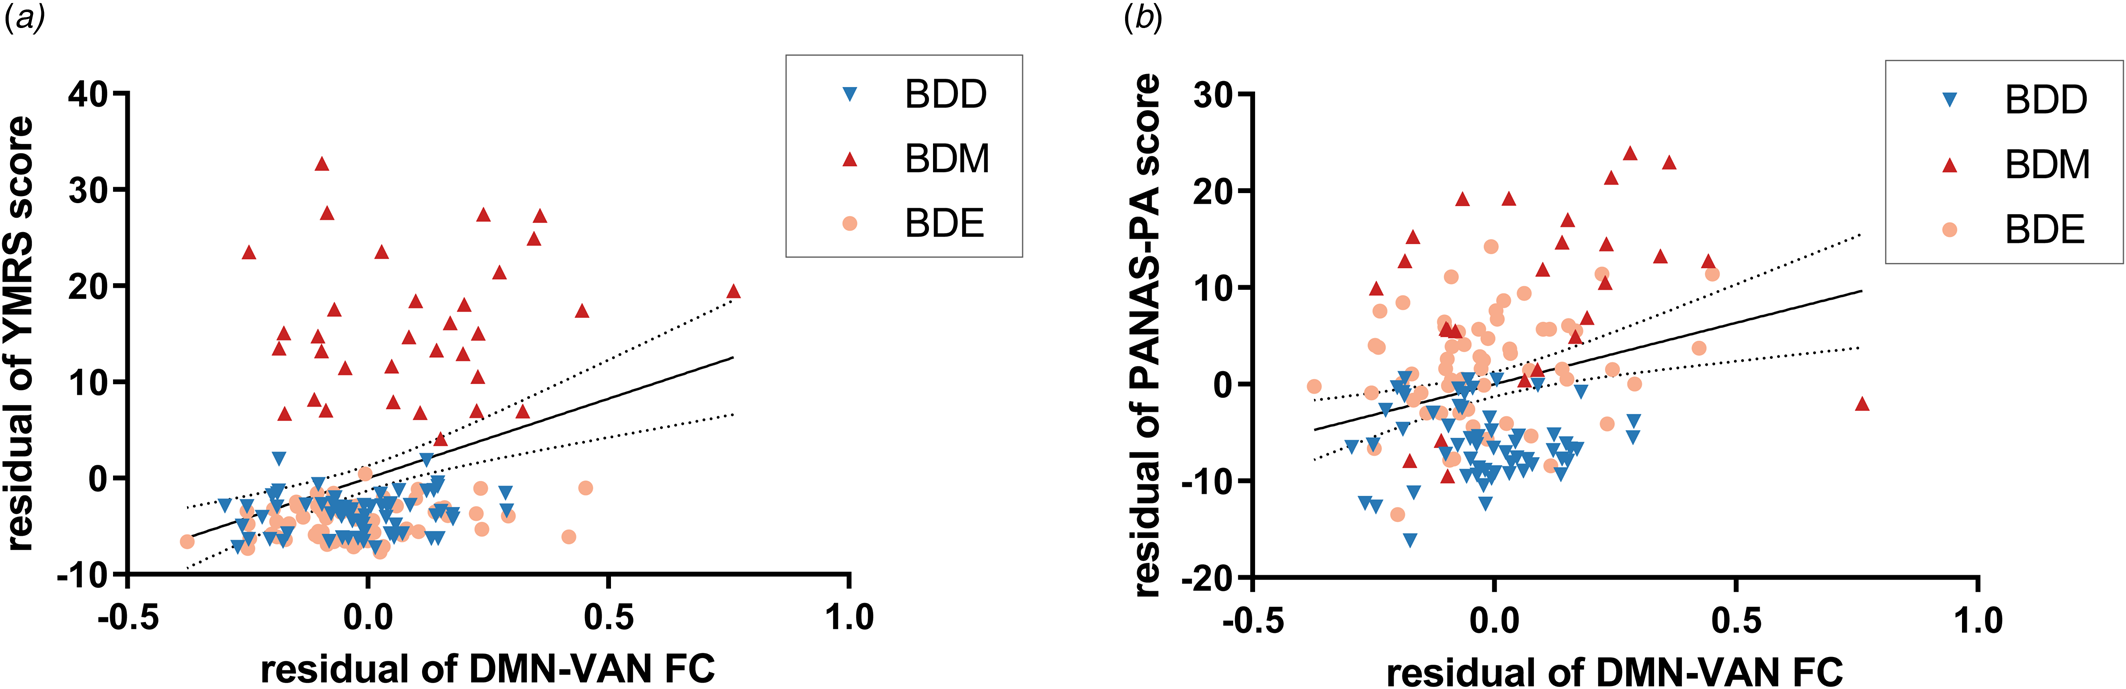
Figure 4. Relationship between the DMN-VAN FC and manic symptoms/PA. The DMN-VAN FC was positively correlated with (a) YMRS score and (b) PANAS-PA score with sex, age, education years, and FD value adjusted. Dotted lines indicate the 95% confidence interval. YMRS, Young Mania Rating Scale; PANAS, Positive And Negative Affect Schedule.
Potential connectors in mood switching
The exploratory analysis to examine brain regions related to mood switching revealed significant differences in nodal degree among BDD, BDM, BDE patients, and HCs and were observed in 14 brain regions (online Supplementary Fig. S6), including the VN (left parahippocampal gyrus), the SMN (right superior temporal gyrus), the DAN (left lateral occipital cortex, right inferior and middle temporal gyrus), the VAN (left parietal operculum), the FPN (right precuneus), and the DMN (bilateral parietal lobe and bilateral precuneus/posterior cingulate cortex [pCunPCC]). The BDM patients exhibited increased nodal degree in 11 of the 14 brain regions compared with other groups. Particularly, 4 of the 11 regions were subdivisions of the pCunPCC, suggesting that the BDM patients showed more extensive increased connections in pCunPCC than other groups (Fig. 5).
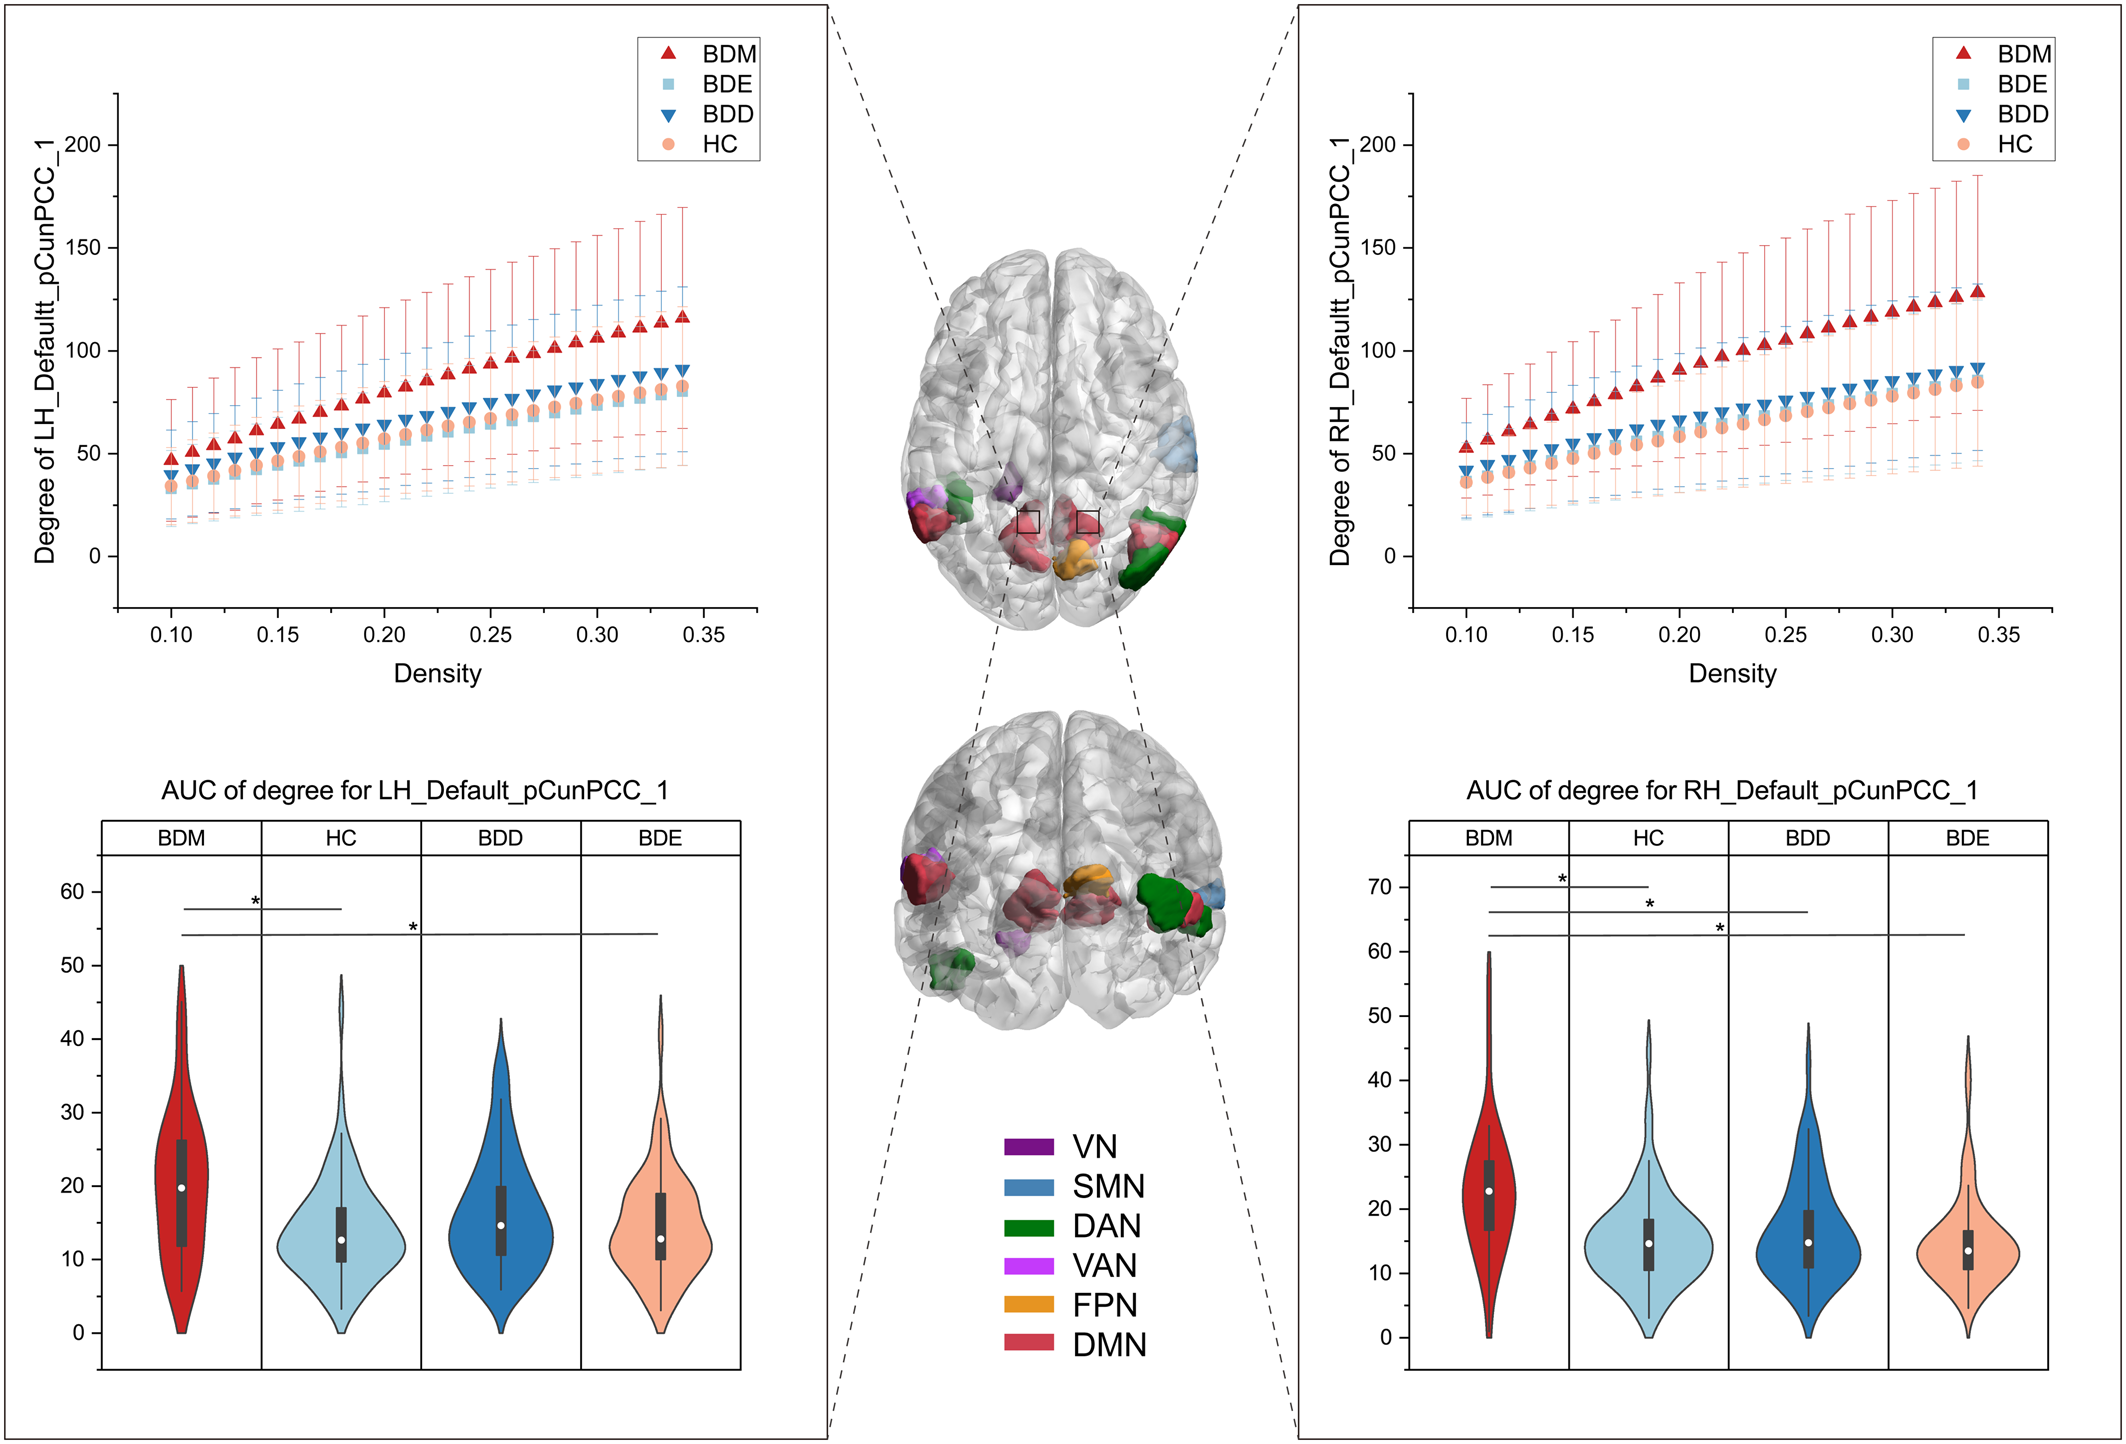
Figure 5. Brain regions showing group differences in nodal degree among BDD, BDM, BDE patients, and HCs. The middle brain maps show the 14 brain regions with group differences in nodal degree (F 3234 = 9.13 for LH_Vis_7, F 3234 = 5.90 for LH_DorsAttn_Post_1, F 3234 = 5.74 for LH_SalVentAttn_ParOper_2, F 3234 = 7.73 for LH_Default_Par_5, F 3234 = 5.83 for LH_Default_pCunPCC_1, F 3234 = 8.95 for LH_Default_pCunPCC_2, F = 10.54 for LH_Default_pCunPCC_5, F 3234 = 5.96 for RH_Sommot_2, F 3234 = 7.98 for RH_DorsAttn_Post_3, F 3234 = 5.93 for RH_DorsAttn_Post_4, F 3234 = 8.36 for RH_Cont_pCun_1, F 3234 = 8.16 for RH_Default_Par_2, F 3234 = 8.63 for RH_Default_pCunPCC_1, F 3234 = 7.79 for RH_Default_pCunPCC_3). Two of the regions were taken as examples to show the group differences. The upper graphs show the degree in one subdivision (bilateral part) of the pCunPCC across a sparsity range between 10% and 34% for the four groups. Each point and error bar denote the mean and standard deviation at each sparsity level. The lower violin plots show the AUC parameters of nodal degree in the subdivision (also bilateral part) of the pCunPCC for the four groups. Means and standard deviations are depicted. LH, left hemisphere; RH, right hemisphere; Default, DMN. *P tukey < 0.05.
All the AUC values of degree in the 14 brain regions were found to be positively correlated with the YMRS score in BD patients (online Supplementary Table S12). The AUC values of degree in the VN (left parahippocampal gyrus) and the SMN (right superior temporal gyrus) were found to be positively correlated with the PANAS-PA score in BD patients.
Discussion
Using both cross-sectional and longitudinal designs, we identified functional network alterations above and beyond those related to diagnosis or those related to mood state. Employing a global network approach, we demonstrated brain functional changes across mood states at the large-scale brain network and brain region levels. First, our data revealed that (hypo)manic patients differentiated from both HCs and bipolar patients in other mood states by increased large-scale network FCs, predominantly in the VN-DAN, VN-FPN, FPN-VAN, and all DMN-related between-networks. Longitudinal observation found increased network FC in BD patients during (hypo)manic episode in the LN-VN, LN-SMN, LN-VAN, and DMN-VAN FC. Second, bipolar depressive patients exhibited decreased FC within the LN compared with (hypo)manic patients and HCs. Furthermore, the pattern of large-scale network alterations was positively correlated with severity of mania and level of PA. Finally, we observed increased nodal degree in several brain regions in (hypo)manic patients, among which the pCunPCC plays a dominating role. The nodal degree of these regions was positively correlated with severity of mania.
Our results support the critical role of the VN, LN, and DMN in neural mechanism of BD consistent with extant studies and provide novel evidence for their contribution to psychopathological presentations. In particular, group differences were observed in between-network and within-network FCs involving the VN, LN, and DMN, where (hypo)mania showed strengthened connections than other mood states. Consistent with our findings, prior studies have suggested a link between the VN and BD (Bellani et al., Reference Bellani, Bontempi, Zovetti, Gloria Rossetti, Perlini, Dusi and Brambilla2020; Northoff et al., Reference Northoff, Magioncalda, Martino, Lee, Tseng and Lane2018), especially mania. One study applying categorical approach observed increased regional homogeneity (ReHo) and degree of centrality in the VN in manic patients compared with HCs (Russo et al., Reference Russo, Martino, Magioncalda, Inglese, Amore and Northoff2020) and another study employing dimensional approach found that the lateral occipital cortex was particularly involved in a (hypo)mania-related brain network (Spielberg et al., Reference Spielberg, Beall, Hulvershorn, Altinay, Karne and Anand2016). In parallel with this, we found that VN-related network FCs (except VN-SMN, VN-LN, and VN-VAN FC) were increased in (hypo)mania and associated with severity of mania and level of PA. Further confirmation comes from a recent study which demonstrated an increased amplitude of low-frequency fluctuations in the visual cortex in offspring with subthreshold syndromes of BD patients (Lin et al., Reference Lin, Shao, Lu, Chen, Lu, Li and Xu2018). The present work extends our knowledge of the role of the VN in functional neuroanatomy of mania.
Prior research has showed mixed results of DMN alterations partly due to heterogeneous BD populations (Zovetti et al., Reference Zovetti, Rossetti, Perlini, Maggioni, Bontempi, Bellani and Brambilla2020). To address this issue, several studies examined the DMN alterations in (hypo)manic patients and described decreased FC between anterior and posterior DMN (Magioncalda et al., Reference Magioncalda, Martino, Conio, Escelsior, Piaggio, Presta and Amore2015) and decreased ReHo in the medial prefrontal cortex (Russo et al., Reference Russo, Martino, Magioncalda, Inglese, Amore and Northoff2020). Such findings confirmed the functional differentiation of the two major nodes comprising the DMN (Uddin, Kelly, Biswal, Castellanos, & Milham, Reference Uddin, Kelly, Biswal, Castellanos and Milham2009), especially in manic patients (Ongur et al., Reference Ongur, Lundy, Greenhouse, Shinn, Menon, Cohen and Renshaw2010; Zeng et al., Reference Zeng, Ross, Xue, Huang, Wu, Liu and Pu2021). Surprisingly, our data showed that the overall within-network FC in the DMN was increased in (hypo)mania compared with other mood states. Moreover, between-network FC in the DMN was also increased in (hypo)mania compared with non-(hypo)mania regardless of diagnosis. However, this does not necessarily mean contradictory finding because there may be a gap from regional connectivity to the entire network connectivity. As Claeys et al. suggested, it is challenging to interpret both increased and decreased local activity because of the impact of neighboring structures such as the compensatory mechanism, where the local activity may present in the opposite direction (Claeys et al., Reference Claeys, Mantingh, Morrens, Yalin and Stokes2022). Consistent with our findings, Brady, Tandon, et al. (Reference Brady, Tandon, Masters, Margolis, Cohen, Keshavan and Ongur2017) observed that increased connectivity between dorsal frontal nodes of the DMN and the rest of the DMN differentiated both mood state and diagnosis. Therefore, though (hypo)mania may present hypoconnectivity between the major nodes, the overall DMN seemed to exhibit higher synchronous activity within itself and with other networks. Our data provide different insight into network alterations from a large-scale network perspective and complement extant evidence of how overall FC of the DMN relates to mania.
The failure to replicate increased LN-related FC when adopting another brain atlas may be due to different brain region coverage in this atlas. Thus, the findings related to the LN should not be underestimated. Here, the LN comprises temporal cortex and orbital frontal cortex which is one of the regions most tightly connected with the subcortical limbic structures (Ongur & Price, Reference Ongur and Price2000). Post hoc analyses revealed increased FC in only two network FCs, i.e. LN-VAN and LN-FPN specific to (hypo)mania in BD. Of note, we observed decreased FC within the LN in bipolar depression compared with (hypo)mania and HCs. Supportive evidence could be found in a recent meta-analysis focusing on network alterations related to acute state (Wang et al., Reference Wang, Gao, Tang, Lu, Zhang, Bu and Huang2020). The meta-analysis demonstrated decreased connectivity within the LN in acute episodes but not in the euthymic states. Because the sample size of depression was much larger than that of mania, we supposed that such effect could be driven by bipolar depression.
Regarding the opposite symptoms during mania and depression, one may expect opposing functional changes in the two states and normalization effect during euthymia (Rey et al., Reference Rey, Bolton, Gaviria, Piguet, Preti, Favre and Vuilleumier2021). In particular, opposing changes within DMN and SMN have been found in mania and depression (Martino et al., Reference Martino, Magioncalda, Huang, Conio, Piaggio, Duncan and Northoff2016), where several pieces of evidence showed decreased regional FC in the DMN during mania and in the SMN during depression (Magioncalda et al., Reference Magioncalda, Martino, Conio, Escelsior, Piaggio, Presta and Amore2015; Russo et al., Reference Russo, Martino, Magioncalda, Inglese, Amore and Northoff2020), as well as increased global FC in the SMN during mania and in the DMN during depression (Zhang et al., Reference Zhang, Magioncalda, Huang, Tan, Hu, Hu and Northoff2019). However, our findings did not support opposing patterns of alterations underlying bipolarity of mood state and energy. This may be explained by the methodological issues and clinical presentations. First, there were differences in frequency band and measure of brain function. Second, the prior work seemed to identify regional topography in a global manner and thus the functional activity of the two networks may be represented by critical hub regions. However, we considered distributed areas in the networks. Third, there was no criteria for range of depression severity in manic patients and for range of mania severity in depressive patients in the prior work.
Rather, our analysis reveals network alterations in the unique context of mania. The current findings of network alterations were mainly driven by (hypo)manic patients but not depressive patients. This does not necessarily mean an absence of brain functional changes during bipolar depression, because alterations of network FC and nodal degree were observed in depressive patients compared with HCs. But overall, the study evidences the functional neuroanatomy of (hypo)mania. The predominance of (hypo)mania-related findings in BD brain functional changes may reflect the diagnostic hallmark of BD as (hypo)mania (Cotovio & Oliveira-Maia, Reference Cotovio and Oliveira-Maia2022). Indeed, our data indicate that the VN-DAN, VN-FPN, within VN, and all DMN-related FCs could not only differentiate (hypo)mania from other mood states in BD but also be correlated with manic symptoms and PA but not depressive symptoms or NA in BD. This finding highlights a link between-network hyperconnectivity (especially related to the DMN) and (hypo)manic symptoms (especially elevated mood). With respect to the VN, which is considered the first and foremost processing region of external events (Northoff et al., Reference Northoff, Magioncalda, Martino, Lee, Tseng and Lane2018), recent evidence has surprisingly suggested its role in subjective anger and aggression (Tozzi, Tuzhilina, Glasser, Hastie, & Williams, Reference Tozzi, Tuzhilina, Glasser, Hastie and Williams2021) and emotion management (Jimenez, Riedel, Lee, Reavis, & Green, Reference Jimenez, Riedel, Lee, Reavis and Green2019). Our findings suggested that how the VN and its interaction with the task-positive networks (e.g. the DAN and FPN) are implicated in manic symptoms. Reviewing evidence about the role of the DMN in psychiatric disorders, we found similar hyperconnectivity within the DMN (e.g. major depressive disorder (Kaiser, Andrews-Hanna, Wager, & Pizzagalli, Reference Kaiser, Andrews-Hanna, Wager and Pizzagalli2015), autism spectrum disorder (Padmanabhan, Lynch, Schaer, & Menon, Reference Padmanabhan, Lynch, Schaer and Menon2017), attention-deficit/hyperactivity disorder (McCarthy et al., Reference McCarthy, Skokauskas, Mulligan, Donohoe, Mullins, Kelly and Frodl2013), and schizophrenia (Whitfield-Gabrieli & Ford, Reference Whitfield-Gabrieli and Ford2012) but different patterns of interactions between the DMN and other brain networks in terms of diagnosis. By this view, together with our findings, the increased between-network FCs in the DMN may be a unique pattern of (hypo)mania from a dualistic perspective or a biomarker indicating severity of mania.
The (hypo)mania-related network alterations were also seen in the longitudinal sample, where an increase in the LN-VAN and DMN-VAN FC related to (hypo)mania was evidenced in both samples. Subsequent analysis suggested that the longitudinal finding of increased LN-VAN FC may be confounded by scanning order and the DMN-VAN FC showed a nonsignificant main effect of scanning order. Indeed, within-individual variance in findings is often much larger than within-group variation (Fisher, Medaglia, & Jeronimus, Reference Fisher, Medaglia and Jeronimus2018), suggesting the need for within-subject examination, which would also be more close to the natural course of disease trajectories. However, in this study, the small sample size of the longitudinal sample implied that the finding of an increase in the DMN-VAN FC related to (hypo)manic state should be interpreted with caution. The DMN-VAN FC could be a relatively reliable neuroimaging marker for (hypo)mania but future research on a larger sample size is needed.
The absence of significant differences in large-scale network FC between euthymic patients and HCs is not surprising. Consistent with our findings, Syan et al. (Reference Syan, Smith, Frey, Remtulla, Kapczinski, Hall and Minuzzi2018b) conducted a systematic review of the extant literature on FC in euthymic patients and found that the most consistent finding was the lack of differences in FC of the DMN, FPN, and VAN in euthymic patients compared with HCs. Of note, this consistent finding was based on independent component analysis, which reflects the entire network FC, similar to our study. However, seed-based analysis reported aberrant FC in corticolimbic regions with heterogenous findings. In our study, a decreased nodal degree in the left lateral occipital cortex was observed in euthymic patients compared with HCs. We might postulate that the stability of mean network FC may reflect a state of clinical remission, while aberrant local FC may be related to subthreshold symptoms during a euthymic episode (Syan et al., Reference Syan, Smith, Frey, Remtulla, Kapczinski, Hall and Minuzzi2018b).
We also examined topological properties to identify potential connectors related to mood switching between (hypo)mania and non-(hypo)mania. Here, we found increased nodal degree in several brain regions in (hypo)manic patients. These regions included temporal, occipital, and parietal lobe, parahippocampal gyrus and pCunPCC, partly consistent with the only one study examining the properties of brain networks across mood states to our knowledge (Zhang et al., Reference Zhang, Wu, Zhang, Bai, Ji, Tian and Wang2021). To some extent, the increased nodal degree in these regions mirror our findings of distinct large-scale network alterations in (hypo)mania, where hyperconnectivity was observed in distributed brain networks. Employing graph-theoretical approach provides further insight to potential connectors related to (hypo)manic state. We noticed that several brain regions closely match the canonical distribution of the temporo-parietal junction (TPJ), which supports re-orienting attention to the external environment when behaviorally important stimuli are encountered (Anticevic, Repovs, Shulman, & Barch, Reference Anticevic, Repovs, Shulman and Barch2010). Previous study suggested that elevated activation in the TPJ during perception of social stimuli was observed in manic patients and was correlated with increased delusional ideation (Usnich et al., Reference Usnich, Spengler, Sajonz, Herold, Bauer and Bermpohl2015). Complementing previous evidence, our findings support the role of TPJ in manic symptoms. We also found that several brain regions are subdivisions of the pCunPCC, which is the posterior hub of the DMN, supporting integrating information and coordinating intrinsic activity of remote brain networks (Claeys et al., Reference Claeys, Mantingh, Morrens, Yalin and Stokes2022; Zovetti et al., Reference Zovetti, Rossetti, Perlini, Maggioni, Bontempi, Bellani and Brambilla2020). Aberrant functional activity in the pCunPCC is frequently reported in BD (Zovetti et al., Reference Zovetti, Rossetti, Perlini, Maggioni, Bontempi, Bellani and Brambilla2020), but relative dearth of prior work has linked the nodal properties of pCunPCC with manic symptoms. Here, we speculated that the increased degree of TPJ and pCunPCC initiates the hyperconnectivity of related networks, potentially contributing to mood switching from non-(hypo)mania to (hypo)mania. In accordance with our findings, one recent study observed differential activation in precuneus in bipolar patients during manic state and euthymic state (Alonso-Lana et al., Reference Alonso-Lana, Moro, McKenna, Sarro, Romaguera, Monte and Pomarol-Clotet2019).
Some limitations should be acknowledged. The lack of control for some potential confounders such as medication, illness duration, and previous episodes may have produced biases. Despite that it was not feasible to examine the relationship between connectivity and different classes of medication in our data because medication was too varied, we conducted an exploratory analysis to assess the eventual impact of medication status on primary results (see online Supplementary results and Supplementary Table S13) and a control analysis to control for the potential impact of the number of different treatments (online Supplementary Fig. S2). More importantly, we confirmed our findings in the independent longitudinal dataset, which may indicate that these confounding effects were attenuated using the within-subject design. Second, the study included manic and hypomanic patients in the same group due to the difficulty of MRI data collection in these patients. Despite their different symptom severity, there would be a set of ‘core’ features integral to mania and to hypomania (Parker & Graham, Reference Parker and Graham2015). Besides, common brain network alterations are evidenced in hypomanic and manic patients (Spielberg et al., Reference Spielberg, Beall, Hulvershorn, Altinay, Karne and Anand2016). One of the goals of BD treatment is to prevent the recurrence of mania or hypomania, which provides justification for grouping these patients together because comparing them with depressive and euthymic patients can help identify related neural substrates (Chen, Fang, Kemp, Calabrese, & Gao, Reference Chen, Fang, Kemp, Calabrese and Gao2010; Leverich et al., Reference Leverich, Altshuler, Frye, Suppes, McElroy, Keck and Post2006). Moreover, the study had relatively imbalanced sample sizes among different mood state groups and relatively small sample size of the longitudinal sample, which grouped depressive and euthymic episodes together. The challenges of collecting neuroimaging data of bipolar mania and collecting longitudinal neuroimaging data are noteworthy, explaining the relatively small sample size of the (hypo)manic group and a comparison between (hypo)manic and non-(hypo)manic states rather than specifically between (hypo)manic and depressive and euthymic states, respectively. In view of substantial challenges of scanning BD patients across mood states in a natural clinical situation, it will be helpful to follow up BD patients at scheduled visit and record corresponding mood state in future studies. Finally, we did not undertake neuropsychological measurements, so correlations between altered functional connectivities and cognitive impairments could not be explored. Future studies should include more cognitive data to clarify the clinical implications.
In conclusion, the current study identified a distributed pattern of large-scale network alterations in the unique context of (hypo)mania, where hyperconnectivity was associated (hypo)manic symptoms. Longitudinal observation also evidenced an increase in network FCs in patients during (hypo)manic episode. Such network alterations may constitute a neuroimaging marker for both the (hypo)manic state and the severity of manic symptoms, among which the DMN-VAN FC seems to be a more reliable one. The TPJ and pCunPCC may comprise potential connectors in mood switching but still need further validation. These findings add a new perspective to current understanding of the pathophysiology of BD in the unique context of mania.
Supplementary material
The supplementary material for this article can be found at https://doi.org/10.1017/S003329172300245
Data availability statement
The data associated with the manuscript are not currently publicly available.
Acknowledgements
We thank all participants. We gratefully acknowledge the support in participant recruitment by Zhang Yu and An Jing.
Funding statement
This study was supported by the National Natural Science Foundation of China (TMS: No. 82171529), (YAS: No. 82071528), (CGY: No. 82122035), the Capital Foundation of Medical Research and Development (TMS: 2022-1-4111), (JTL: 2020-2-4113), the National Key Technology R&D Program (TMS: 2015BAI13B01), (CGY: 2017YFC1309902), the Sci-Tech Innovation 2030 – Major Project of Brain Science and Brain-Inspired Intelligence Technology (CGY: 2021ZD0200600), the 13th Five-Year Informatization Plan of Chinese Academy of Sciences (CGY: XXH13505), the Key Research Program of the Chinese Academy of Sciences (CGY: No. ZDBS-SSW-JSC006), Beijing Nova Program of Science and Technology (CGY: Z191100001119104), and the Scientific Foundation of Institute of Psychology, Chinese Academy of Sciences (CGY: E2CX4425YZ).
Competing interests
All authors report no financial relationships with commercial interests.


 Open access