


Introduction
Major depressive disorder (MDD) is a large contributor to the global burden of disease (GBD 2016 DALYs and HALE Collaborators, 2017) and many patients do not benefit from available treatment options (Trevino et al., Reference Trevino, McClintock, McDonald Fischer, Vora and Husain2014). Meta-analyses of neuroimaging studies support a limbic-cortical imbalance (Fitzgerald et al., Reference Fitzgerald, Laird, Maller and Daskalakis2008; Sacher et al., Reference Sacher, Neumann, Fünfstück, Soliman, Villringer and Schroeter2012; Graham et al., Reference Graham, Salimi-Khorshidi, Hagan, Walsh, Goodyer, Lennox and Suckling2013; Lai, Reference Lai2014) and a default mode network (DMN) predominance (Graham et al., Reference Graham, Salimi-Khorshidi, Hagan, Walsh, Goodyer, Lennox and Suckling2013; Kaiser et al., Reference Kaiser, Andrews-Hanna, Wager and Pizzagalli2015) as neural mechanisms of negative affectivity (NA) (Mayberg, Reference Mayberg1997; Disner et al., Reference Disner, Beevers, Haigh and Beck2011) and rumination (Marchetti et al., Reference Marchetti, Koster, Sonuga-Barke and Raedt2012). To integrate these findings into a model of the pathogenesis of MDD, it is critical to determine whether they form causal factors, correlates, or consequences of the disorder (Kessler et al., Reference Kessler, Traue and Wiswede2011).
Numerous imaging genetics studies aimed to discover the pathogenesis of heterogeneous, polygenic mental disorders by identifying intermediate phenotypes (IPs), also referred to as endophenotypes. IPs are conceptualized to mediate between the genotype of a disorder and its behavioral phenotype. Per definition, they are to be found in non-affected family members at a higher rate than in the general population, to be quantifiable, heritable, state-independent, and co-segregating with the illness within families (Gottesman and Gould, Reference Gottesman and Gould2003; Meyer-Lindenberg and Weinberger, Reference Meyer-Lindenberg and Weinberger2006).
Amygdala hyperactivity and aberrant amygdala–prefrontal functional connectivity (FC) during emotion processing have been proposed as IPs for depression as they have been observed in healthy carriers of risk variants of candidate genotypes for depression (Hariri et al., Reference Hariri, Mattay, Tessitore, Kolachana, Fera, Goldman, Egan and Weinberger2002; Heinz et al., Reference Heinz, Braus, Smolka, Wrase, Puls, Hermann, Klein, Grüsser, Flor, Schumann, Mann and Büchel2005; Pezawas et al., Reference Pezawas, Meyer-Lindenberg, Drabant, Verchinski, Munoz, Kolachana, Egan, Mattay, Hariri and Weinberger2005; Schardt et al., Reference Schardt, Erk, Nüsser, Nöthen, Cichon, Rietschel, Treutlein, Goschke and Walter2010; Fornito and Bullmore, Reference Fornito and Bullmore2012) and are key assumptions of the limbic-cortical imbalance model of negatively biased emotion processing (Disner et al., Reference Disner, Beevers, Haigh and Beck2011).
In a recent study, we tested one of the validity criteria of these putative IPs, their higher presence in first-degree relatives of MDD patients (Wackerhagen et al., Reference Wackerhagen, Wüstenberg, Mohnke, Erk, Veer, Kruschwitz, Garbusow, Romund, Otto, Schweiger, Tost, Heinz, Meyer-Lindenberg, Walter and Romanczuk-Seiferth2017). Considering the limited interpretability of FC for causal effects in amygdala–prefrontal interactions and contradicting findings in imaging genetics studies [decreased connectivity might reflect dysregulation (Pezawas et al., Reference Pezawas, Meyer-Lindenberg, Drabant, Verchinski, Munoz, Kolachana, Egan, Mattay, Hariri and Weinberger2005); increased connectivity might reflect compensation (Heinz et al., Reference Heinz, Braus, Smolka, Wrase, Puls, Hermann, Klein, Grüsser, Flor, Schumann, Mann and Büchel2005; Schardt et al., Reference Schardt, Erk, Nüsser, Nöthen, Cichon, Rietschel, Treutlein, Goschke and Walter2010)], we used the identical paradigm as in the imaging genetics studies of reference (Hariri et al., Reference Hariri, Mattay, Tessitore, Kolachana, Fera, Goldman, Egan and Weinberger2002; Pezawas et al., Reference Pezawas, Meyer-Lindenberg, Drabant, Verchinski, Munoz, Kolachana, Egan, Mattay, Hariri and Weinberger2005), and assessed amygdala FC across as well as between conditions using generalized psychophysiological interactions [gPPI (McLaren et al., Reference McLaren, Ries, Xu and Johnson2012)] to explore the influence of emotional stimuli on amygdala–prefrontal FC. We found that in relatives compared to controls, amygdala FC across conditions was increased with the perigenual anterior cingulate cortex (pgACC) and decreased with the medial frontal cortex (MFG); amygdala FC with both pgACC and MFG was inversely correlated with NA. Considering that cortical regulation of limbic activity is mediated by the pgACC (Disner et al., Reference Disner, Beevers, Haigh and Beck2011), we discussed reduced amygdala-MFG in relatives to reflect a potential risk marker and increased amygdala-pgACC FC to serve a compensatory function, potentially promoting resilience.
Here, we re-assessed the previously reported data in combination with a newly acquired group of unrelated MDD patients and additional controls, aiming to disentangle neural mechanisms of pathology, risk, and compensation/resilience. Through mechanisms of familial transmission, including genetic as well as environmental factors, first-degree kinship with a depressed relative is one of the strongest predictors of depression onset and multiplies depression risk by the factor 2–3 (Sullivan et al., Reference Sullivan, Neale and Kendler2000; Li et al., Reference Li, Sundquist, Hemminki and Sundquist2008; Klein et al., Reference Klein, Glenn, Kosty, Seeley, Rohde and Lewinsohn2013; Wilde et al., Reference Wilde, Chan, Rahman, Meiser, Mitchell, Schofield and Green2014, p. 20). We assumed that features unique in patients compared to both unaffected groups would reflect markers of pathology that were not related to familial risk for depression. We further assumed that features shared by both patients and relatives that differed from controls would indicate markers of risk for depression. Further, we assumed that features distinguishing relatives from both controls (who were not at familial risk) and patients (who, in the majority, had first-degree relatives affected by depression or other psychiatric disorders), might be associated with compensation for familial risk and resilience, since relatives were never affected of mental disorders despite their increased risk load. Other studies comparing familial risk, patient and control groups have used the same or similar approaches (Amico, Reference Amico2011; Doucet et al., Reference Doucet, Bassett, Yao, Glahn and Frangou2017).
Using identical methods as in our previous study (Wackerhagen et al., Reference Wackerhagen, Wüstenberg, Mohnke, Erk, Veer, Kruschwitz, Garbusow, Romund, Otto, Schweiger, Tost, Heinz, Meyer-Lindenberg, Walter and Romanczuk-Seiferth2017), we assessed brain responses and task-dependent amygdala FC during a faces matching task. We further investigated associations of the brain activity and FC measures with NA, and performed further exploratory analyses of the results.
Methods
Participants
The data were taken from a larger dataset, which were acquired in two independent multicenter studies of the neuro-genetic causes of depression, schizophrenia, and bipolar disorder. The first one was conducted in Berlin, Bonn, and Mannheim, Germany, from 2009 to 2013 and included healthy controls and first-degree relatives of patients affected by one of the disorders (Erk et al., Reference Erk, Meyer-Lindenberg, Schmierer, Mohnke, Grimm, Garbusow, Haddad, Poehland, Mühleisen, Witt, Tost, Kirsch, Romanczuk-Seiferth, Schott, Cichon, Nöthen, Rietschel, Heinz and Walter2014). The second one was conducted in Berlin and Mannheim and included patients affected by one of the disorders and an additional control group. Participants were recruited via local hospitals and advertisements and received small monetary expense allowances.
Inclusion criteria for the group of relatives were to have one or more first-degree relative(s) with a diagnosis of MDD, and no familial history of bipolar disorder, schizophrenia, or substance dependence (except for tobacco), as confirmed in structured clinical interviews or by medical reports. Except for familial history of MDD in relatives, relatives and controls had no personal or familial histories of lifetime axis I disorders, as confirmed by structured clinical interviews (Wittchen et al., Reference Wittchen, Wunderlich, Gruschwitz and Zaudig1997). MDD patients were included if currently diagnosed with recurrent depressive disorder or a depressive episode that was either severe or had lasted for at least two years (see online Supplementary Section S8 for clinical characteristics). All participants were native German speakers; for the purpose of genetic homogeneity, only subjects with German/European ancestry up to the second generation were included. Participants gave written informed consent before participation. The study was approved by local ethics committees.
We excluded controls and relatives with scores higher than 18 in the Beck Depression Inventory (BDI-I) (Hautzinger et al., Reference Hautzinger, Bailer, Worrall and Keller1994), any participants with neuroradiological findings indicating severe neurological disorders (e.g. cerebral tumors, multiple sclerosis, stroke) as well as with missing data, strong image artifacts, excessive movement (>3 mm translation and/or 1° rotation) during the task scan, or insufficient signal (<10 voxels activation in the faces > shapes contrast a T > 0.1) in the right or left amygdala, as determined during PPI analyses. After matching for age and sex, the sample for group comparisons included n = 203 participants (Fig. 1, online Supplementary Fig. S2).
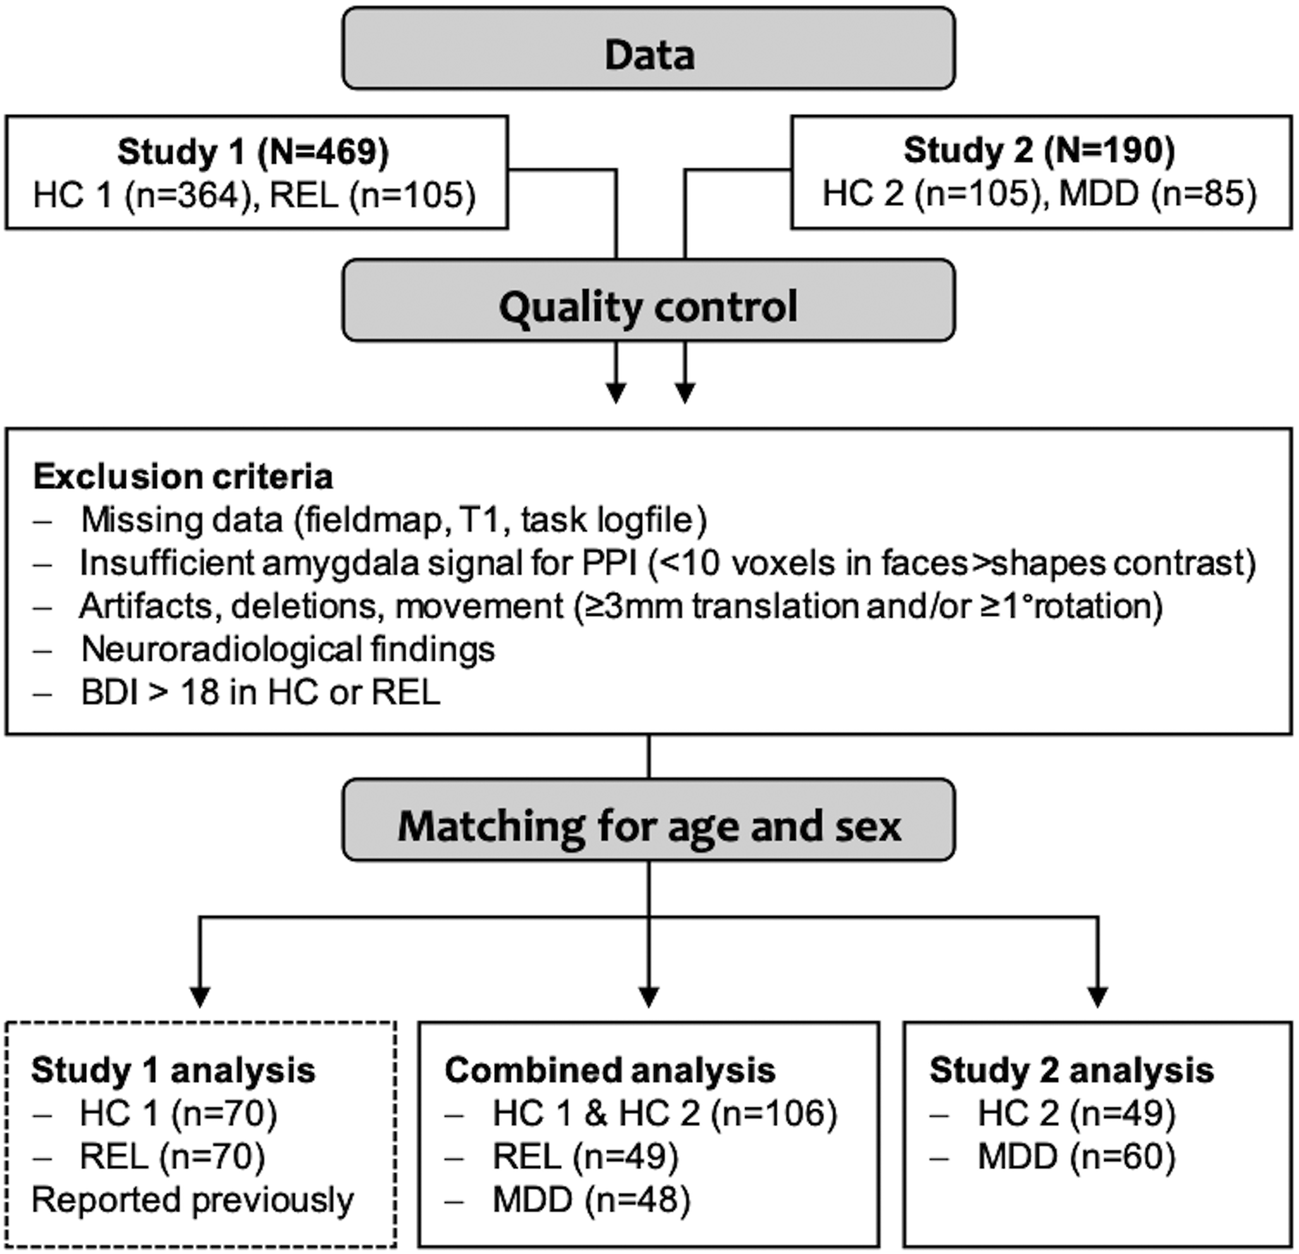
Fig. 1. Overview of the sample and analyses. The sample was acquired in two consecutive studies, study 1 (Wackerhagen et al., Reference Wackerhagen, Wüstenberg, Mohnke, Erk, Veer, Kruschwitz, Garbusow, Romund, Otto, Schweiger, Tost, Heinz, Meyer-Lindenberg, Walter and Romanczuk-Seiferth2017) and study 2. After excluding cases that did not meet quality criteria, subsamples matched for age and sex were generated for subsequent analyses. In the main analysis, brain response and task-dependent amygdala FC were compared between controls (HC, from study 1 and study 2), first-degree relatives of MDD patients (REL) and MDD patients (MDD). In the sample of HC2 and MDD from study 2, we assessed the task effects reported in study 1 as well as group effects (results are provided in online Supplementary Material).
Psychological measures
We assessed NA using the BDI-I (Hautzinger et al., Reference Hautzinger, Bailer, Worrall and Keller1994), the depression scale of the Symptom Checklist-90-Revised (SCL-90-R, Franke, Reference Franke2002), the state-trait anxiety inventory (STAI, Laux et al., Reference Laux, Glanzmann, Schaffner and Spielberger1981), and the neuroticism scale of the NEO-FFI (Costa and McCrae, Reference Costa and McCrae1992). Consistent with study 1 (Wackerhagen et al., Reference Wackerhagen, Wüstenberg, Mohnke, Erk, Veer, Kruschwitz, Garbusow, Romund, Otto, Schweiger, Tost, Heinz, Meyer-Lindenberg, Walter and Romanczuk-Seiferth2017), to reduce the alpha error probability due to multiple testing when assessing brain-behavior correlations, we computed a condensed NA score from these highly correlated measures using factor analysis in SPSS (prerequisites were met, online Supplementary Table S3). We used the multiple choice vocabulary test (MWT-B, Lehrl et al., Reference Lehrl, Triebig and Fischer1995) as an indicator of general intelligence.
Emotional processing task
In both studies, functional magnetic resonance imaging (fMRI) data were taken from the identical protocol, which included six tasks (total duration 1 h). The implicit emotion processing paradigm was an adaptation of the face matching task (Hariri et al., Reference Hariri, Bookheimer and Mazziotta2000), in which participants were instructed to identify matching pairs in trios of stimuli, containing angry or fearful faces in the emotion condition, and geometric shapes in the control condition. The task (274 s total duration) was composed of four blocks per condition, each of which consisted of one instruction (2 s) and six trials (5 s each) (online Supplementary Section S3).
MRI parameters
Functional and structural MRI were performed at 3T Siemens Trio scanners (Erlangen, Germany) using 12-channel head coils and identical scanning protocols. In total, 135 whole-head gradient echo-echo planar imaging (GE-EPI) volumes were acquired (28 slices, matrix size = 64 × 64, slice thickness = 3 mm, interslice gap = 1 mm, field of view = 192 mm, voxel size = 3 × 3 × 3 mm3, TR = 2 s, TE = 30 ms, flip angle = 80°) during the task, as well as a field inhomogeneity map and a T1-weighted anatomical 3D image (for registration and normalization, spatial resolution = 1 mm3, field of view = 192, TR = 1.57 s, TE = 2.74 ms, flip angle = 15°).
Image processing
Preprocessing was done using statistical parametric mapping methods as implemented in SPM12 for MATLAB (www.fil.ion.ucl.ac.uk/spm/software/spm12/). Images underwent correction for slice acquisition delay and head motion, unwarping, registration of the EPI to the individual T1 image, normalization into standard space (Montreal Neurological Institute, 3 × 3 × 3 mm3 voxels, 4th Degree B-Spline interpolation), spatial smoothing (8 mm FWHM), and high-pass filtering (cut-off 128 s).
Analyses of task-related brain activity
Brain responses were estimated in SPM12, using a generalized linear modeling framework with a model including regressors for the faces and shapes condition, instructions, button presses, and six head motion parameters. Temporal dependencies were removed using a first order autoregressive model, and model parameters were estimated using a restricted maximum likelihood algorithm. Linear contrast images for each task condition (‘faces’; ‘shapes’) were entered into group analyses.
Analyses of task-related functional connectivity
Amygdala FC was assessed for each amygdala separately, both across and between conditions, using a gPPI framework (online Supplementary Section S4). While, like FC, PPI does not provide information about the causal relations and directions of effects between functionally connected regions (region A could cause B to increase/decrease; B could cause A to increase/decrease, and other factors could influence A and B to increase/decrease simultaneously), it does provide insight about the degree to which the temporal correlation (= FC) of BOLD signal between brain regions (physiological factor) is modulated by the experimental context (psychological factor) (Friston et al., Reference Friston, Buechel, Fink, Morris, Rolls and Dolan1997). As physiological term, the time-series was extracted from region of interest (ROI) masks of the right and left amygdala separately, masked by the T-contrast image of the task effect (faces > shapes; t ⩾ 0.1; k ⩾ 10 voxels). Locations of extracted time-series were predominantly (87% and 89%) in the laterobasal amygdala. As psychological terms, all regressors modeling the task were included. As PPI terms, each psychological term was multiplied by the physiological term (right or left amygdala time-series, respectively) and convolved with the canonical hemodynamic response function implemented in SPM (McLaren et al., Reference McLaren, Ries, Xu and Johnson2012). Head motion parameters were included as regressors of no interest. For each individual and each amygdala separately, linear contrast images were computed for (1) the effect across conditions (‘PPI faces and PPI shapes’), and (2) the differential effect between conditions (‘PPI faces > PPI shapes’), which were then entered into group analyses.
Group analyses
Consistent with study 1, in order to use equivalent statistical methods for brain response and FC, we performed analyses of variance for repeated measures (rmANOVAs) for all group level analyses. For brain activation, one rmANOVA with the between-subject factor, ‘group’ (controls/relatives/patients) and the within-subject factor ‘condition’ (faces/shapes) was conducted. For FC, two rmANOVAs were conducted to assess the FC effects across and between conditions. Both analyses included the between-subject factor ‘group’ and the within-subject factor ‘seed location’ (right amygdala/left amygdala). For the across-conditions analysis, linear contrast images ‘PPI faces and PPI shapes’ were used as dependent variables. For FC effects between conditions, the linear contrast ‘PPI faces > PPI shapes’ was used. To eliminate task-unspecific between-subject variance, in all rmANOVAs, the individual mean over conditions or seed locations were modeled additionally. Potentially confounding effects of site were assessed by including site as covariates of no interest in post-hoc analyses.
Effects of NA on brain response and amygdala FC (right and left amygdala separately, across conditions and faces > shapes) were assessed in ANOVA analyses in SPM, including NA as covariate of interest as well as the factor group, and age, sex, and site as covariates of no interest. Group effects on amygdala FC were investigated in a subsample including only unmedicated patients.
Regions of interest and statistical thresholds
We used identical ROI masks as in study 1. The amygdala masks, which were generated in a literature-based approach (Beck et al., Reference Beck, Wüstenberg, Genauck, Wrase, Schlagenhauf, Smolka, Mann and Heinz2012), as combined maps of coordinates of peak effects in the amygdala reported in 19 studies of the faces matching task, and anatomical atlases of the amygdala (Zilles et al., Reference Zilles, Schleicher, Palomero-Gallagher, Amunts, Toga and Mazziotta2002; Amunts et al., Reference Amunts, Kedo, Kindler, Pieperhoff, Mohlberg, Shah, Habel, Schneider and Zilles2005). A ROI mask of the PFC for hypothesis-driven tests was created of the combined anatomical boundaries of the lateral, medial, and orbital surfaces of the frontal lobe as provided by the automated anatomical labeling atlas as implemented in the WFU pickatlas for SPM (see online Supplementary Section S5).
To decrease the alpha error probability, we performed a Bonferroni-correction for nine tests (three group contrast, respectively, for activity, FC across, and FC between conditions) and applied a statistical threshold of p < 0.0055 to voxel-wise whole-brain FWE-corrected results of the main analyses. Anatomical labeling of coordinates of group effects was performed using the Anatomy toolbox for SPM, version 2.1 (Eickhoff et al., Reference Eickhoff, Stephan, Mohlberg, Grefkes, Fink, Amunts and Zilles2005). We further used the intrinsic connectivity network (ICN) atlas (Kozák et al., Reference Kozák, van Graan, Chaudhary, Szabó and Lemieux2017) to identify the spatial involvement of group effects with functional networks (online Supplementary Sections S6 and S13). ROI masks and statistical images of group and task effects are provided at Neurovault (Gorgolewski et al., Reference Gorgolewski, Varoquaux, Rivera, Schwarz, Ghosh, Maumet, Sochat, Nichols, Poldrack, Poline, Yarkoni and Margulies2015; https://neurovault.org/collections/DGADFDYM/).
Exploratory analysis
We explored group effects on task-dependent FC of the left superior frontal gyrus (SFG), where we found activation to be negatively correlated with NA in controls and patients, but not in relatives.
Results
Sample characteristics
Clinical and demographic sample characteristics are provided in Table 1. Groups did not significantly differ in age, sex, years of education, type of school education, and vocabulary test scores. Patients had significantly higher NA scores than relatives and controls, while relatives did not significantly differ from controls (online Supplementary Table S6). On average, participants responded faster in the shapes condition than in the faces condition (mean response time shapes = 1.12 s, s.d. = 0.23; mean response time faces = 1.21 s, s.d. = 0.25; F = 55.10; p < 0.0001). There were no statistically significant group differences or group-by-condition interactions in response time.
Table 1. Sample characteristics (N = 203)

BDI, Beck's Depression Inventory; CGI, Clinical Global Impression; GAF, Global Assessment of Functioning; H, Kruskal–Wallis-H; HAM-D, Hamilton Depression Inventory; MDD, Major Depressive Disorder; NEO, NEO Five Factory Inventory; SCL-90-R, Symptom Checklist-90-Revised; STAI-S, State Trait Anxiety Inventory-State Anxiety; STAI-T, State Trait Anxiety Inventory – Trait Anxiety; ZI, Central Institute of Mental Health.
P was assessed two-sided.
Task-related brain activity
Brain response across groups was increased during faces compared to shapes matching in the visual cortex, subcortical structures (thalamus, hippocampus, and amygdala), pre- and postcentral regions, the dorsal prefrontal cortex, and temporal areas (online Supplementary Section S9).
Groups did not differ in voxel-wise analyses of brain activation. ROI-analyses of group effects on amygdala response revealed marginal differences (patients > relatives > controls) on a descriptive level, which were not statistically significant (online Supplementary Section S10). In controls and patients, but not in relatives, NA was inversely correlated with brain response (faces > shapes) in a cluster in the left SFG (BA32; T = 4.37; p = 0.029, FWE-corrected for the PFC ROI; Fig. 2). Additionally, in patients, activation in this cluster was inversely correlated with the Hamilton Depression score and the global clinical impression scale (online Supplementary Section S11).
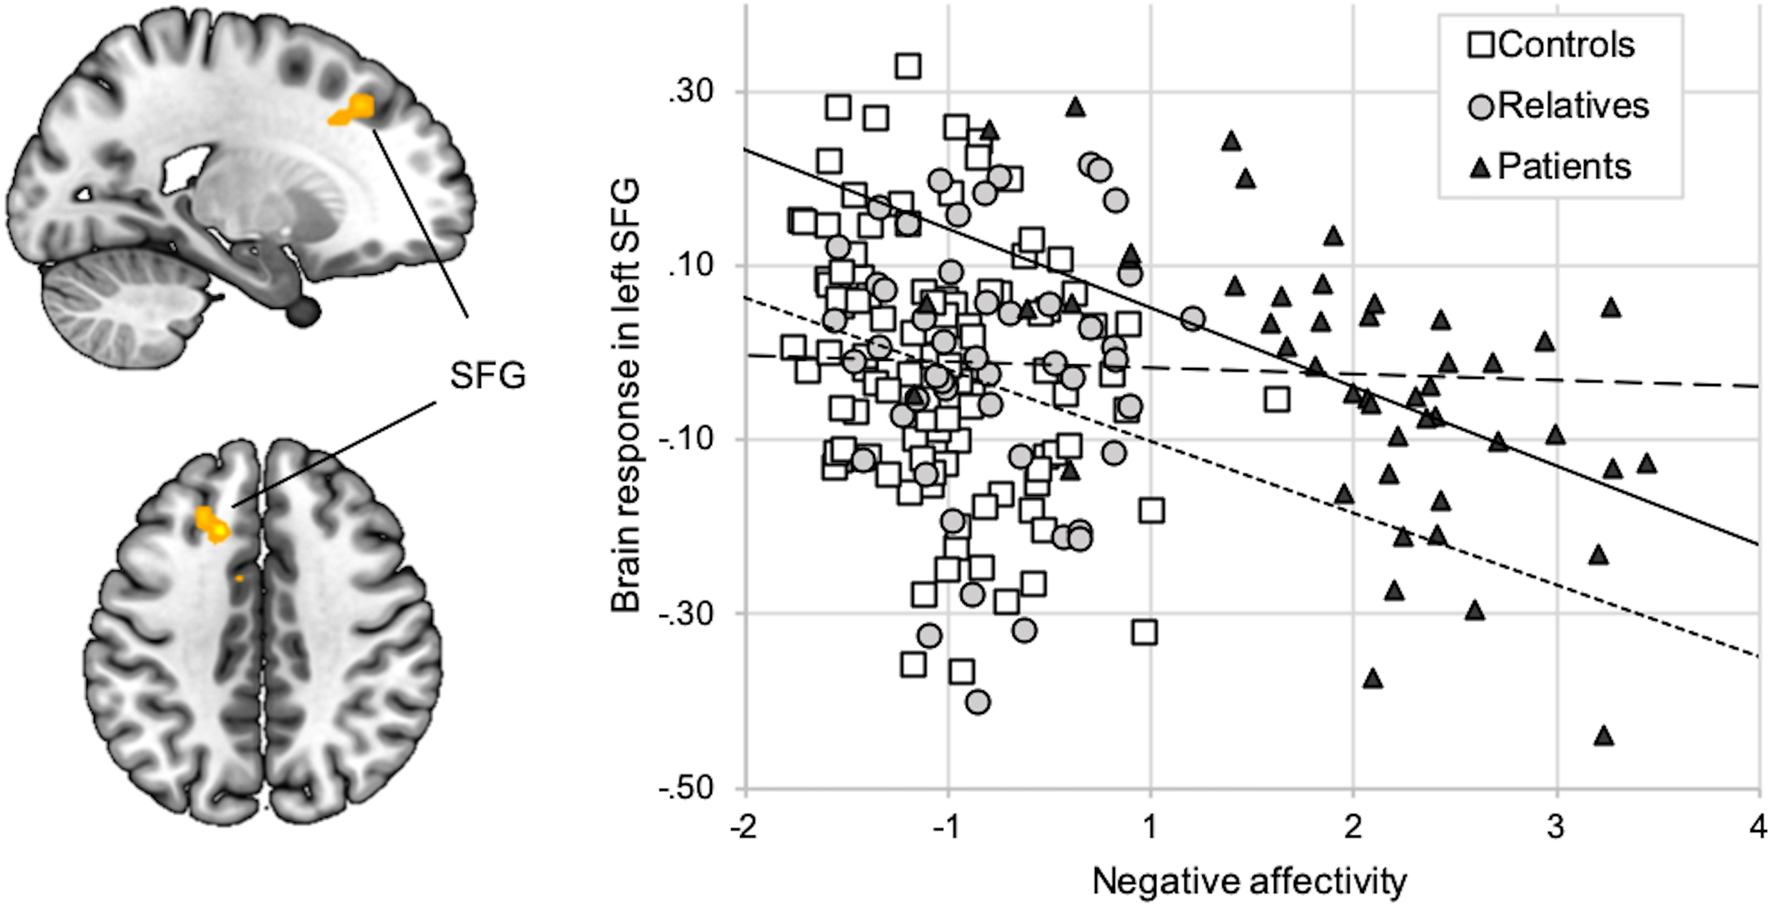
Fig. 2. Correlation between NA and brain response (faces > shapes). Activation during faces compared to shapes (y-axis) in the left SFG (x = −15, y = 23, z = 41; k = 49) was inversely correlated with the NA factor score (x-axis). The correlation was significant across groups (r = −0.22; p < 0.01) as well as in patients (r = −0.53; p < 0.01, regular line) and in controls (r = −0.22; p < 0.01; short-dotted line), but not in relatives (r = −0.02; p = 0.88; long-dotted line).
Task-related amygdala functional connectivity
Main effects of condition
During faces compared to shapes matching, amygdala FC was increased with visual regions including the fusiform gyrus and the right inferior frontal gyrus, while it was decreased with midline structures (precuneus, cuneus, posterior and mid cingulate gyrus, anterior cingulate cortex) and temporal regions (online Supplementary Section S9).
Group effects on amygdala FC
In the pathology contrast (controls and relatives > patients), across conditions, patients showed decreased amygdala FC compared to controls and relatives in midline structures including the right medial prefrontal cortex, the posterior cingulum and the parietal cortex. ICN atlas labeling of these regions indicated the highest spatial involvement with the DMN (Fig. 3a, online Supplementary Table S12, Fig. S10).

Fig. 3. Effects of pathology (controls and relatives > patients) on amygdala FC are depicted across conditions (a) and between conditions (b). Across conditions, MDD patients showed reduced amygdala FC with the middle frontal gyrus (BA10), the mid cingulate cortex, precuneus, and bilateral angular gyrus. Statistically significant group-by-condition interactions were observed in the right prefrontal cortex (BA6, BA9), showing reduced amygdala FC during faces compared to shapes processing in MDD patients. The significance-threshold is p < 0.05 family-wise error corrected for the whole-brain, cluster size k = 10 voxels, error bars indicate +1 standard error of the mean. BA, Brodmann area; HC, healthy controls; FC, functional connectivity; MDD, major depressive disorder; REL, relatives.
Analyses of group-by-condition interactions revealed a cluster in the right middle frontal gyrus (BA6, BA9) with reduced amygdala FC in the faces condition in patients compared to controls and relatives (Fig. 3b, online Supplementary Table S12). We observed similar results assessing the pathology contrast including unmedicated patients only (online Supplementary Section S15).
In the risk contrast (controls > relatives and patients), across conditions, patients and relatives showed decreased amygdala FC to the superior parietal cortex and right SFG (BA6), clusters showing strongest spatial involvement with fronto-parietal components (Fig. 4a, online Supplementary Table S13, Fig. S11). Analyses of group-by-condition interactions revealed a cluster in the right fusiform gyrus, in which amygdala FC during faces matching was reduced in relatives and patients compared to controls (Fig. 4b, online Supplementary Table S13).

Fig. 4. Effects of risk (controls > relatives and patients) on amygdala FC are depicted across conditions (a) and between conditions (b). Across conditions, relatives and MDD patients showed reduced amygdala FC with frontal and parietal regions. Statistically significant group-by-condition interactions of amygdala FC were observed in the right fusiform gyrus, showing significantly stronger amygdala FC in controls in the faces compared to the shapes conditions, while amygdala FC did not significantly differ between condition in relatives and MDD patients. The significance-threshold is p < 0.05 family-wise error corrected for the whole-brain, cluster size k = 10 voxels, error bars indicate +1 standard error of the mean. BA, Brodmann area; HC, healthy controls; FC, functional connectivity; MDD, major depressive disorder; REL, relatives.
In the resilience contrast (relatives > controls and patients), across conditions, relatives showed increased amygdala FC with the pgACC (BA32) (Fig. 5a, online Supplementary Table S14). Analyses of group-by-condition interactions revealed clusters in the right middle frontal cortex (BA 9) and bilateral temporal cortices, in which amygdala FC was increased during the faces condition in relatives compared to controls and patients (Fig. 5b, online Supplementary Table S14).
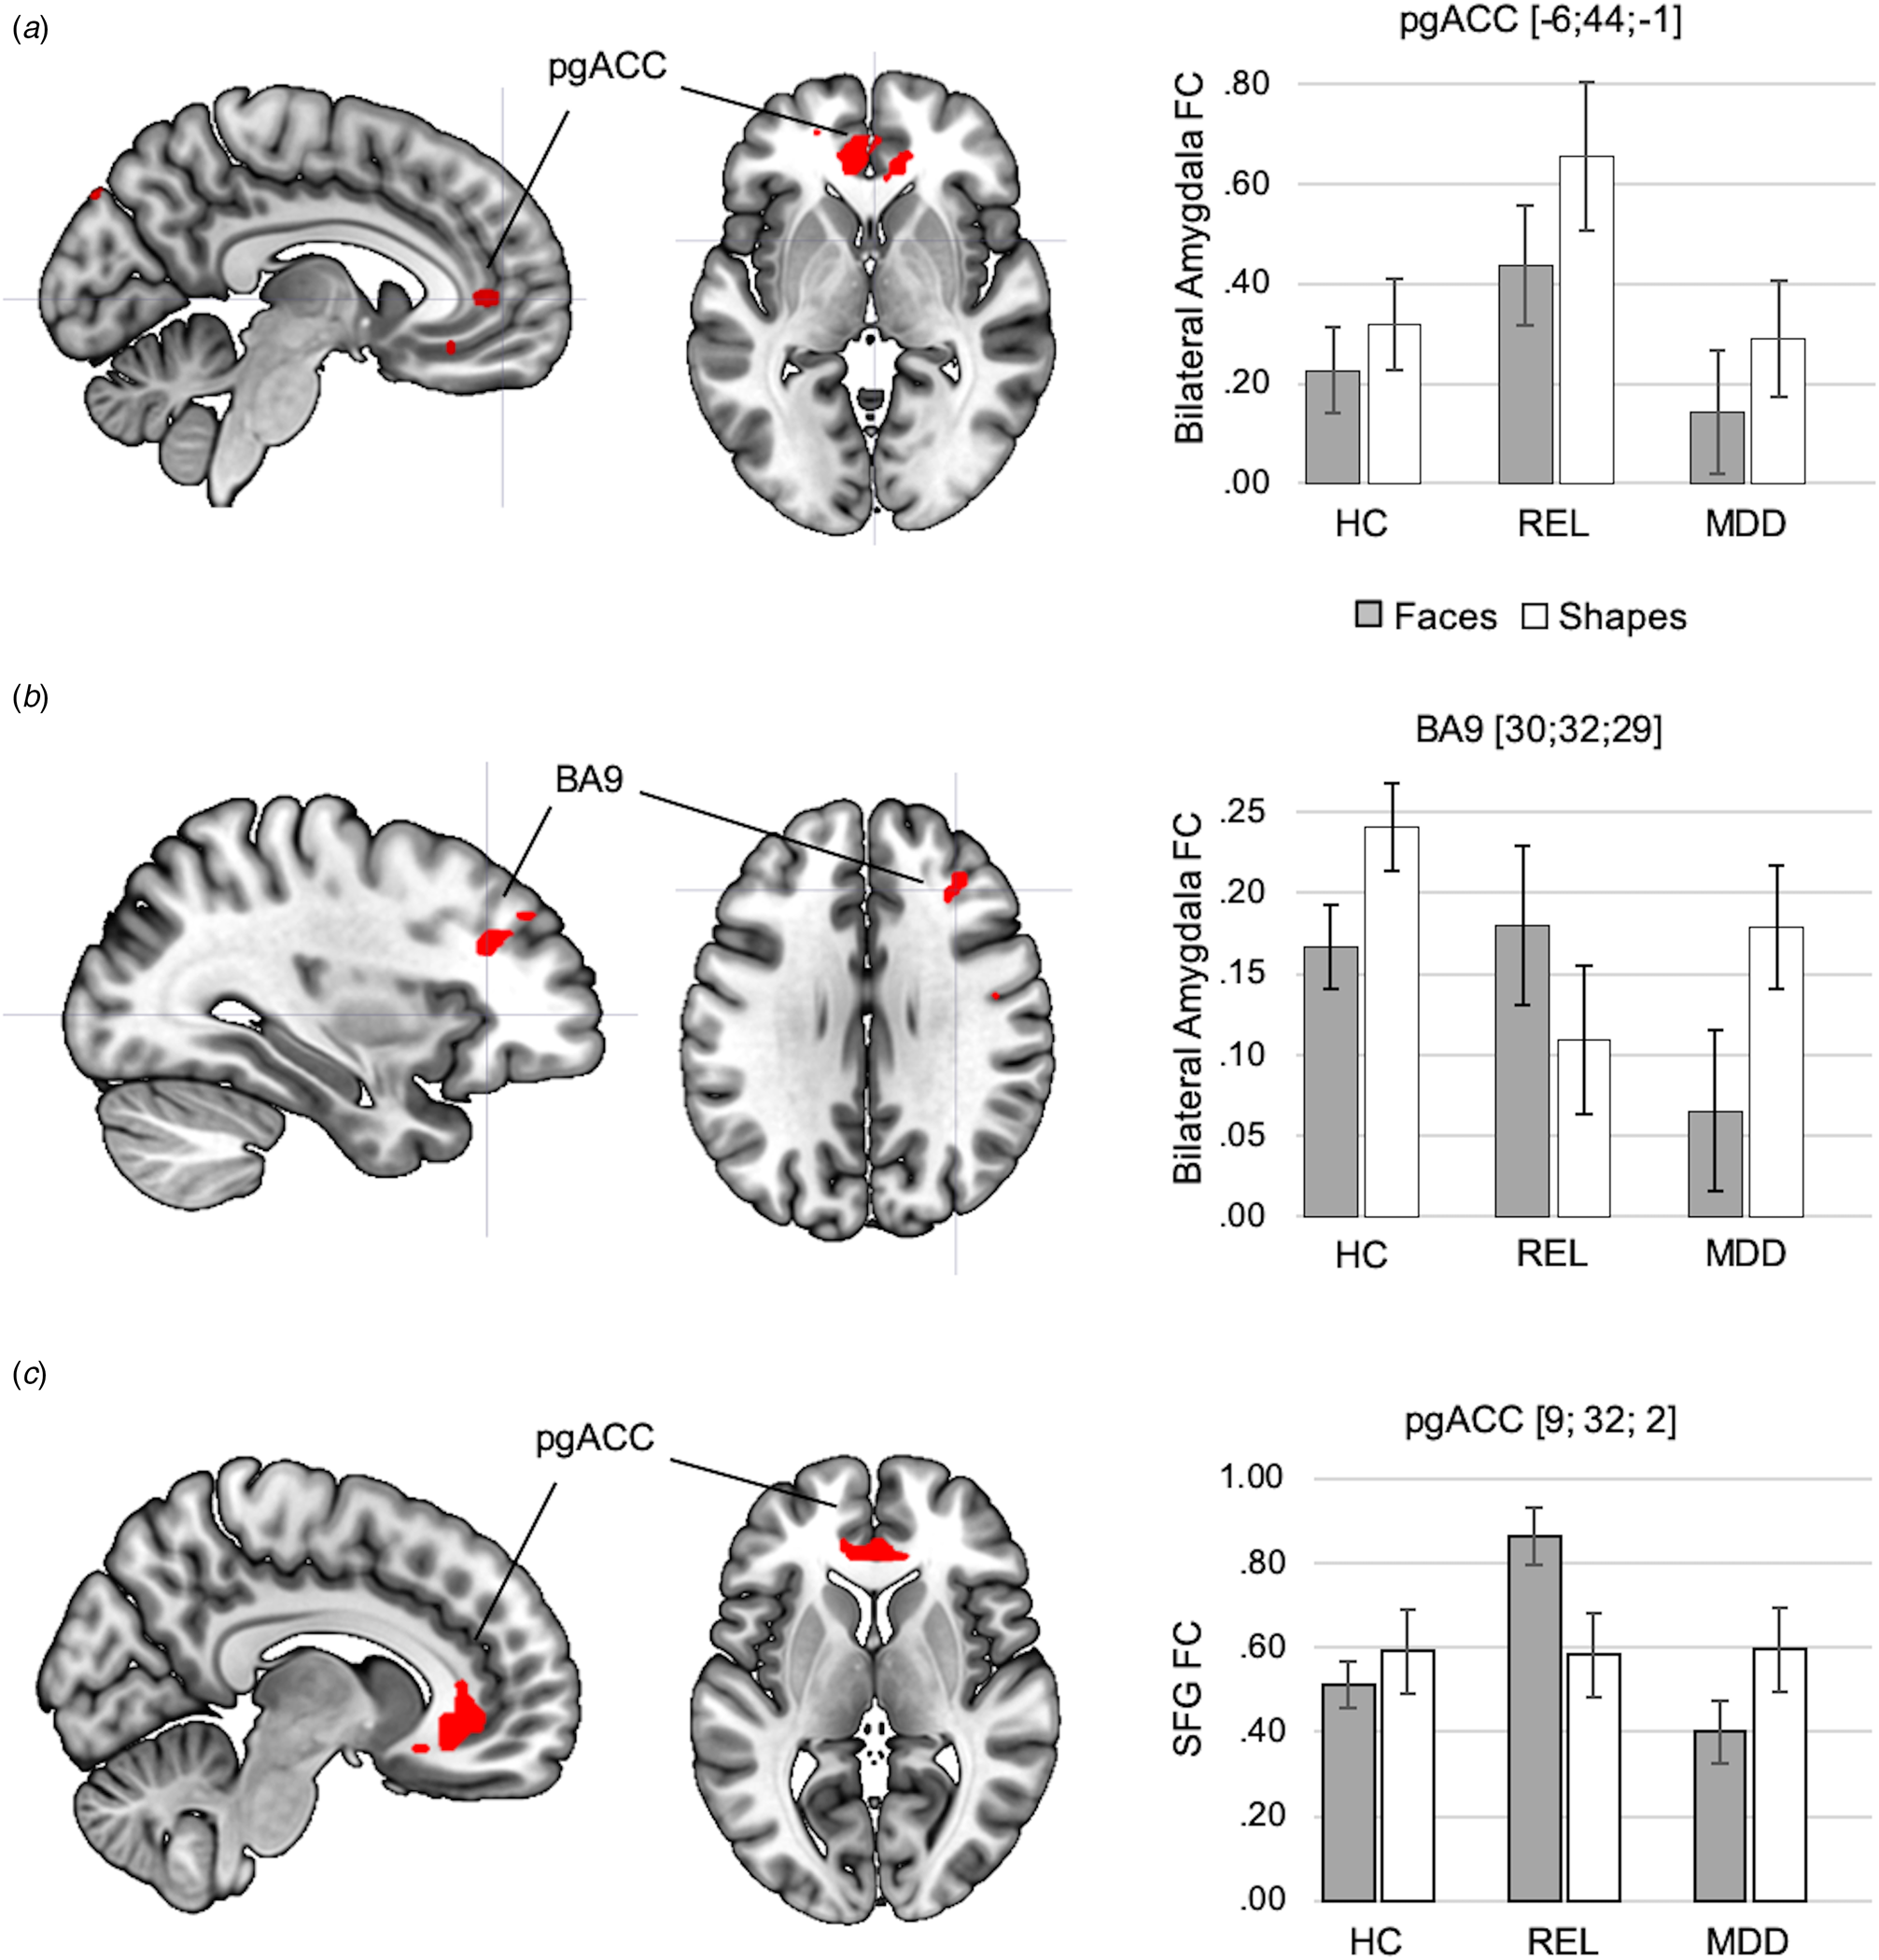
Fig. 5. Effects of resilience capacity (relatives > controls and patients) on amygdala FC are depicted across conditions (a) and between conditions (b). Across conditions, relatives showed increased amygdala FC with the pgACC compared to controls and MDD patients. Statistically significant group-by-condition interactions of amygdala FC were observed in the right prefrontal cortex (BA9), showing stronger amygdala FC in relatives in the faces compared to the shapes conditions, while amygdala FC in controls and MDD patients was significantly lower during faces compared to shapes matching in controls and MDD patients. The significance-threshold is p < 0.05 family-wise error corrected for the whole-brain, cluster size k = 10 voxels. (c) Result of exploratory analysis: the cluster of the SFC, in which activation was inversely correlated with NA in controls and patients, showed a significant group-by-task interaction in FC with the pgACC, which was driven by an increase in SFG-pgACC FC in relatives during faces matching compared to shapes matching. The significance threshold for this result is p < .05 family-wise-error corrected for the PFC ROI. Error bars indicate +1 standard error of the mean. BA, Brodmann area; HC, healthy controls; FC, functional connectivity; MDD, major depressive disorder; pgACC, perigenual anterior cingulate cortex; REL, relatives; SFG, Superior Frontal Gyrus.
The NA score did not show significant effects on amygdala FC in voxel-wise analyses at uncorrected p < 0.0001. A hypothesis-driven investigation of the previously observed negative correlation of NA with amygdala-pgACC FC (Wackerhagen et al., Reference Wackerhagen, Wüstenberg, Mohnke, Erk, Veer, Kruschwitz, Garbusow, Romund, Otto, Schweiger, Tost, Heinz, Meyer-Lindenberg, Walter and Romanczuk-Seiferth2017) revealed a significant effect across groups (r = −0.144; p = 0.020) and in controls (r = −0.164; p = 0.046), but did not reach significance in relatives (r = −0.124; p = 0.197) and patients (r = 0.010; p = 0.474).
Exploratory findings of group differences in SFG FC
Exploratory analyses of FC of the left SFG revealed a significant group by task interaction in the resilience contrast, with an increase of SFG FC in relatives with the pgACC during faces matching compared to the two other groups (p < .05, FWE-corrected for PFC-ROI; Fig. 5c, online Supplementary Section S17).
Including site as a covariate did not significantly change the results.
Discussion
We compared brain response and amygdala FC between MDD patients, controls, and first-degree relatives of MDD patients to disentangle markers of pathology, risk, and resilience capacity.
Task-dependent changes of amygdala FC
We observed comparable effects to our previously reported findings of increased amygdala FC with the fusiform gyrus and right inferior frontal gyrus, and decreased amygdala FC with midline structures including pgACC, precuneus and angular gyrus, in the faces compared to the shapes condition in study two. We suggest that increased amygdala FC with the fusiform and frontal gyrus reflects an increased involvement of visual and central executive structures with salience processing regions during angry and fearful faces processing that likely corresponds to salience-induced attention. We previously discussed reduced amygdala FC during faces matching with the pgACC to result from an inverse co-activation of these regions, which might correspond to an inhibitory control process of prefrontal structures over the amygdala (Etkin et al., Reference Etkin, Egner and Kalisch2011; Bzdok et al., Reference Bzdok, Langner, Schilbach, Engemann, Laird, Fox and Eickhoff2013) as a neural mechanism of automatic attentional regulation (Phillips et al., Reference Phillips, Ladouceur and Drevets2008). This pattern could also be explained by a relative uncoupling of amygdala and the DMN during faces matching, as the more salient faces condition might suppress the task-negative DMN and enhance exteroceptive processing circuits, which the visual and frontal regions, that increased in amygdala FC during faces processing, belong to.
Pathology
While limbic-prefrontal activation did not significantly differ between groups, activation in the faces > shapes contrast in the left SFG (BA32) was inversely correlated with NA, which is in line with the limbic-cortical imbalance model, proposing negatively biased emotion processing to correspond to a hypoactivation of dorsal prefrontal structures. However, as meta-analyses reporting limbic-prefrontal imbalance in MDD mainly included studies of emotional regulation (Graham et al., Reference Graham, Salimi-Khorshidi, Hagan, Walsh, Goodyer, Lennox and Suckling2013), processing of sad and happy faces (Fitzgerald et al., Reference Fitzgerald, Laird, Maller and Daskalakis2008; Lai, Reference Lai2014), or glucose metabolism at rest (Sacher et al., Reference Sacher, Neumann, Fünfstück, Soliman, Villringer and Schroeter2012), our null-findings in group comparisons of task activation could indicate that the limbic-cortical imbalance model is not completely generalizable to implicit processing of angry and fearful faces. Given the marginal trend of increased amygdala response in relatives and patients, the effects might not be large enough to be detected in our sample size (Munafò et al., Reference Munafò, Brown and Hariri2008).
Compared to the unaffected groups, patients showed a decrease of amygdala FC with midline structures including key regions of the DMN, which also decreased in amygdala FC in the faces > shapes contrast across groups. While the condition-dependent changes in amygdala FC in these regions did not differ in patients, their connectivity was decreased across conditions. Increased activation and connectivity of the DMN have been attributed to rumination in MDD (Marchetti et al., Reference Marchetti, Koster, Sonuga-Barke and Raedt2012; Graham et al., Reference Graham, Salimi-Khorshidi, Hagan, Walsh, Goodyer, Lennox and Suckling2013; Kaiser et al., Reference Kaiser, Andrews-Hanna, Wager and Pizzagalli2015), and it has been suggested that the amygdala, as part of the salience network, acts as a switch between the ‘task-negative’ DMN and the ‘task-positive’ central executive network (CEN) (Havlík et al., Reference Havlík, Kozáková and Horáček2017). It could be speculated that a reduced task-independent temporal correlation of amygdala and DMN corresponds to a relative disintegration of the salience network with the DMN, which might contribute to the DMN-predominance and enhanced interoceptive processing in MDD in the absence of external stimulation. This hypothesis should be further investigated in resting state studies.
Furthermore, we observed a group by condition interaction in the middle frontal gyrus (BA6, BA9): while amygdala FC increased during faces matching in controls and relatives, patients showed significantly lower amygdala FC in the faces condition, which might reflect an insufficient integration of executive control and salience processing structures in context of emotional cues as proposed in the limbic-cortical imbalance model (Disner et al., Reference Disner, Beevers, Haigh and Beck2011).
Risk
Both relatives and patients showed decreased amygdala FC with the lateral parietal and SFG across conditions. These regions overlapped with the faces > shapes contrast of amygdala FC at uncorrected p < 0.0001 and compose key components of the CEN. The CEN has been reported to show reduced connectivity in MDD patients in a meta-analysis of resting state studies (Kaiser et al., Reference Kaiser, Andrews-Hanna, Wager and Pizzagalli2015). Reduced resting-state amygdala FC with the right frontal cortex has been shown to be shared by adolescents with depression and at high risk for depression (Singh et al., Reference Singh, Leslie, Packer, Weisman and Gotlib2018b). Together, this suggests a reduced task-independent integration of amygdala and executive control structures as risk mechanism for depression and should be investigated in longitudinal resting state studies.
In group by condition analyses, relatives and patients showed reduced modulation of amygdala FC with the right fusiform gyrus, a region involved in the detection of faces, which overlapped with the faces > shapes contrast of amygdala FC across groups. Aberrations of emotion processing in the early visual stream have been reported in familial risk (Zhong et al., Reference Zhong, Pu and Yao2016; Singh et al., Reference Singh, Leslie, Bhattacharjee, Gross, Weisman, Soudi, Phillips and Onopa2018a) as well as in depression (Ho et al., Reference Ho, Zhang, Sacchet, Weng, Connolly, Henje Blom, Han, Mobayed and Yang2016). Alterations in the stimulus-dependent integration of visual input regions with the amygdala might thus play a role in the etiology of affective disorders and should be investigated in prospective studies.
Resilience capacity
Relatives showed increased amygdala FC with the pgACC across conditions, not only compared to controls, as previously reported (Wackerhagen et al., Reference Wackerhagen, Wüstenberg, Mohnke, Erk, Veer, Kruschwitz, Garbusow, Romund, Otto, Schweiger, Tost, Heinz, Meyer-Lindenberg, Walter and Romanczuk-Seiferth2017), but also compared to patients. We further observed a group-by-condition interaction of amygdala FC in the right SFG, showing an increase of amygdala FC during faces matching in relatives, and a decrease during faces matching in controls and patients. Exploratory analyses of FC of the left SFG, in which lower task response was associated with higher NA in controls and patients, revealed task-dependent increases in amygdala-pgACC FC in relatives during faces processing. Given the mediating role of the pgACC for cortical regulation of the amygdala during facial emotion recognition (Wolf et al., Reference Wolf, Philippi, Motzkin, Baskaya and Koenigs2014; Motzkin et al., Reference Motzkin, Philippi, Wolf, Baskaya and Koenigs2015), our findings might reflect an intensified integration of executive and salience signals through a stronger involvement of the pgACC, both during faces processing and independent of task conditions, in relatives. This altered neural mechanism of emotional faces processing might play a compensatory role in relatives and might contribute to the lack of an association between SFG task response and NA in relatives.
Our previously reported negative association of amygdala-pgACC FC and NA was present across groups and in the control sample including controls from study 2, but did not reach significance in the smaller relatives group and was not present in patients. A false negative result due to a lack of statistical power is to be considered. Altogether, our findings suggest a protective role of pgACC involvement in the limbic-cortical integration during emotional processing, which should be investigated in prospective studies.
Limitations
We assessed differences of brain activity and amygdala FC between faces and shapes matching, which we assumed to elicit neural processes relevant for emotional processing. However, a comparison with neutral faces instead of shapes and with a resting condition would have allowed to distinguish effects of emotional valence/arousal and of the matching task itself, which would have provided a better understanding of the psychological processes underlying the imaging measures that were elicited during our task.
Since our cross-sectional approach cannot identify causal relationships, the validity of reported putative risk and resilience markers needs to be proven in prospective studies conceptualizing resilience as an absence of psychopathology or quick recovery after stress (Kalisch et al., Reference Kalisch, Baker, Basten, Boks, Bonanno, Brummelman, Chmitorz, Fernàndez, Fiebach, Galatzer-Levy, Geuze, Groppa, Helmreich, Hendler, Hermans, Jovanovic, Kubiak, Lieb, Lutz, Müller, Murray, Nievergelt, Reif, Roelofs, Rutten, Sander, Schick, Tüscher, Diest, van Harmelen, Veer, Vermetten, Vinkers, Wager, Walter, Wessa, Wibral and Kleim2017).
Our assumption of resilience/compensation as the contrast in which relatives showed stronger amygdala FC than controls and patients is highly simplified and may not be the only possible interpretation. Unique features in relatives might as well present risk mechanisms that occur before the onset of depression and recede in the course of the illness or its medication.
Furthermore, it is possible that patients who had first-degree relatives with MDD had compensatory or resilience mechanisms but were faced with a larger familial risk load due to a larger number of affected relatives. Future studies should document the number of affected relatives, which we did not do in our relatives sample, in order to allow for an investigation of this matter.
As FC is a correlative measure and cannot be interpreted with respect to causal effects and directions between the involved regions, we have taken care to interpret it as the degree of involvement in the same process in favor of speculating about inhibitory or excitatory signaling. Complementary measures such as dynamic causal modeling would be of high interest to reveal causal relationships between the regions with altered FC that were observed here.
While our focus on amygdala FC builds on an established body of literature, it might lead to a reductionist view of brain function and should be complemented by network approaches. Although our post-hoc analysis revealed comparable effects in unmedicated patients, medication effects should be systematically assessed in future studies. Finally, although our findings of shared aberrant amygdala FC in the patient and the relatives group compared to controls provide evidence of one validity criterion of an IP, other important validity criteria, e.g. its heritability, need to be proven.
Conclusion
Our results suggest a reduced SFG response to faces v. shapes processing, reduced task-independent amygdala FC with DMN regions, and diminished amygdala FC with the medial frontal gyrus during faces compared to shapes matching as markers of depressive pathology. Task-independent reductions of amygdala FC with fronto-parietal regions and a reduced faces-dependent modulation of amygdala-fusiform FC might present risk markers and putative IPs for depression, while a false negative finding of amygdala hyperreactivity due to a limited sample size is to be considered. Last, increased task-independent amygdala-pgACC FC, and increased faces-modulated amygdala-pgACC-SFG FC might reflect an intensified integration of executive and salience signals in unaffected participants at increased familial risk for depression, which might serve as compensatory mechanism, potentially contributing to resilience capacity. Provided that the considered pathogenic implications of our findings can be confirmed in prospective studies, these results can contribute to a person-tailored clinical prognosis and therapeutic prescription in the future, which might improve treatment efficacy and economic efficiency in health care and help to reduce the burden of depression.
Supplementary material
The supplementary material for this article can be found at https://doi.org/10.1017/S0033291719002885
Financial support
The research reported in this manuscript has been funded by the German Federal Ministry for Education and Research (BMBF) grants NGFNplus MooDS (Systematic Investigation of the Molecular Causes of Major Mood Disorders and Schizophrenia) and the Integrated Network IntegraMent (Integrated Understanding of Causes and Mechanisms in Mental Disorders) under the auspices of the e:Med program (grant numbers O1ZX1314B and O1ZX1314G).
Conflict of interest
A.M.-L. has received consultant fees from Boehringer Ingelheim, Elsevier, Walt Disney Pictures, Brainsway, Lundbeck Int. Neuroscience Foundation, Sumitomo Dainippon Pharma Co., Academic Medical Center of the University of Amsterdam, Synapsis Foundation-Alzheimer Research Switzerland, IBS Center for Synaptic Brain Dysfunction, Blueprint Partnership, University of Cambridge, Dt. Zentrum für Neurodegenerative Erkrankungen, Universität Zürich, L.E.K. Consulting, ICARE Schizophrenia, Science Advances, and has received fees for lectures, interviews, and travels from Lundbeck International Foundation, Paul-Martini-Stiftung, Lilly Deutschland, Atheneum, Fama Public Relations, Institut d'investigacions Biomèdiques August Pi i Sunyer (IDIBAPS), Jansen-Cilag, Hertie Stiftung, Bodelschwingh-Klinik, Pfizer, Atheneum, Universität Freiburg, Schizophrenia Academy, Hong Kong Society of Biological Psychiatry, Fama Public Relations, Spanish Society of Psychiatry, Reunions I Ciencia S.L., Brain Center Rudolf Magnus UMC Utrecht. None of the other authors report biomedical financial relationships with the potential to bias the work.
Ethical standards
The authors assert that all procedures contributing to this work comply with the ethical standards of the relevant national and institutional committees on human experimentation and with the Helsinki Declaration of 1975, as revised in 2008.


 Open access