


Introduction
Bipolar disorder (BD) is a major mental illness characterized by alternating manic and depressive mood episodes, separated by relatively symptom-free intervals. Originally, Kraepelin (Reference Kraepelin1921) suggested that patients with BD reach complete recovery after each mood episode. However, a growing body of evidence has established that patients suffer from illness progression in the form of decreased functioning and disability (Sanchez-Moreno et al., Reference Sanchez-Moreno, Martinez-Aran, Tabarés-Seisdedos, Torrent, Vieta and Ayuso-Mateos2009), cognitive decline (El-Badri, Ashton, Moore, Marsh, & Ferrier, Reference El-Badri, Ashton, Moore, Marsh and Ferrier2001), in combination with cellular aging (Fries et al., Reference Fries, Bauer, Scaini, Wu, Kazimi, Valvassori and Quevedo2017), and less efficient cellular resilience mechanisms (Fries et al., Reference Fries, Pfaffenseller, Stertz, Paz, Dargél, Kunz and Kapczinski2012). The influence of illness progression on research findings is often overlooked. Although the included patients may appear similar from a cross-sectional perspective, they commonly range from having a short to long illness duration with either a favorable or unfavorable longitudinal course, resulting in a heterogeneous sample.
Staging models in medicine have been developed to define Illness progression. For BD, there are two prevailing clinical staging models. Berk et al. (Reference Berk, Conus, Lucas, Hallam, Malhi, Dodd and McGorry2007) introduced a model based on the occurrence and recurrence of mood episodes while Kapczinski et al. (Reference Kapczinski, Dias, Kauer-Sant'Anna, Frey, Grassi-Oliveira, Colom and Berk2009) based their model on impaired inter-episodic functioning (Table 1). In an earlier study, we found clinical markers for illness progression that were related to both models, i.e. familial loading, childhood abuse, psychiatric comorbidity, and treatment resistance (van der Markt et al., Reference van der Markt, Klumpers, Dols, Boks, Vreeker, Beekman and Kupka2021). However, we also found evidence suggesting that each model reflects different aspects of illness progression (van der Markt et al., Reference van der Markt, Klumpers, Dols, Boks, Draisma, van Bergen and Kupka2020). Earlier age at onset of BD was associated with higher stages in the model based on the recurrence of episodes (Berk et al., Reference Berk, Conus, Lucas, Hallam, Malhi, Dodd and McGorry2007), whereas a longer illness duration was associated with higher stages in the model based on inter-episodic functioning (Kapczinski et al., Reference Kapczinski, Dias, Kauer-Sant'Anna, Frey, Grassi-Oliveira, Colom and Berk2009). Based on these findings, we recommended for future studies aimed at understanding illness progression to apply both models.
Table 1. Two staging models for bipolar disorders

Malhi, Rosenberg, and Gershon (Reference Malhi, Rosenberg and Gershon2014) argued that staging models are only meaningful if there is an understanding of the underlying pathophysiology. While our (van der Markt et al., Reference van der Markt, Klumpers, Draisma, Dols, Nolen, Post and Kupka2019, Reference van der Markt, Klumpers, Dols, Boks, Draisma, van Bergen and Kupka2020, Reference van der Markt, Klumpers, Dols, Boks, Vreeker, Beekman and Kupka2021) and other (Goi et al., Reference Goi, Bücker, Vianna-Sulzbach, Rosa, Grande, Chendo and Massuda2015a, Reference Goi, Vianna-Sulzbach, Silveira, Grande, Chendo, Sodré and Gama2015b; Rosa et al., Reference Rosa, Magalhães, Czepielewski, Sulzbach, Goi, Vieta and Kapczinski2014) studies thus far established the clinical utility of the two staging models for BD, underlying mechanisms and corresponding biomarkers have not yet been identified. Structural brain measures, such as global and (sub)cortical volumes, cortical thickness, and cortical surface area may be interesting markers in relation to illness progression. Indeed, when comparing groups of patients with BD with healthy individuals, differences in brain structure are consistently reported. The ENIGMA Bipolar Disorder Working Group published some of the most comprehensive studies on structural brain deviations in BD. They found a widespread pattern of a thinner cortex, but not a smaller surface area in individuals with BD (Hibar et al., Reference Hibar, Westlye, Doan, Jahanshad, Cheung, Ching and Andreassen2018). Also, volumes of subcortical regions, such as the hippocampus, amygdala, and thalamus, have been found to be significantly smaller, alongside larger ventricular volumes (Hibar et al., Reference Hibar, Westlye, Van Erp, Rasmussen, Leonardo, Faskowitz and Andreassen2016).
Accelerated brain aging, which has been related to several psychiatric disorders (Cole et al., Reference Cole, Ritchie, Bastin, Valdés Hernández, Muñoz Maniega, Royle and Deary2018), may be an additional brain measure of interest. Brain age is a composite brain measure related to aging reflecting the biological age, derived from several regional brain metrics, including volume, cortical thickness, and surface area measurements from structural magnetic resonance imaging (MRI) scans. The relative weighting of the individual brain metrics has been learned by training a machine learning model to predict age from these brain metrics in a large dataset. By design, it thus estimates the biological age of the brain, which can be compared with chronological age. The difference between the biological age and chronological age is called the brain-predicted age difference (brain-PAD), also referred to as the brainage gap or brainAGE (brain Age Gap Estimate). Several larger studies found an increase in brain-PAD for patients with BD compared to controls (de Nooij et al., Reference de Nooij, Harris, Hawkins, Clarke, Shen, Chan and Whalley2020; Kaufmann et al., Reference Kaufmann, van der Meer, Doan, Schwarz, Lund, Agartz and Westlye2019; Tønnesen et al., Reference Tønnesen, Kaufmann, de Lange, Richard, Doan, Alnæs and Westlye2020; Van Gestel et al., Reference Van Gestel, Franke, Petite, Slaney, Garnham, Helmick and Hajek2019), implying that the brains of subjects with BD experience accelerated aging. However, these findings were not confirmed in smaller studies (Nenadić, Dietzek, Langbein, Sauer, & Gaser, Reference Nenadić, Dietzek, Langbein, Sauer and Gaser2017; Shahab et al., Reference Shahab, Mulsant, Levesque, Calarco, Nazeri, Wheeler and Voineskos2019), nor in young participants at risk or in the early stages of BD (Hajek et al., Reference Hajek, Franke, Kolenic, Capkova, Matejka, Propper and Alda2019). Although brain-PAD in BD has been studied extensively, none of these studies have controlled for illness progression, thereby neglecting a possible association between the clinical course of the illness in BD and brain-PAD.
The current study aims to explore and gain initial insights into whether global and (sub)cortical brain measures, expressed as volume, cortical thickness, cortical surface area, or brain-PAD may function as biomarkers for illness progression as conceptualized in both staging models in patients with BD-I. We hypothesized (1) a decrease in global and (sub)cortical volumes and a thinner cortex, and (2) an increase of brain-PAD across subsequent stages. We further hypothesized that the likelihood of being in higher stages was more strongly related to brain-PAD than to individual global and regional (sub)cortical brain measures as the calculated brain age is a composite quantity, derived from tens of individual brain regions related to brain aging, thereby reducing the influence of individual variations in brain morphology and noise.
Methods
Study sample
Data were acquired from the Dutch Bipolar Cohort (DBC) (Vreeker et al., Reference Vreeker, Boks, Abramovic, Verkooijen, Van Bergen, Hillegers and Ophoff2016). The DBC is a large case–control study, and a collaboration between the University of California Los Angeles (UCLA) and Dutch healthcare institutes of the University Medical Center Utrecht (UMC Utrecht), GGZ Altrecht, GGZ inGeest, University Medical Center Groningen, Delta Center for Mental Health Care, Dimence, Parnassia (PsyQ), and Reinier van Arkel Group, investigating genetic and phenotypic information of subjects with bipolar disorder type I (BD-I), their first-degree relatives, and controls.
Data of 1396 subjects with BD-I, 589 first-degree relatives, and 266 control subjects were collected. Subjects were recruited between June 2011 and April 2015 through various means, i.e. via clinicians, the Dutch BD patient association, pharmacies, advertisements, self-referral, and participation in previous UMCU studies.
Inclusion criteria were: a minimum age of 18, at least three biological grandparents of Dutch ancestry to acquire a homogeneous genetic sample, and a thorough understanding of the Dutch language. For the subjects with BD, an additional requirement was the diagnosis of BD-I as verified by the Structured Clinical Interview for DSM-IV (SCID-I [First, Spitzer, Gibbon, & Williams, Reference First, Spitzer, Gibbon and Williams2002]). Inclusion criteria for the controls were no diagnosis of BD, schizophrenia, or any other psychotic disorder, nor in a first-degree relative. Controls were screened for psychiatric diagnoses using the M.I.N.I. (Mini International Neuropsychiatric Interview [Sheehan et al., Reference Sheehan, Lecrubier, Sheehan, Amorim, Janavs, Weiller and Dunbar1998]). The presence of co-occurring psychiatric conditions, such as substance use disorders and anxiety disorders, did not lead to exclusion from the study.
The assessments were done by a group of carefully trained staff members and consisted of PhD-students, research assistants, trainee psychiatrists, psychologists, and medical students, under the supervision of experienced psychiatrists. Subjects with BD, relatives, and controls received a small allowance (respectively 40, 20, or 20 euros) to cover expenses. The study was approved by the medical ethical committee of the UMC Utrecht and all participants gave written informed consent.
In the current study, we used a subsample of the DBC of 256 subjects with BD and 166 control subjects, of whom high-quality T1-weighted MRI scans were acquired. All subjects with a chronological age above 60 (38 subjects with BD and 19 controls) were excluded from the main analysis as the study by Han et al. (Reference Han, Dinga, Hahn, Ching, Eyler, Aftanas and Schmaal2020) showed higher errors in determining the brain age in individuals over 60 years. The sample thus consisted of 218 subjects with BD and 147 controls.
Baseline characteristics
For all participants, demographic information was obtained, including age at inclusion, sex, left or right-handedness, and IQ.
The questionnaire for bipolar disorders (QBP [Akkerhuis et al., Reference Akkerhuis, Nolen, Kupka, Drexhage, Fekkes and Wiersma2013]), an adaption of the Enrolment Questionnaire as previously used in the Stanley Foundation Bipolar Network by Leverich et al. (Reference Leverich, Nolen, Rush, McElroy, Keck, Denicoff, Suppes and Post2001) and Suppes et al. (Reference Suppes, Leverich, Keck, Nolen, Denicoff, Altshuler and Post2001), was administered to the subjects with BD only, asking questions including age at onset, number of depressive episodes, number of manic and/or hypomanic episodes, and lithium use at the time of MRI-scanning (yes/no).
Staging
Each subject with BD was assigned to a stage from the models based on the number of episodes (Berk et al., Reference Berk, Conus, Lucas, Hallam, Malhi, Dodd and McGorry2007) and based on inter-episodic functioning (Kapczinski et al., Reference Kapczinski, Dias, Kauer-Sant'Anna, Frey, Grassi-Oliveira, Colom and Berk2009). We implemented substages for stage 3c with thresholds at 5 and 10 mood episodes in line with suggestion from a prior study (van der Markt et al., Reference van der Markt, Klumpers, Dols, Boks, Draisma, van Bergen and Kupka2020). Subjects were classified into stages using a decision flowchart that was previously applied in two other studies (van der Markt et al., Reference van der Markt, Klumpers, Dols, Boks, Draisma, van Bergen and Kupka2020, Reference van der Markt, Klumpers, Dols, Boks, Vreeker, Beekman and Kupka2021) (online Supplementary Fig. S1).
To determine the stage in the model based on the number of episodes (Berk et al., Reference Berk, Conus, Lucas, Hallam, Malhi, Dodd and McGorry2007), items from the QBP (Akkerhuis et al., Reference Akkerhuis, Nolen, Kupka, Drexhage, Fekkes and Wiersma2005) were used. With the QBP, we assessed current or previous episodes and recovery in the last year. Out of the 218 subjects with BD, a total of 199 subjects could be assigned to a stage, resulting in n = 6 for stage 3a, n = 12 for stage 3b, n = 33 for stage 3c (fewer than 5 episodes), n = 79 for stage 3c (6–10 episodes), n = 60 for stage 3c (over 10 episodes), n = 9 for stage 4.
For the model based on inter-episodic functioning (Kapczinski et al., Reference Kapczinski, Dias, Kauer-Sant'Anna, Frey, Grassi-Oliveira, Colom and Berk2009), the GAF-score from the QBP questionnaire, information on current mood episodes, and items on work, work limitations, and independent functioning were used to determine the stage. A total of 199 subjects could be staged, resulting in n = 21 for stage I, n = 65 for stage II, n = 98 for stage III, and n = 15 for stage IV.
Missings (n = 19 for each model) were due to missing items on the questionnaires. See Table 1.
Brain imaging
Three-dimensional T1-weighted images were acquired on a 3 T Philips Achieva scanner (Philips Healthcare, Best, The Netherlands), equipped with an eight-channel SENSE head coil. Fast field echo scans with 200 contiguous sagittal slices (TE = 4.6 ms, TR = 10 ms, flip angle = 8°, FOV = 240 mm, 0.75 × 0.75 × 0.80 mm3 voxels) were made. An independent radiologist evaluated the brain scans of all participants.
Image processing was done on the neuroimaging computer network of the University Medical Center Utrecht, Utrecht, the Netherlands. All images were processed using the FreeSurfer 5.1.0 image analysis suite (http://surfer.nmr.mgh.harvard.edu) for cortical reconstruction and segmentation (Fischl & Dale, Reference Fischl and Dale2000). According to the findings of Janssen et al. (Reference Janssen, Alloza, Díaz-Caneja, Santonja, Pina-Camacho, Gordaliza and Schnack2022), utilizing this version of FreeSurfer yielded outcomes comparable to the more recent version 6.0, indicating that the older version remains a valid and reliable option for image analysis. T1-weighted images were registered to the Talairach atlas (Laitinen, Reference Laitinen1989) and intensity variations were corrected. The image was then skull-stripped and the remaining voxels were classified as white matter or non-white matter based on intensity and neighbor constraints (Ségonne et al., Reference Ségonne, Dale, Busa, Glessner, Salat, Hahn and Fischl2004). Cutting planes were computed to separate the hemispheres and remove the cerebellum and brain stem. Any interior holes in the components representing white matter were filled. The initial triangular tessellation was formed on the surface of this white matter mass to create a surface mesh representation and then smoothed using a deformable surface algorithm to form the grey/white surface. The algorithm was further used to expand the surface to obtain the grey matter–cerebrospinal fluid interface, i.e. the cortical surface (Dale, Fischl, & Sereno, Reference Dale, Fischl and Sereno1999; Fischl & Dale, Reference Fischl and Dale2000). Images were registered to a spherical atlas and cortical thickness measures were obtained by calculating the distance between the grey/white matter boundary and the cortical surface at approximately 320 000 points across the cortex (Dale et al., Reference Dale, Fischl and Sereno1999). All images were coded to ensure investigator blindness to subject identification and group.
Global measures and (sub)cortical volumes
Segmentation of gray and white matter was visually checked and control points were added where necessary. This ensured reliable cortical volume, thickness, and surface area measures. The global brain measures cortical gray and white matter volumes, cerebellum, and lateral ventricles were estimated per hemisphere. Intracranial volume, third ventricle, mean cortical thickness, and total cortical surface area were also estimated. For the volumetric measures, left and right volumes were added up. For the cerebellum, left and right white and gray matter were combined. For the lateral ventricles, left and right inferior and superior lateral ventricles were combined.
In addition, subcortical volumes of the thalamus, caudate nucleus, putamen, pallidum, hippocampus, amygdala, and nucleus accumbens were extracted for each hemisphere separately (Buckner et al., Reference Buckner, Head, Parker, Fotenos, Marcus, Morris and Snyder2004). These were quality checked according to the guidelines provided by the ENIGMA consortium (http://enigma.ini.usc.edu/), using Surfscan Visualiser (http://ibowman.com/surfscan/). Poorly segmented volumes were removed from the dataset. Volumes of 34 cortical regions were also obtained for each hemisphere based on the Desikan–Killiany cortical atlas (Desikan et al., Reference Desikan, Ségonne, Fischl, Quinn, Dickerson, Blacker and Killiany2006). For regional cortical and subcortical volumes, the mean was calculated by combining left and right hemisphere volumes, then dividing by two. These means were used for further analysis.
Brain age and brain-PAD
To calculate the brain age, pre-trained ENIGMA-based models for males and females by Schirrmeister et al., (Reference Schirrmeister, Schulte, Kessel and Strobel2020) were used, freely available from the photon-ai website (www.photon-ai.com). Following the example of the ENIGMA paper (Han et al., Reference Han, Dinga, Hahn, Ching, Eyler, Aftanas and Schmaal2020), we estimated brain age separately for males and females, because of differential brain developmental trajectories.
These ENIGMA-based models calculate the brain age by combining 77 FreeSurfer-derived brain measures, including intracranial volume, the means ([left + right]/2) of eight left and right subcortical volumes (ventricles, thalamus, caudate nucleus, putamen, palladium, hippocampus, amygdala, and nucleus accumbens) and the 34 left and right cortical thickness and surface area measures. The brain age was then estimated using ridge regression from the Python-based sklearn package.
Brain-PAD was then calculated by subtracting the chronological age at the time of the scan from the biological brain-age predictions.
Statistical analysis
All analyses were primarily exploratory in nature and were performed in SPSS version 27 (IBM Corp., 2020). Descriptive characteristics were compared between groups using χ2 analyses for dichotomous variables and independent samples t tests for normally distributed variables. We used ANOVA and χ2 analyses to explore whether the patients in different stages of the staging models differed on baseline characteristics.
Global and (sub)cortical brain regions
Volume measures were corrected for intracranial volume, sex, and age. The mean cortical thickness measure and cortical surface area were corrected for sex and age. Standardized residuals were saved and used for subsequent analyses. Separate ordinal regression analyses were performed for each brain structure with staging as a dependent ordinal variable, both for the model based on the number of episodes (Berk et al., Reference Berk, Conus, Lucas, Hallam, Malhi, Dodd and McGorry2007) and inter-episodic functioning (Kapczinski et al., Reference Kapczinski, Dias, Kauer-Sant'Anna, Frey, Grassi-Oliveira, Colom and Berk2009). Analyses of the global and (sub)cortical areas were corrected for false discovery rate (Benjamini & Hochberg, Reference Benjamini and Hochberg1995) due to multiple testing for 15 tests per staging model for the global and subcortical areas and 34 tests per staging model for the cortical areas.
Brain-PAD
Separate ordinal logistic regression analyses were performed for each model to examine whether the brain-PAD significantly increased over subsequent stages in individuals with BD. Following the example by Han et al. (Reference Han, Dinga, Hahn, Ching, Eyler, Aftanas and Schmaal2020), to correct for the influence of chronological age on brain-PAD, age and age2 were added as covariates to the regression model.
Sensitivity analyses
To investigate the effect of lithium use (associated with normalizing decreased brain volumes in BD [Hafeman, Chang, Garrett, Sanders, & Phillips, Reference Hafeman, Chang, Garrett, Sanders and Phillips2012] and lower discrepancy between brain age and chronological age [Van Gestel et al., Reference Van Gestel, Franke, Petite, Slaney, Garnham, Helmick and Hajek2019]), all analyses were repeated by adding the binary variable lithium use (yes [Li+]/no [Li−]) at the time of the MRI scan as a covariate to the models. For exploratory purpose, analyses were repeated in both Li+ and Li− groups separately. To further explore the significant finding of the brain-PAD for the staging model based on inter-episodic functioning, the average brain-PAD per stage was plotted and relevant t tests were carried out to investigate group differences.
To examine the impact of current IQ on our results, analyses were repeated adding current IQ as a covariate to the models. Analyses were also repeated including subjects aged over 60 to investigate if excluding subjects over 60 indeed led to a better age prediction, as suggested by a previous paper by Han et al. (Reference Han, Dinga, Hahn, Ching, Eyler, Aftanas and Schmaal2020), since there is too much variety in aging not related to BD above this age. Lastly, analyses were repeated correcting for comorbid anxiety disorders and comorbid substance use disorders respectively, to examine their impact on the findings.
Results
Characteristics of the study sample
The sociodemographic and psychiatric characteristics of the study sample are listed in Table 2. The mean age differed significantly between subjects with BD and controls (p = 0.022), i.e. subjects with BD were on average 2.9 years older. Compared to controls, subjects with BD had a significantly lower current IQ (p ≤ 0.001) and premorbid IQ (p = 0.039).
Table 2. Characteristics of the study sample
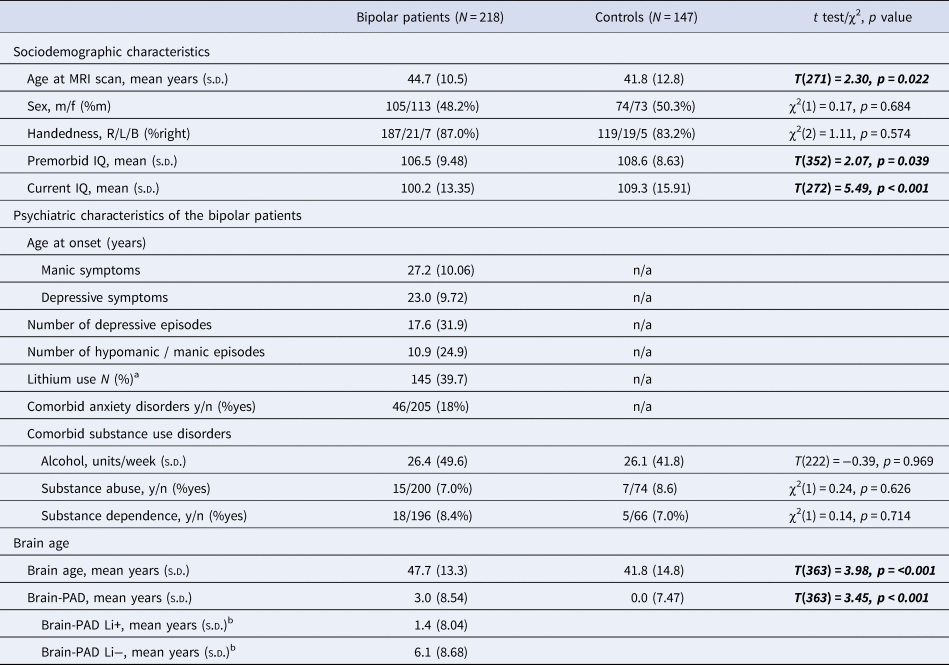
a At the time of the scan.
b Lithium as regression coefficient (OR 1.962, range 1.085–3.550, p 0.026).
Significant results in bold and italic.
For both models, baseline characteristics were compared between subjects in the different stages, see online Supplementary Table S1. For the model based on the number of episodes, the age at the MRI scan differed across the stages with no clear pattern (p < 0.001). For the model based on inter-episodic functioning, current IQ decreased significantly across stages (p = 0.009).
The sociodemographic and psychiatric characteristics of the sample including subjects over 60 years of age are shown in online Supplementary Table S2. Subjects with BD were significantly older (p = 0.026) compared to controls. Subjects with BD had a significantly lower current IQ (p ≤ 0.001) but did not differ in premorbid IQ (p = 0.234).
Global measures and subcortical volumes
Table 3 shows the results of the ordinal logistic regression analyses between global and subcortical regions and staging models, and online Supplementary Table S3 shows the results for the cortical volumes. No significant associations were found after applying correction for the false discovery rate.
Table 3. Associations between global and subcortical brain measures and brain-PAD and illness progression for both models, with global and subcortical brain measures corrected for intracranial volume (except cortical thickness and cortical surface measures), age, and sex and brain-PAD corrected for age and age2
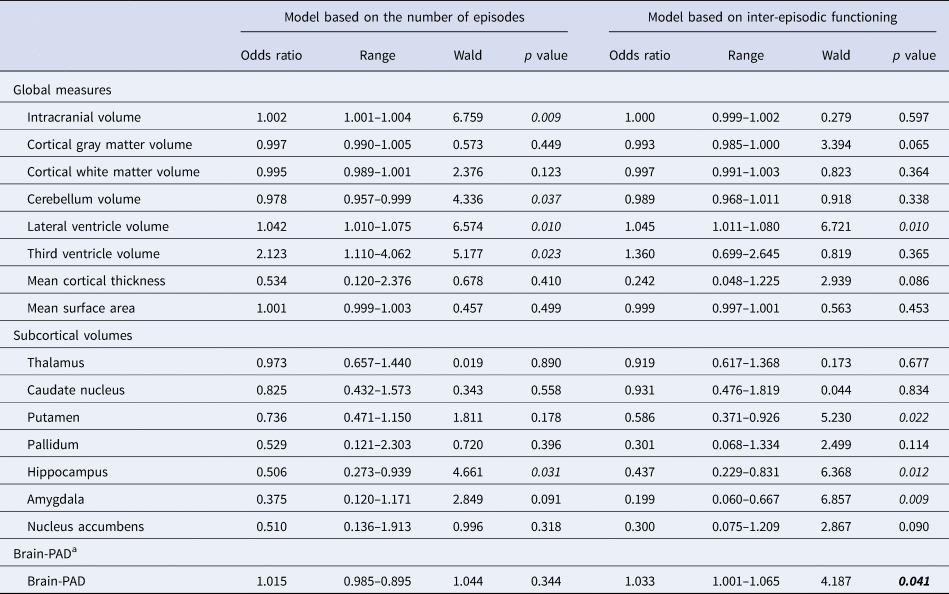
a Corrected for age and age2.
p < 0.05 in italic.
Significant results in bold.
Online Supplementary Table S7 demonstrates the numbers of participants with and without lithium use, anxiety disorders or substance use disorders per stage. Adding lithium use at the time of MRI-scanning, current IQ, or anxiety disorders as a covariate (online Supplementary Tables S4, S5, and S8 respectively) did not change the pattern of findings for both models, nor did including the subjects with a chronological age over 60 years (online Supplementary Table S6). However, adding comorbid substance use disorders as a covariate did change our findings; now, although odds ratios (ORs) were mostly similar or lower, the association between stages and volumes of lateral ventricles, putamen, pallidum, hippocampus, amygdala, and nucleus accumbens and mean cortical thickness reached significance after correcting for multiple testing.
Brain aging
On average, subjects with BD showed a higher brain-PAD of 3 years compared with controls, implying increased aging of the brain in this group.
From online Supplementary Fig. S2, it can be observed that there is a rise in brain-PAD throughout the stages for both models. One could make a valid argument that obtaining a bigger sample size might result in statistically significant outcomes.
An increase in brain-PAD was not significantly associated with the odds of being in a higher stage for the model based on the number of episodes (OR 1.015, p = 0.344; Table 3) (Berk et al., Reference Berk, Conus, Lucas, Hallam, Malhi, Dodd and McGorry2007), but was significantly associated for the model based on inter-episodic functioning (Kapczinski et al., Reference Kapczinski, Dias, Kauer-Sant'Anna, Frey, Grassi-Oliveira, Colom and Berk2009) (OR 1.033, p = 0.041; Table 3). After correcting for lithium use (online Supplementary Table S4, Fig. S1), an increase in brain-PAD was no longer significantly associated with a higher stage for either model (model based on recurrence p = 0.366 and functioning p = 0.167). The brain-PAD for Li+ was 1.4 years and for Li− 6.1 years, indicating that the brain age of patients who used lithium is 1.4 years older than their chronological age while in patients not on lithium this is 6.1 years. In other words, the effect of lithium use at the time of MRI on the brain-PAD was 4.7 years (p = 0.026) (see Table 2). Figure 1 shows the brain-PAD per stage for Li+ and Li− subjects separately. This figure shows a brain-PAD which increases across the stages for the Li+ subjects and a higher brain-PAD for the Li− subjects. Comparison of stage I, II, and III combined (n = 125) to stage IV (n = 7) for Li+: mean brain-PAD stage I–III combined was 0.92 years (s.d. 8.02) and for stage IV 7.48 years (s.d. 8.85). Independent sample t test showed that this is a significant difference between these groups, t(130) −2094, p = 0.019 with a moderate to high effect size, Cohen's d = 0.81.

Figure 1. Bar charts of the mean brain-PAD for subjects with BD with and without the current use of lithium.N
The association between an increase in brain-PAD and a higher stage still reached trend-level significance after correction for IQ (online Supplementary Table S5), after inclusion of subjects over 60 years of age (online Supplementary Table S6) and after correcting for substance use disorders (online Supplementary Table S9) for the model based on functioning (p = 0.056, p = 0.057, and p = 0.008, respectively) but remained non-significant for the model based on recurrence (p = 0.482, p = 0.252, and p = 0.384, respectively). Correction for comorbid anxiety disorders led to a slight reduction in effect size for the brain-PAD but did not remain significant (from OR 1.033, range 1.001–1.065, p = 0.041 to OR 1.025, range 0.993–1.058, p = 0.124).
Discussion
The present study aimed to explore whether global and (sub)cortical brain measures and brain-PAD can be considered as a marker for illness progression in subjects with BD when conceptualizing illness progression in two different staging models. No global or (sub)cortical brain regions were associated with odds of reaching a higher stage. We found evidence, albeit, with a small effect size (OR 1.033), that brain-PAD may function as a marker for illness progression, using a staging model based on impaired inter-episode functioning (Kapczinski et al., Reference Kapczinski, Dias, Kauer-Sant'Anna, Frey, Grassi-Oliveira, Colom and Berk2009) but not in a staging model based largely on the recurrence of mood episodes (Berk et al., Reference Berk, Conus, Lucas, Hallam, Malhi, Dodd and McGorry2007). These results are of an exploratory nature and are therefore meant to take a first step in investigating the influence of illness progression in relation to brain aging.
Previous studies have focused on identifying deviations in global and (sub)cortical brain measures (i.e. volumes, cortical thickness, and cortical surface areas) in subjects with BD compared with healthy controls (Abramovic et al., Reference Abramovic, Boks, Vreeker, Bouter, Kruiper, Verkooijen and van Haren2016; Hibar et al., Reference Hibar, Westlye, Van Erp, Rasmussen, Leonardo, Faskowitz and Andreassen2016, Reference Hibar, Westlye, Doan, Jahanshad, Cheung, Ching and Andreassen2018), but did not study the relation between illness progression and these brain deviations. Indeed, we previously reported a significantly smaller volume of the total brain and the globus pallidum, a thinner cortex in small clusters in frontal, parietal, and cingulate regions (Abramovic et al., Reference Abramovic, Boks, Vreeker, Verkooijen, van Bergen, Ophoff and van Haren2018), and increased ventricle volumes in subjects with BD as compared with controls in the same cohort (Abramovic et al., Reference Abramovic, Boks, Vreeker, Bouter, Kruiper, Verkooijen and van Haren2016, Reference Abramovic, Boks, Vreeker, Verkooijen, van Bergen, Ophoff and van Haren2018). As we have not identified any areas that significantly changed across the stages, we can now conclude that global or (sub)cortical brain measures are not associated with illness progression, regardless of whether illness progression was based on the recurrence of episodes (Berk et al., Reference Berk, Conus, Lucas, Hallam, Malhi, Dodd and McGorry2007) or on impaired inter-episodic functioning (Kapczinski et al., Reference Kapczinski, Dias, Kauer-Sant'Anna, Frey, Grassi-Oliveira, Colom and Berk2009). This may imply that BD-related deviations in individual brain regions occur prior to or right after the onset of BD and do not further alter as illness progresses. However, longitudinal studies are necessary to confirm this hypothesis.
Irrespective of staging, we found a larger brain-PAD of 3 years in subjects with BD compared to controls. In other words, the brains of subjects with BD are estimated to be on average 3 years older than the chronological age suggests. Although several earlier smaller studies did not find a significant brain-PAD difference in subjects with BD compared to controls (Nenadić et al., Reference Nenadić, Dietzek, Langbein, Sauer and Gaser2017; Shahab et al., Reference Shahab, Mulsant, Levesque, Calarco, Nazeri, Wheeler and Voineskos2019), larger studies found a brain-PAD difference ranging from 0.29 to 4.28 years (de Nooij et al., Reference de Nooij, Harris, Hawkins, Clarke, Shen, Chan and Whalley2020; Kaufmann et al., Reference Kaufmann, van der Meer, Doan, Schwarz, Lund, Agartz and Westlye2019; Tønnesen et al., Reference Tønnesen, Kaufmann, de Lange, Richard, Doan, Alnæs and Westlye2020; Van Gestel et al., Reference Van Gestel, Franke, Petite, Slaney, Garnham, Helmick and Hajek2019). This variability in brain-PAD could potentially be attributed to the differences between lithium and non-lithium users, as Van Gestel et al. (Reference Van Gestel, Franke, Petite, Slaney, Garnham, Helmick and Hajek2019) reported a brain-PAD of non-lithium users of 4.28 years and for lithium users of 0.48 year.
The brain-PAD significantly increased with illness progression in the model based on impaired inter-episodic functioning (Kapczinski et al., Reference Kapczinski, Dias, Kauer-Sant'Anna, Frey, Grassi-Oliveira, Colom and Berk2009), but not in the model based on the recurrence of mood episodes (Berk et al., Reference Berk, Conus, Lucas, Hallam, Malhi, Dodd and McGorry2007). This suggests that brain-PAD may be specifically related to the level of functioning in-between episodes. Our previous papers on these staging models already suggested that both models reflect different aspects of illness progression in BD since they had a low correlation (van der Markt et al., Reference van der Markt, Klumpers, Dols, Boks, Draisma, van Bergen and Kupka2020) and differences in associated clinical markers (van der Markt et al., Reference van der Markt, Klumpers, Dols, Boks, Vreeker, Beekman and Kupka2021). The markers that we found to be associated with illness progression as reflected by the staging models had found to be related to volume or thickness alterations in certain brain areas in other studies, e.g. familial risk (de Zwarte, Brouwer, Agartz, & van Haren, Reference de Zwarte, Brouwer, Agartz and van Haren2019), childhood abuse (Cassiers et al., Reference Cassiers, Sabbe, Schmaal, Veltman, Penninx and Van Den Eede2018), illness duration (Vita, De Peri, & Sacchetti, Reference Vita, De Peri and Sacchetti2009), psychiatric comorbidity (Biederman et al., Reference Biederman, Makris, Valera, Monuteaux, Goldstein, Buka and Seidman2008), and cognitive functioning expressed as IQ (Pietschnig, Penke, Wicherts, Zeiler, & Voracek, Reference Pietschnig, Penke, Wicherts, Zeiler and Voracek2015). It is important to note that we do not know the causality in the relation between brain-PAD and illness progression expressed as functioning. To identify whether an increase in brain-PAD causes a poorer level of functioning or whether poor functioning precedes a more pronounced brain-PAD, longitudinal studies are needed that cover the full adult age range.
A significant difference across the stages for the model based on functioning was found in brain-PAD, but not for individual global and regional (sub)cortical brain measures. This may be explained by brain age being a composite quantity, derived from many individual brain regions related to brain aging, thus reducing the influence of individual variations in brain morphology and noise. Individual brain areas for this model showed an effect in the same direction, including a larger volume of the lateral ventricles, and a smaller volume of the putamen, hippocampus, and amygdala, however did not reach significance after correction for multiple testing.
We investigated whether our findings could be explained by a difference in baseline characteristics between the stages. Not surprisingly, a higher stage in the staging model based on episode recurrence was associated with increased age. However, since age was introduced as a covariate for the global and (sub)cortical measures and age and age-squared were included as covariates in our brain age analyses, we expect that these associations did not confound our results. After including individuals with BD aged over 60 years, the difference in brain-PAD across the stages for the model based on functioning went to trend-level significance (online Supplementary Table S6), confirming the model's lower accuracy in higher age groups, as was already suggested by Han et al. (Reference Han, Dinga, Hahn, Ching, Eyler, Aftanas and Schmaal2020).
Correcting for IQ did not change our results for the global and subcortical brain measures (online Supplementary Table S5). It did marginally change the results of the brain-PAD for the model based on inter-episodic functioning from significant (p = 0.041) to (just) not significant (p = 0.056). Stages in this model use criteria such as the ability to work and function independently, which are closely related to IQ, as subjects with a higher IQ are described to have more cognitive reserve (Martino, Valerio, Szmulewicz, & Strejilevich, Reference Martino, Valerio, Szmulewicz and Strejilevich2017) and thus have more possibilities to continue working less demanding jobs and have more cognitive capacity to remain functioning autonomously. This is in line with the findings by Reinares et al. (Reference Reinares, Papachristou, Harvey, Mar Bonnín, Sánchez-Moreno, Torrent and Frangou2013), who found a relation between verbal IQ and better functioning, defined as the ability to work and function socially in subjects with BD.
We found that correcting for current lithium use did not change our results for the global and subcortical brain measures. However, correcting for lithium did change the results of the brain-PAD for the model based on impaired functioning from significant (OR 1.033, range 1.001–1.065, p = 0.041) to non-significant (OR 1.023, range 0.991–1.056, p = 0.167). The share of lithium users decreased across the stages of the functioning-based model, although not significantly (χ2[3,199] 7.40, p = 0.060). This indicates that lithium use unlikely explains the effect of staging on brain-PAD. The change in significance when correcting for lithium is mostly caused by the influence of lithium on the brain-PAD itself. When assessing the lithium users and non-lithium-users separately, the average brain-PADs of these groups differ 4.7 years (1.4 years larger than controls for Li+ and 6.1 years larger than controls for Li−). A possible explanation would be the effect of lithium on the brain itself, which is in line with the study by Van Gestel et al. (Reference Van Gestel, Franke, Petite, Slaney, Garnham, Helmick and Hajek2019) who found a normalizing effect on the brain age in lithium users compared to non-lithium users. It is also consistent with the effect of lithium on brain volumes, where lithium users do not (or to a lesser extent) show the smaller gray matter volumes that are found in non-lithium users as compared to controls, as shown by Abramovic et al. (Reference Abramovic, Boks, Vreeker, Bouter, Kruiper, Verkooijen and van Haren2016) in the current sample and by many others (for review, see Hafeman et al., Reference Hafeman, Chang, Garrett, Sanders and Phillips2012). It has been suggested that gray matter volume reduction in BD is caused by actual brain deterioration through different pathways, such as modulation of nerve growth factors, inflammation, mitochondrial function, oxidative stress, and programmed cell death mechanisms, such as autophagy and apoptosis, and lithium possibly serve as a neuroprotective agent by influencing these pathways (Ochoa, Reference Ochoa2022). Figure 1 shows the brain-PAD per stage in lithium users and non-lithium users for the model based on inter-episodic functioning. For lithium users, the protective effect of lithium is present in stages I, II, and III but decreases significantly in stage IV. This might mean that the protective effect of lithium is no longer present when functioning is severely affected. Due to the small sample size, further studies are needed to confirm this hypothesis. Alternatively, patients not on lithium could be more treatment resistant, as lithium is the first choice in the Dutch clinical guidelines, and thus experience more severe mood episodes leading to more rapid aging. In conclusion, the use of lithium may be a protective factor as it possibly prevents brain volume loss in subjects with BD and it may explain the less divergent brain-PAD compared to controls after correcting for lithium.
We did not assess the effect of other psychotropic drugs. A study by Abramovic et al. (Reference Abramovic, Boks, Vreeker, Bouter, Kruiper, Verkooijen and van Haren2016) in the current cohort found that the use of antipsychotics in BD was subtly associated with a larger third ventricle and smaller hippocampus and supramarginal cortex volume, albeit with smaller effect sizes than the more extensive effects of lithium on the brain. Indeed, the review by Hafeman et al. (Reference Hafeman, Chang, Garrett, Sanders and Phillips2012) found that the use of antipsychotics was generally not associated with volumetric differences. However, the ENIGMA study found a reduced cortical surface area for atypical antipsychotics and an increased cortical surface area related to typical antipsychotics, suggesting that different types of medication are differently associated with brain measures (Hibar et al., Reference Hibar, Westlye, Doan, Jahanshad, Cheung, Ching and Andreassen2018), although the authors acknowledge that the effect may be related to the small number of subjects using typical antipsychotics in their study. Due to these varying findings, it may be interesting for future studies to assess the influence of neuroleptic drugs on the brain from the perspective of illness progression.
In the main analyses, we intentionally did not exclude individuals with co-occurring anxiety and substance use disorders to maintain the naturalistic nature of our outpatient sample. While excluding such subjects would improve sample homogeneity, it would compromise the representativeness of our outcomes for real-world outpatients. In order to ensure comprehensive analysis, we corrected our models for the presence or absence of anxiety and substance abuse to explore their potential impact on the observed associations between brain-PAD and staging models. The effect sizes only showed minimal changes as compared to the analyses in the full sample, but some significance levels changed, e.g. after correcting for the presence of anxiety disorders the association between the staging model based on functioning and the brain-PAD did not retain significance. Whether the presence of anxiety disorders had a significant influence on this association needs further study in a larger sample. It needs emphasis that comorbid anxiety disorders are common in a naturalistic sample and that this might just be an indicator of the severity of BD.
Also, correction for substance use disorders did alter the pattern of findings for the brain regions. Now, although odds ratios were again mostly similar, the association between stages in the model based on functioning and lateral ventricles, mean cortical thickness, putamen, pallidum, hippocampus, amygdala, and nucleus accumbens reached significance after correcting for multiple testing, i.e. thickness and volumes decreased with an increase in stages. Notably, almost all subjects with substance use disorders clustered in stages II and III. As substance use disorders are relatively common comorbid to BD, it is difficult to explain why findings now reached the significance threshold. Again, further studies with larger cohorts are needed to determine the consequences of these findings.
To our knowledge, this is the first study to address the potential underlying neurobiology of staging models. Analyses were done in a relatively large sample. However, some limitations must be considered. We found a large variation in the predicted brain age within the stages of both staging models. This means an even larger sample may be needed to better estimate the mean brain age and its standard deviation per stage, since differences in the brain measures across stages may be too small to detect in a sample of our size. The model based on the recurrence of episodes (Berk et al., Reference Berk, Conus, Lucas, Hallam, Malhi, Dodd and McGorry2007) consists of nine categories of which the six highest categories of the model were assigned to the subjects with BD, as the cohort did not include individuals in the prodromal and very early stages of BD. In contrast, the model based on inter-episodic functioning (Kapczinski et al., Reference Kapczinski, Dias, Kauer-Sant'Anna, Frey, Grassi-Oliveira, Colom and Berk2009) consists of four categories. The implication of a difference in the number of stages per model may be that it becomes more likely to find significant differences in variables across the stages for the model based on functioning as sample sizes per stage are larger. On the other hand, a larger number of stages could lead to a more refined grouping, which decreased within-stage variation, thus leading to more statistically significant results when testing the differences in variables across the stages. The reported number of previous mood episodes may be subject to recall bias, which may have led to some inaccuracy in the demographics table. Also, our outpatient sample may be less suitable for testing the staging model based on the number of episodes, as an outpatient sample does not typically contain patients in the very early stages of bipolar illness as they are not enrolled in treatment settings yet. Therefore, our cohort contained a large number of subjects clustering in similar stages. Lastly, our results are meant to be exploratory in nature. Our results need to be interpreted with caution as correction for multiple testing was only performed for each model separately and not for the two models combined.
In conclusion, our study provides suggestive evidence that brain-PAD may be associated with illness progression in the model based on impaired inter-episodic functioning (Kapczinski et al., Reference Kapczinski, Dias, Kauer-Sant'Anna, Frey, Grassi-Oliveira, Colom and Berk2009). We found a significant association between illness progression reflected by this staging model and the brain-PAD, however, the role of lithium appears relevant as correcting for lithium led to this association no longer being significant. This relationship between brain-PAD and stage of inter-episodic functioning should therefore be studied in larger and longitudinal cohorts. This study emphasized the importance of accounting for lithium-use in imaging studies in BD, as lithium was associated with less brain aging. Additionally, it emphasized the role of comorbid anxiety disorders as the association between brain aging and the staging model no longer reached significance after correction for subjects with anxiety disorders. New studies with larger samples are needed to further disentangle the complex relationship between brain-PAD, stage, and lithium intake or anxiety disorders.
Supplementary material
The supplementary material for this article can be found at https://doi.org/10.1017/S0033291723002829
Acknowledgments
This project was partly funded by the Dutch Research Agenda (NWA – Nationale Wetenschapsagenda), part of the Dutch Research Council (NWO; Nederlandse Organisatie voor Wetenschappelijk Onderzoek), file number 1228.192.002, received by A. v. d. M., N. K., and H. S. and the National Institute of Mental Health grants R01 MH090553 to R. A. O. Funders had no role in study design, data collection, and analysis, decision to publish, or preparation of the manuscript.
Competing interests
None.


 Open access