This report analyzes “job satisfaction” among political scientists employed in US institutions of higher education. This study is important because dissatisfaction with any aspect of one's job can lead to depressed productivity and poorer quality of work (Tack and Patitu Reference Tack and Patitu1992). The general assumption is that higher satisfaction is associated greater productivity (Bender and Heywood Reference Bender and Heywood2006). Given the time that faculty members spend working, poor job satisfaction may result in a lower overall quality of life (Gruneberg Reference Gruneberg1979). Job satisfaction is also a key predictor of intention to remain in or leave an academic position (Hagedorn Reference Hagedorn1996; Rosser Reference Rosser2004; Smart Reference Smart1990). Thus, understanding the factors that contribute to job satisfaction could improve retention among all faculty and among women and minorities who remain underrepresented in political science departments (Hesli, Lee, and Mitchell Reference Hesli, Lee and Mitchell2012; US Department of Education [a]).
The evidence that we present is based on a sample of all faculty members in departments of political science (and departments of government, public affairs, and international relations) in the United States (see appendix A for a description of the survey methodology). We find significantly different levels of job satisfaction depending on demographic characteristics as well as the characteristics of the institution within which the faculty member works. We do not find differences in levels of satisfaction between men and women, but we do find lower levels of satisfaction among minority faculty. We also find that levels of professional satisfaction are lower when teaching loads are higher, while satisfaction is greater among those who publish and attend conferences more frequently. Job satisfaction tends to be higher among those employed in more highly ranked departments and in private institutions. Satisfaction improves with symbolic recognition such as award nominations.
LITERATURE REVIEW
Job satisfaction refers “to an overall affective orientation on the part of individuals toward work roles which they are presently occupying” (Kalleberg Reference Kalleberg1977, 126). Previous studies have identified numerous factors that correlate with variations in levels of job satisfaction. One factor is gender: several studies, some of which are dated, report that male faculty members have higher levels of job satisfaction than female faculty (Bender and Heywood Reference Bender, Heywood, Freeman and Goroff2009; Reference Bender and Heywood2006; Bilimoria et al. Reference Bilimoria, Perry, Liang, Stoller, Higgins and Taylor2006; Callister Reference Callister2006; Hult, Callister, and Sullivan Reference Hult, Callister and Sullivan2005; Olsen, Maple, and Stage Reference Olsen, Maple and Stage1995; Settles et al. Reference Settles, Cortina, Malley and Stewart2006; Tack and Patitu Reference Tack and Patitu1992). Other researchers report equal levels of satisfaction for men and women, and in one report, higher satisfaction is found among female faculty (Okpara, Squillace, and Erondu Reference Okpara, Squillace and Erondu2005; Oshagbemi Reference Oshagbemi1997; Sabharwal and Corley Reference Sabharwal and Corley2009, 549; Ward and Sloane Reference Ward and Sloane2000). In a cross-national study, Sousa-Poza and Sousa-Poza (Reference Sousa-Poza and Sousa-Poza2000) report that in eight of 21 countries women report higher job-satisfaction levels than men; in most countries, however, men have higher job-satisfaction levels than women, although the difference is marginal. Thus, although gender is one of the most frequently researched demographics, the evidence remains mixed with regard to the effects of gender on job satisfaction (Hagedorn Reference Hagedorn2000). No study has yet focused specifically on job satisfaction among academic political scientists, so this study fills that void and answers the question of whether female faculty have different levels of satisfaction than their male colleagues.
With regard to other demographic characteristics, marriage generally improves job satisfaction (Bender and Heywood Reference Bender, Heywood, Freeman and Goroff2009, Reference Bender and Heywood2006; Cetin Reference Cetin2006; Hagedorn Reference Hagedorn2000; Leung, Siu, and Spector Reference Leung, Siu and Spector2000; Sabharwal and Corley Reference Sabharwal and Corley2009, 552). This finding could work against female faculty as they are less likely to be married than male faculty. (US Department of Education [b]). Exceptions to the finding that marriage improves job satisfaction include Aisenberg and Harrington (Reference Aisenberg and Harrington1988) and Bryson, Bryson, and Johnson (Reference Bryson, Bryson and Johnson1978). Although Carr and Ash (Reference Carr and Ash1998, 536) report that women with children are less satisfied with their careers than men with children, more children is correlated with higher satisfaction (Sabharwal and Corley Reference Sabharwal and Corley2009, 552).
Minority faculty members are typically less satisfied than nonminority faculty (Antonio, Cress, and Astin Reference Antonio, Cress and Astin1997; Bender and Heywood Reference Bender, Heywood, Freeman and Goroff2009; Peterson et al. Reference Peterson, Friedman, Ash, Franco and Carr2004; Rosser Reference Rosser2005). The effect of minority status on job satisfaction depends to some degree on academic rank and on “solo” status within a department (Niemann and Dovidio Reference Niemann and Dovidio1998). In general, the literature suggests that minority workers are likely to experience race–related stressors (Holder and Vaux Reference Holder and Vaux1998) and, thus, are more likely to report lower levels of career satisfaction (August and Waltman Reference August and Waltman2004; Olsen, Maple, and Stage Reference Olsen, Maple and Stage1995). Sabharwal and Corley (Reference Sabharwal and Corley2009, 551), however, report that African American faculty members are equally, or more, satisfied than their Caucasian counterparts. Ponjuan (Reference Ponjuan2005) found Latino faculty were less satisfied than Caucasian faculty with their overall job duties, but that African American faculty did not statistically differ in their job satisfaction from their Caucasian colleagues (quoted from Seifert and Umbach Reference Seifert and Umbach2008, 360). Also contrary to most of the literature, Ethington, Smart, and Zeltman (Reference Ethington, Smart and Zeltman1989) find that minority status is positively related to satisfaction with teaching and institutional recognition and support.
In addition to demographic characteristics, several characteristics of the job affect satisfaction. For example, faculty who work at Carnegie Research I or II universities have higher levels of satisfaction than those who work at other types of universities (Sabharwal and Corley Reference Sabharwal and Corley2009, 551; see also Ethington, Smart, and Zeltman Reference Ethington, Smart and Zeltman1989). Faculty members who spend a greater percentage of their time teaching in comparison to research are more likely to express greater dissatisfaction with their work (Bender and Heywood Reference Bender, Heywood, Freeman and Goroff2009; Liu Reference Liu2001; Olsen, Maple, and Stage Reference Olsen, Maple and Stage1995; Sabharwal and Corley Reference Sabharwal and Corley2009, 551). Tenure is usually found to be a powerful predictor of faculty satisfaction (Bender and Heywood Reference Bender and Heywood2006; Tack and Patitu Reference Tack and Patitu1992). Full professors are reportedly more satisfied than associate or assistant professors (Ethington, Smart, and Zeltman Reference Ethington, Smart and Zeltman1989; Oshagbemi Reference Oshagbemi1997; Sabharwal and Corley Reference Sabharwal and Corley2009, 552). Productivity, in terms of research and publication, is regularly found to be a predictor of faculty job satisfaction (August and Waltman Reference August and Waltman2004; Blackburn and Lawrence Reference Blackburn and Lawrence1995; Hagedorn Reference Hagedorn2000; Lahey and Vihtelic Reference Lahey and Vihtelic2000; Olsen, Maple, and Stage Reference Olsen, Maple and Stage1995; Sabharwal and Corley Reference Sabharwal and Corley2009, 551).
Unsurprisingly, positive social and working relationships are conducive to job satisfaction (Carnevale and Rios Reference Carnevale and Rios1995). Relationships with colleagues, administrators, and students plus perceptions of culture and climate significantly affect job satisfaction (Austin and Davis Reference Austin, Davis and Fox1985; Ethington, Smart, and Zeltman Reference Ethington, Smart and Zeltman1989; Hagedorn Reference Hagedorn1996, Reference Hagedorn2000). Looking only at female faculty, August and Waltman (Reference August and Waltman2004, 186–7) found that among the best predictors of overall satisfaction were measures of the departmental climate and the quality of relations with students. Job satisfaction tends to be higher among those who feel valued and have received rewards and recognition from their peers and institutions. Receiving an adequate and equitable allocation of resources, such as research support and graduate student assistance, is also important to satisfaction levels (Johnsrud and Des Jarlais 1994).
One study, which focused specifically on political scientists, reported that gender and the year of doctoral degree were significant predictors of reports of a chilly climate (Hesli and Burrell Reference Hesli and Burrell1995).Footnote 1 Women reported inequality in the workplace significantly more frequently than did men. Faculty members who obtained their degrees recently (younger faculty) were significantly more likely to perceive a chilly climate than (older) faculty members who obtained their degree earlier. Now, a decade and a half later, we return to the question of a chilly climate in political science departments, but we embed the question into a broader discussion of the concept of job satisfaction. Given the previous findings, we created a survey instrument that allows us to evaluate both job satisfaction and the chilly climate in academia using a comprehensive set of measures.
THEORETICAL FRAMEWORK AND HYPOTHESES
In setting up the analyses, we needed a theoretical framework to guide our selection of independent variables. Several frameworks are available in the literature for identifying the factors that are expected to influence variations in job-satisfaction levels (Bilimoria et al. Reference Bilimoria, Perry, Liang, Stoller, Higgins and Taylor2006; Ethington, Smart, and Zeltman Reference Ethington, Smart and Zeltman1989; Kalleberg Reference Kalleberg1977; Sabharwal and Corley Reference Sabharwal and Corley2009). We employ the rich conceptual framework offered by Hagedorn (Reference Hagedorn2000, 6–7), who identifies three types of mediators that provide the context in which job satisfaction can be considered. These are demographics, motivators and hygienes, and environmental conditions. First, demographics include standard items like gender, family factors, and minority status, but the category also includes institutional characteristics (such as private or public institution, or PhD-granting or four-year college). The argument is that institutional type creates in-groups of workers who share certain similar characteristics just as do gender and ethnicity (Hagedorn Reference Hagedorn2000, 9). Second, motivators increase satisfaction, while hygienes decrease satisfaction (according to Herzberg, Mausner, and Snyderman Reference Herzberg, Mausner and Snyderman1959). For academics, motivators include achievement (number of publications), recognition (awards), the nature of the work itself (teaching and research), responsibility (committee service), and advancement (academic rank) (Hagedorn Reference Hagedorn2000, table 1.1, 13). Hygienes may include heavy teaching or advising responsibilities. The third category, environmental conditions, encompasses working conditions, including social and working relationships.
We structure our presentation and analyses using the categories of mediators defined by Hagedorn (Reference Hagedorn2000). Her categories applied to our indicators yield three groups of independent variables—to be used to predict variation in levels of job satisfaction (each variable is described in appendix B):
Demographic and Institutional Variables
1. Gender
2. Married
3. Number of children
4. Minority
5. Year of degree
6. Joint appointment
7. Current department ranking (based on Schmidt and Chingos Reference Schmidt and Chingos2007)
8. Employed in a private (rather than a public) institution
9. Employed in PhD program or an MA program (excluded category is four-year or two-year college)
10. Geographic location—the Northeast, Midwest, or South (excluded category is the West)
Motivators and HygienesFootnote 2
11. Tenured
12. Resources available (research assistant, travel funds, etc.)
13. Award nominations
14. Professional recognition (editorial board member or professional association committee service)
15. Total of articles and books published
16. Frequency of attending political science conferences
17. Number of undergraduate courses taught
18. New course preparation
19. Release from teaching
20. Mentoring activity
21. Undergraduate advising activity
22. Number of committees
Environmental Conditions
23. Collegial climateFootnote 3
24. ToleranceFootnote 4
25. Discrimination experienceFootnote 5
The two dependent variable measures that provide the foundation for our analyses are job satisfaction and professional satisfaction (the components of these scales are listed in appendix B):
26. Job satisfaction: A three-item scale anchored with the query of “How satisfied are you with your current position?”Footnote 6 and also includes questions about being valued by other members of the department and being satisfied with day-to-day contacts with faculty colleagues.
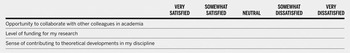
27. Professional satisfaction: A three-item scale based on satisfaction with collaborative opportunities in academia, funding for research, and opportunities to make contributions to theory.
Note that we have two measures of satisfaction. We started with the assumption that we only needed one multiple-item measure, but our testing of the measure revealed that responses to survey questions grouped into two different dimensions; thus we created two distinct scales as indicators of the two different dimensions. Our initial focus will be on explaining job satisfaction and professional satisfaction (as our two primary dependent variables). Later in the text we explore why some faculty members rate their departments as more collegial than others and why some have experienced more discrimination than others.
Based on the literature review and the theoretical framework, our guiding hypotheses are as follows:
H1: After controlling for demographic, institutional, and career-related variables, female faculty members experience lower levels of satisfaction than male faculty members.
H2: Also with controls, minority faculty members experience lower levels of satisfaction than nonminority faculty members.
H3: Those who are employed in more highly ranked departments are more satisfied than those who are employed in less highly ranked departments.
H4: Those who teach less are more satisfied than those who teach more.
H5: Faculty members in higher academic ranks are more satisfied than those in lower ranks.
H6: Faculty members who publish more are more satisfied than those who publish less.
H7: Those who rate their departments as collegial and tolerant, and who have not experienced discrimination, are more satisfied than their respective counterparts.
DATA AND FINDINGS
Table 1 shows difference in means tests for our two satisfaction measures, plus the measures of the environmental conditions.Footnote 7 We see no significant differences between men and women in their levels of satisfaction at any rank. (Our expectation associated with Hypothesis 1 is not confirmed.) We do, however, see significant differences between men and women at each rank in ratings of tolerance within the department and in reports of individual experiences with discrimination. At each rank (assistant, associate, and full professor), women rate their departments as less tolerant (more racist, sexist, and homophobic) than do men; and, at each of the different academic ranks, women report more personal experiences with discrimination than do men.
Table 1 Difference of Means Tests—Men and Women Compared

* This table and the following tables are based on tenure-track respondents only. Cell entries are mean scores for men and women at different ranks and p values (significance levels) of t-tests.
In table 2, we see that among women only, no differences in satisfaction exist when the average satisfaction score within one academic rank is compared with the average satisfaction score for a different academic rank. However, among men, full professors are on average significantly more satisfied than associate professors. Among women, we see only one difference across the ranks on our measures of the academic environment. An interesting difference is seen on the collegial climate scale between female assistant professors and female associate professors. The female assistant professors on average rate their department as being significantly more collegial than do female associate professors.
Table 2 Difference of Means Tests—Academic Ranks Compared

Cell entries are mean scores for different ranks among women and among men. In the columns for “Sig.,” the top value represents the p value of the comparison of the means of assistant and associate professors, and the bottom p value is for the comparison of the means of the associate and full professors.
We do not discuss the contrasts in tables 1 and 2, because none of these comparisons includes controls for other relevant factors. Thus, we turn to the multivariate analyses based on OLS regression. We run two different sets of regressions, a set for each dependent variable: job satisfaction and professional satisfaction.
Table 3 provides estimated OLS coefficients, standard errors, and indicators of significance for each demographic and institutional predictor of satisfaction. We test these models separately for men and women as we expected that the causes of satisfaction would differ for the two demographic groups. We find that not only are predictors of satisfaction different for men as compared with women, but that predictors of job satisfaction are different from predictors of professional satisfaction. This difference makes our overview more cumbersome. Therefore, we organize our discussion around the independent variables rather than the dependent variables. We first note that given the other controls in the model, married or partnered faculty are no different from their comparative counterparts on either measure of satisfaction, nor are those with joint appointments any different from those who do not have joint appointments. We do find that men with children have greater job satisfaction than men without children;Footnote 8 and that minority female faculty members are less satisfied with their job than are nonminority female faculty. When a woman received her PhD affects her level of professional satisfaction, as does region of residence, with female academics living in the Northeast and the South having less professional satisfaction than those living in the West (the excluded category). Working in a highly ranked department is associated with higher levels of professional satisfaction for both men and women. Job satisfaction is also higher among women working in the more highly ranked departments. Higher levels of both job satisfaction and professional satisfaction are reported by male faculty members working in private institutions. Men working in PhD-granting departments also report higher levels of professional satisfaction than men working in bachelor degree-granting departments (the excluded category).
Table 3 Demographic and Institutional Predictors of Satisfaction (OLS Regression)

Sig:
** p < 0.01,
* p < 0.05
To examine the effects of motivators and hygienes on satisfaction, as identified in Hagedorn's (Reference Hagedorn2000) conceptual framework, we split the sample not only between men and women but also between those who are tenured and nontenured, and, among the tenured group, we include a dummy variable for whether the respondent is an associate or a full professor. We conduct separate regressions for tenured and nontenured men and tenured and nontenured women as the likelihood of gaining tenure is different for men and women (Hesli, Lee, and Mitchell Reference Hesli, Lee and Mitchell2012), and several satisfaction-related issues affect tenured and nontenured faculty differently (Sorcinelli and Austin Reference Sorcinelli and Austin1992).
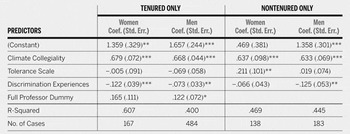
Table 4A is concerned solely with job satisfaction. Recall that our job-satisfaction scale taps into questions about day-to-day interactions with departmental colleagues. The predictor variables from this set that are unrelated to job satisfaction are professional recognition, publication productivity, undergraduate teaching load, new course preparation, teaching release, and committee service. In terms of significant relationships, more resources are associated with more job satisfaction among tenured men. More award nominations are related to greater job satisfaction among both male and female tenured faculty. More frequent conference attendance is related to depressed levels of job satisfaction among untenured women. More time spent on mentoring activities is related to lower job satisfaction among tenured women, although more time spent on mentoring activities is related to higher job satisfaction among untenured men. In contrast, a larger number of undergraduate advisees corresponds to lower job satisfaction among the same group (untenured men).
Table 4A Motivators and Hygienes as Predictors of Job Satisfaction

Sig:
*** p < .01,
** p < 0.05,
* p < 0.10
Table 4B is concerned solely with professional satisfaction. The professional satisfaction scale includes questions about satisfaction with collaborative opportunities, funding for research, and contributions to theory. With the sample split into subgroups, professional recognition is unrelated to professional satisfaction. Teaching release is also unrelated to professional satisfaction. More resources are associated with higher levels of professional satisfaction among tenured men and untenured women. The professional satisfaction of tenured men increases with more award nominations. In general, the more one publishes, the more professionally satisfied one is. This relationship holds among male and female tenured faculty and among nontenured men. More frequent conference attendance is linked to higher levels of professional satisfaction among both male and female tenured faculty and among nontenured men. Teaching more undergraduate courses is linked to depressed professional satisfaction among tenured men. Having to prepare new courses is associated with lower professional satisfaction among tenured women. Informal mentoring affects professional satisfaction among untenured faculty, with more mentoring negatively associated with female satisfaction and positively associated with male satisfaction. Having many undergraduate advisees is associated with lower levels of professional satisfaction among both tenured and untenured men. For untenured women, more committee service is associated with lower levels of professional satisfaction.
Table 4B Motivators and Hygienes as Predictors of Professional Satisfaction

Sig:
*** p < .01,
** p < 0.05,
* p < 0.10
We now review the final set of predictors of satisfaction: environmental conditions. According to the results of the model testing as presented in table 5A, a more positive collegial climate is powerfully associated with greater job satisfaction among all subgroups. Greater tolerance in the workplace is associated with greater job satisfaction among untenured women. Experiences with discrimination negatively affect job satisfaction among male and female tenured faculty and among untenured men. Note that with these controls, job satisfaction is higher among male full professors than among male associate professors.
Table 5A Environmental Conditions as Predictors of Job Satisfaction
Sig:
*** p < .01,
** p < 0.05,
* p < 0.10
With regard to professional satisfaction, table 5B reveals that ratings of one's department as collegial are associated with professional satisfaction among tenured men and women and among untenured men. The tolerance measure is not a significant predictor of professional satisfaction. Experiences with discrimination are negatively related to professional satisfaction among tenured women. Full professors, whether male or female, are more professionally satisfied than associate professors.
Table 5B Environmental Conditions as Predictors of Professional Satisfaction

Sig:
** p < 0.05,
* p < 0.10
Some of the variables included in our models have a high proportion of missing responses, such as the year of receipt of the PhD and the number of hours per week spent on mentoring. Thus, the number of cases included in our analysis drops when these variables are included as predictors. For this reason, we also tested the same models using imputed data and holding the number of cases in the analysis constant at 1,063 for the professional satisfaction scale and at 1,069 for the job satisfaction scale. Using imputed estimates of missing responses increases the number of observations considered in the analysis. We use the Amelia II program designed for multiple imputation to impute estimates of the missing responses on each of the independent variables in the analysis (Honaker, King, and Blackwell Reference Honaker, King and Blackwell2011).Footnote 9 The results using multiple imputation are available from the authors. We note that the analyses using the multiple imputation confirm the results as presented herein and provide additional evidence for the robustness of our findings. The lion's share of the coefficients that are significant in the tables here are also significant in the analyses based on files created by the Amelia program.Footnote 10
In table 6A we combine men and women, tenured and nontenured, and report a parsimonious model for job satisfaction. We remove from the model factors that had been hypothesized to influence job satisfaction, but for which we could not reject the null hypothesis of no relationship within the full sample. Some of the insignificant variables had several missing responses to the questions that they represent, and, thus, by removing them, we have increased the number of cases on which our results are based. Table 6A represents the result of this exercise when testing the predictive power of the demographic and institutional variables, plus the motivators and hygienes together. In this model, we have not included the scales measuring environmental conditions, as we see these as being conceptually close to our measures of satisfaction and we are faced with an endogeniety issue when the environmental conditions are included in the same model with the other predictors. (Note that in table 5A, 61% of variance in job satisfaction among tenured women can be explained by reference to the three environmental scales.)
Table 6A Simplified Summary Model for Job Satisfaction

Sig:
*** p < 0.01,
** p < 0.05,
* p < 0.10
Table 6A reveals that across our full sample of political scientists employed in academia, those who have significantly less job satisfaction compared to their comparative counterparts are members of a minority racial group and those who have served on editorial boards and committees of professional associations (the professional recognition variable). In contrast, job satisfaction improves with children, employment in a more highly ranked department, employment in a private institution, having more resources, and being nominated for teaching, research, or service awards.
With regard to professional satisfaction, from the results reported in table 6B, we conclude that minorities are less professionally satisfied as are those who teach many undergraduate courses. In addition, those residing in the Northeast, Midwest, or South are less satisfied than those working in the West. Other factors that are significantly associated across the full sample of political science faculty with higher professional satisfaction are employment in a higher ranked department, employment in a private institution, more resources, more award nominations, more publications, and more frequent participation in political science conferences.
Table 6B Simplified Summary Model for Professional Satisfaction

Sig:
*** p < 0.01,
** p < 0.05,
* p < 0.10
To take this analysis further, we use two of the climate variables that are significantly related to satisfaction as dependent variables in OLS regressions to explain why some of our colleagues experience their department environment differently from others.Footnote 11 For this analysis, we report parsimonious models that contain only variables that have significant estimated coefficients in the OLS regressions. We checked multiple variants of these models, and all estimated coefficients remain stable across the models based on the demographic, institutional, and motivator and hygiene variables (i.e., the magnitudes and the significance levels of coefficients do not change depending on which variables are included in the analysis), so we report only significant coefficients in tables 7 and 8.
Table 7 Simplified Model for Collegial Climate Scale

Sig:
*** p < 0.01,
** p < 0.05,
* p < 0.10
Table 8 Simplified Model for Experiences with Discrimination

Sig:
*** p < 0.01,
** p < 0.05,
* p < 0.10
We present one more hypothesis to guide this component of our research:
H8: Both women and minorities will report less collegiality and more discrimination than their comparative counterparts.
The expectation that we will see differences between men and women and between minorities and nonminorities is based on extensive literature, some of which was mentioned earlier, and also includes the review conducted by Seifert and Umbach (Reference Seifert and Umbach2008, 361–62):
In a study of research university faculty, Bronstein and Farnsworth (Reference Bronstein and Farnsworth1998) found women more often than men reported experiences of gender discrimination characterized by exclusion by colleagues, inappropriate sexual attention, demeaning or intimidating behaviors, and unfair treatment in personnel matters… Women faculty and faculty of color also reported feeling that their colleagues view their research as tangential, self-serving, and that it was not “pure” science
(Aguirre, Reference Aguirre2000; Bronstein, Reference Bronstein1993; California News Reel, 1996; Garza, Reference Garza1993; Ladson-Billings, Reference Ladson-Billings, Neumann and Peterson1997).In addition, in a review provided by Olsen, Maple, and Stage (Reference Olsen, Maple and Stage1995, 270–71):
In their research, Clark and Corcoran [12, p. 25] describe a “Salieri effect,” whereby women are assessed by a dominant inner circle of men and fail to “measure up” because of their social status. In the end, the Salieri effect is perhaps more insidious than overt discrimination, because it allows women to enter academe while severely limiting opportunities for advancement. Similarly, investigators describe a kind of “symbolic racism” toward minorities, which denounces overt forms of prejudice while denying access to resources, information, and sources of support (many of which are informal) essential to success [52, see also 18].
Unfortunately our findings corroborate this earlier work. In table 7, we see that minority faculty members tend to rate their departments as less collegial than nonminority faculty. Faculty who are married or partnered tend to rate their departments as more collegial than faculty who are single. Faculty members who work in private institutions rate their departments as more collegial than those who work in public institutions. The more professional recognition one has received (serving on an editorial board or on a committee in a professional association), the less likely one is to see his or her department as collegial.
In table 8, we see that both minorities and women report significantly more experiences with discrimination than their comparative counterparts. The coefficients associated with being a member of a minority group and with being a woman are both significant when the discrimination experience variable is the dependent variable. Also a larger number of undergraduate courses taught is associated with increasing reports of discrimination. More involvement in the political science profession (more conference attendance and more professional recognition [service on editorial boards and professional committees]) is associated with increasing reports of discrimination. More award nominations are associated with greater discrimination experience.Footnote 12
DISCUSSION
We organize our discussion around the hypotheses presented earlier. Hypothesis 1 is rejected as we do not find systematic differences between men and women in either job or professional satisfaction. We do, however, have striking support for Hypothesis 2: racial minorities do, on average, report less job satisfaction and less professional satisfaction than nonminorities. We note that for job satisfaction, this finding is driven by a relationship that is significant among women. With regard to professional satisfaction, we do not find significant differences between minorities and nonminorities when the sample is split between men and women.Footnote 13
To interpret this information, we start with the correlates of satisfaction that are most proximate to it: the environmental conditions of the job. One environmental factor that is consistently related to job satisfaction is discrimination experience.Footnote 14 Note that discrimination undermines job satisfaction and is more frequently reported by women than men and is also more common among minority faculty than nonminorities.
Our research reveals that, although many refuse to acknowledge and discuss it, discrimination still exists within our profession. Self-reports of actual experiences with discrimination from many respondents cannot and should not be ignored. How can we explain that minorities find their working environment less collegial than nonminorities and that they report more experiences with discrimination than nonminorities? Why do women report more experiences with discrimination than men? One explanation is the sense of isolation that may come if the faculty member is the only woman or the only minority in the department (Aguirre Reference Aguirre2000; Tack and Patitu Reference Tack and Patitu1992). Isolation is compounded if other members of the department believe that their female or minority colleague came into the department as a result of an affirmative action hire (Turner and Myers Reference Turner and Myers2000). An underlying belief that the female or the minority colleague did not earn the position, but rather was given the position through an affirmative action program can poison departmental relations. This belief that women or minorities are less qualified must be expunged from the political science profession. It is insidious and cruel. This subtle stereo-typing of one or another of our colleagues as being of lesser quality than another not only undermines the ability of the targeted colleague to enjoy his or her work, it undermines the entire academic endeavor as their work and ideas are shunned as being less legitimate and less worthy. In turn, this undermines academic freedom and intellectual creativity.
For every subgroup of the population tested (men and women, tenured and nontenured), a more collegial working environment is strongly associated with higher levels of both job satisfaction and professional satisfaction. Thus, improving the collegiality of the workplace should be a high priority for both individual faculty members and departmental leadership. This research represents an action call for each of us to improve the collegiality of our work environment. (This is in place of asking the question of what the department leadership should do.) We remind readers that the collegial climate scale represents ratings of the department's degree of respect, friendliness, collegiality, collaboration, and cooperation. Improving these aspects of the work environment is within our control. Each member of every department can be more friendly, respectful, and cooperative with his or her colleagues. A few examples of action that can be initiated by anyone include organizing social events, stopping by each other's offices to say hello, and offering colleagues assistance with their teaching and writing. Our analysis reveals that efforts to improve the collegiality of the department will improve job satisfaction overall.
We turn next to Hypothesis 3. According to this hypothesis, those who work in more highly ranked departments are expected to be more satisfied than those who are employed in less highly ranked departments. Our research reveals strong relationships between institutional variables and satisfaction, thus, providing support of the hypothesis. The finding that those who are working in top ranked departments and/or in private institutions tend to have higher levels of both professional and job satisfaction is rather striking. It also corroborates existing work (Ethington, Smart, and Zeltman Reference Ethington, Smart and Zeltman1989; Sabharwal and Corley Reference Sabharwal and Corley2009).
Given the importance of the institutional variables, such as type of institution and ranking of the department, we are reminded of the robust theoretical roots of the idea that “institutions” create in-groups of workers. What can be done? Quite simply, the members of these in-groups need to reach out to nonmembers. Those employed in the elite institutions can help faculty members from other colleges and universities become more professionally involved. Networks can be inclusive or exclusive. This is a choice made by network creators and network members. Faculty from private institutions and highly ranked departments should consider purposefully including fellow academics from state institutions or lower ranked departments in their intellectual endeavors and interactions.
In addition, these findings can be considered when one is on the job market. The likelihood of finding happiness with both the department and ones work within the profession is likely to be higher if one seeks and receives employment in a highly rated department and at a private rather than a publicly funded institution. Obviously not everyone can work in a top-ranked department or in a private institution, but these departments are fostering higher levels of satisfaction. Clearly they are doing something right. (Note that these relationships hold even when controlling for the overall level of resources, which also contribute to job and professional satisfaction.) Perhaps highly ranked departments can share their best practices (practices that improve the satisfaction levels of employees) with other colleges and universities.
Following up on the role of institutional factors in satisfaction, an additional finding is one that does not relate directly to one of the selected hypotheses. This finding is the significance associated with the dummy variables representing in what geographical area in the United States one's institution of employment is located. The findings reveal that women have lower average levels of professional satisfaction in the Northeast and the South, and higher professional satisfaction in the West (the Midwest is not significantly different). When men and women are combined, lower satisfaction is registered in the South and the Midwest (compared with the West), with the Northeast not being significantly different.
With regard to Hypothesis 4, we see that too much undergraduate teaching undermines professional satisfaction, but not job satisfaction (across the full sample). This finding is understandable given that even if one enjoys teaching, the more time spent in the classroom, the less time is left for collaborating with colleagues in research and making theoretical contributions to the discipline (components of professional satisfaction as measured through our questionnaire). This relationship between a high teaching load and lower levels of professional satisfaction is driven by tenured men—although the relationship is also found (in a weaker form) among nontenured men and women.
Our research also provides confirmation of Hypothesis 5: those in higher academic ranks report higher satisfaction than those in lower ranks. Because both job satisfaction and professional satisfaction tend to be highest among full professors, perhaps these faculty members could take extra responsibility for helping to improve the collegiality of their department for others, which would help improve satisfaction among all ranks.
Symbolic rewards are important for job satisfaction. Being nominated for awards is associated with higher levels of satisfaction with one's position and one's colleagues; it is also associated with higher levels of professional satisfaction. Spreading the rewards around might be one way of creating a larger pool of satisfied workers.
Hypothesis 6 is, in general, confirmed: publishing leads to greater levels of professional satisfaction (or higher professional satisfaction leads to greater productivity in terms of publications). This relationship is robust and holds across the full sample and among all subgroups, except for untenured women. In the Hagedorn (Reference Hagedorn2000) framework, publications represent achievement, which is a motivator that leads to increased satisfaction. If we turn the causal arrow the other way, the finding ties in with the established notion that increased satisfaction improves productivity. Thus, again, we have evidence that improving the work environment is a public good.
How do we explain that attending more conferences is associated with higher levels of professional satisfaction, but also with more reports of discrimination? Clearly professional satisfaction increases with increased participation in the discipline through publications and conference attendance. Increased participation in the discipline, however, also creates a heightened awareness of what is wrong with the discipline. If one is going to conferences and participating on editorial boards and professional committees, it is harder to ignore the issues that trouble the profession. Note that service on editorial boards and professional association committees (professional recognition) works against job satisfaction and reports of a collegial department, and increases the likelihood of reporting experiences with discrimination. It is possible that the extra work associated with editorial boards and professional committee service could pull faculty members away from regular interaction with departmental colleagues, thus creating a distance associated with collegial interactions. More likely, however, is that professional service leads to greater knowledge of particular inequities that remain characteristic of the political science discipline.
ACKNOWLEDGMENTS
The survey on which the analyses reported herein are based was funded by the APSA. We are indebted to APSA executive director Michael Brintnall for his support and to Sean Twombly for his assistance. An early version of this article was presented at the Midwest Political Science Annual Meeting in Chicago, April 2012.
APPENDIX A: Survey Methodology
QUESTIONNAIRE DESIGN
In 2005, the APSA Committee on the Status of Women in the Profession (CSWP) proposed to the president of APSA that the association conduct research associated with the recommendations that emerged from the March 2004 Workshop on Women's Advancement in Political Science organized by Michael Brintnall and Linda Lopez (American Political Science Association), Susan Clarke (University of Colorado, Boulder), and Leonie Huddy (Stony Brook University). After the research proposal was approved, the CSWP used questionnaires that had been used in research published by Hesli and Burrell (Reference Hesli and Burrell1995), Hesli, Fink, and Duffy (Reference Hesli, Fink and Duffy2003) and Hesli, DeLaat, Youde, Mendez, and Lee (Reference Hesli, DeLaat, Youde, Mendez and Lee2006) to develop a new survey instrument. Additional questions were added from questionnaires developed by the National Research Council and the University of Michigan's fall 2001 Survey of Academic Climate and Activities, which was created for an NSF ADVANCE project. The following reports were also used to help generate questions.
Blau, F. 2002. Report of the Committee on the Status of Women in the Economics Profession. American Economic Review 92: 516–20.
Commission on Professionals in Science and Technology (CPST). 2000. Professional Women & Minorities: A Total Human Resource Data Compendium, 13th edition. Washington, DC: CPST.
Creamer, Elizabeth. 1998. Assessing Faculty Publication Productivity: Issues of Equity. ASHE-ERIC Higher Education Report 26 (2). Washington, DC: The George Washington University.
Fox, Mary Frank. 1995. “Women and Scientific Careers.” In S. Jasanoff, J. Markle, J. Petersen, and T. Pinch, eds., Handbook of Science and Technology Studies (pp. 205–223). Newbury Park, CA: Sage.
Fox, Mary Frank. 1998. “Women in Science and Engineering: Theory, Practice, and Policy in Programs.” Signs: Journal of Women in Culture and Society 24 (Autumn): 201–23.
Sarkee, Meredith Reid and Nancy E. McGlen. 1992. Confronting Barriers: The Status of Women in Political Science, Journal of Women, Politics & Policy 12 (4) 43–86.
A draft of the questionnaire was circulated to the members of the APSA status committees. The questionnaire was revised and expanded to address the concerns of the members of the status committees. The instrument was pilot tested by distributing it to all political science faculty members at one research university and at one private four-year college. The feedback from the pilot test was used to make further revisions in the questionnaire.
SAMPLE SELECTION
We used as our target population the names contained within the APSA “faculty” file. We used this file of 11,559 names to create a sample population file of 5,179 names. The original “faculty” file was stratified by department size. To ensure the adequate representation of faculty members from medium and small size schools we over-sampled from these. Names were selected randomly from the “faculty” file for the “sample” file.
SURVEY PROCEDURE
Using e-mail addresses, all persons in the sample file were sent a letter of invitation to participate in the study from the executive director and the president of the APSA. Incorrect e-mail addresses (addresses that bounced back) were replaced with random selections from the “faculty” file. These persons were also mailed an invitation letter. The cleaned “survey” file was sent to the Survey Research Center (SRC) at the Pennsylvania State University.
Individuals in the sample were sent an e-mail from SRC inviting them to participate in the survey. This invitation included a link to the web-based survey containing a unique identifier for each potential participant. Only one completed survey was allowed for each identifier. The initial invitation was e-mailed to respondents on August 27, 2009. Follow-up reminders were sent to nonresponders on September 10, 2009, September 24, 2009, October 8, 2009, and October 29, 2009. From among the 5,179 original addresses, 1,399 completed the survey (252 invalid addresses, 105 refusals, and 3,423 nonrespondents).
Among the total set of respondents, 68% are men and 32% are women. According to APSA data, the percent of women in the population from which we drew the sample (all political science faculty members in the United States) was 28% (in 2009). Table A1 shows the percent of survey respondents at each rank alongside of the percent of faculty members in each rank throughout the United States according to APSA data for 2009. With regard to respondents' gender, among assistant professors, 45% were women; among associates, 28% were women and among full professors, 24% were women. The corresponding numbers for the population as a whole are in the table A1.
Table A1 Survey Respondents and the Population

APPENDIX B: Variables Included
Dependent Variables:
Using seven questions relevant to the career satisfaction of respondents, we conducted factor analysis, and two separate dimensions emerged. Given these results, we named those two scales Job Satisfaction and Professional Satisfaction respectively.
Job Satisfaction: The first scale was constructed using a mean of the following three questions (Cronbach's Alpha = 0.793);
How satisfied are you with your current position?
___ a. Very satisfied
___ b. Somewhat satisfied
___ c. Neither satisfied nor dissatisfied
___ d. Somewhat dissatisfied
___ e. Very dissatisfied
How are you satisfied with the following dimensions of your professional development?

Professional Satisfaction: Given the results of the factor analysis above, the second career satisfaction scale was constructed using a mean of the following three questions (Cronbach's Alpha = 0.677);
For above two satisfaction scales, we kept the scale if two or more of the three items are available using “MEAN.2” function in SPSS to minimize the number of missing values.
Independent Variables:
Female: “What is your gender? a. Male, b. Female, c. Transgender” The dummy variable equals 1 if the response is b.
Married: “What is your personal status? a. Never married, b. Married (first time), c. Married (second or third time), d. Member of an unmarried opposite or same-sex partnership, e. Separated/divorced, f. Widowed” The dummy variable equals 1 if the response is b, c, or d.
Number of Children: “Do you or a spouse/partner of yours have any children? a. Yes (If yes, how many?), b. No” An interaction variable between a dummy for having children (response a.) and the number of children specified.
Minority: “Do you identify yourself as a member of an ethnic and racial minority group? a. Yes, b. no, c. Don't know” The dummy variable equals 1 if the response is a.
Year of Degree: “In what year did you obtain your degree?”
Current Program Ranking: A ranking of the department where the respondent is currently working. The program is ranked based on Schmidt and Chingos (Reference Schmidt and Chingos2007); Top 25 (1), Top 26–50 (2), Top 51–75 (3), Top 76–86 (4), and Unranked (5). Then the score is reversed so that higher numbers represent higher ranked department.
Joint Appointment: “Do you hold a joint appointment? a. Yes, b. No” The dummy variable equals 1 if the response is a.
Private institution: “Is this a public or a private institution? a. Public, b. Private” The dummy variable equals to 1 if the response is b.
PhD. Program: “Type of department where you are employed: a. PhD granting program, b. MA granting program, c. Department within a 4-year college, d. Department within a 2-year college, e. Other academic unit (specify)” The dummy variable equals 1 if the response is a.
MA Program: Same question as above, with the dummy variable equals to 1 if the response is b.
Number of undergraduate courses: “During the past five years, what is your typical teaching load each year? (If in your current position for less than five years, base this on the period since your appointment.)
________Number of undergraduate courses”
New Course Preparation: For this variable, we used the answer to the following question, “In the past 5 years, how many new courses (courses that you have not taught previously—do not include even major revisions of courses you have taught before) have you prepared for your department or college (if you have a joint appointment, refer to your primary unit)? _______”
Informal Mentoring: we used the answer to the following question, “On average, how many hours per week do you spend on informal mentoring activities (e.g. advising, counseling, advocating for graduate or undergraduate students or junior faculty who are not your advisees)? _______”
Number of Undergraduate Advisees: We used the answer to the following question, “For how many of each of the following types of individuals do you currently serve as official advisor? _____undergraduates”
Release From Teaching: We summed up the answers to each item of the following question, “In the past 5 years, how many courses have you been released from teaching for the following reasons:”
(Indicate how many next to each category.)
_____ with your own grant or fellowship funds
_____ by your department
_____ administrative work
_____ modified duties
_____ routine leave (e.g., development leave/sabbatical)
_____ maternity and/or parental leave
Northeast: Regional dummy for location of the respondent's institution (same for Midwest and South). West is the excluded category.
Tenured: If a respondent answered that his or her position is tenure-track, he or she is provided an additional question asking “If yes (tenure-track position), where is you in the tenure process? a. tenured, b. working on tenure, c. denied tenure, in the process of moving.” The dummy variable equals 1 if the response is a.
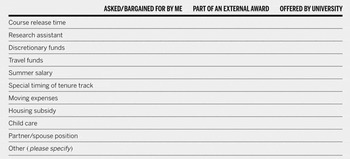
Resources Available: We counted the number of yes responses to the following question: “Have you received any of the following resources as a result of your own negotiations, the terms of an award, or as part of an offer by the university, since your initial contract at your current position? If so, please check all that apply.”
Award Nominations: We counted the number of yes responses to the following question: “Do you know whether your department or institution has ever nominated you for an award in the following areas? (Please check appropriate box.)”

Professional Recognition: We counted the number of one or more to the following question: “In terms of service for your profession, please indicate the number of times (in the past five years) you have done any of the following: (Indicate how many next to each category)”
_____ served on an editorial board (number of different boards)
_____ served as an external reviewer for another institution (such as for tenure and promotion, etc.)
Frequency of Attending Political Science Conferences: we used the answer to the following question: “How often have you attended political science conferences in the past 3 years? # of times ________”
Number of Committees: “In a typical year during the past five years, on how many committees do you serve?”
Faculty Rank: “Title of your primary current appointment”
We created an ordinal variable using the following coding: 1 (instructors, lecturers, postdocs and fellows), 2 (assistant professors), 3 (associate professors) and 4 (full professors, emeritus, and administrative positions).
Total Productivity: Question: “For your entire career, please give your best estimate of the number you have produced or have been awarded for each of the following.
______ number of articles published in referred academic or professional journals
______ number of monographs (books) published
______ number of books edited
______ number of book chapters published”
All missing values of articles, monographs, edited books and book chapters are set to zero, then we took a logarithmic transformation of the sum of these items plus one.
Climate Collegial Scale: Using the total nine survey items relevant to departmental and institutional climate, we ran factor analysis, and the two separate dimensions loaded. Given these results, we named those two scales “Collegial Climate” and “Tolerance Scale” respectively. The first scale (Collegial Climate) was constructed using a mean of the following five items (Cronbach's Alpha = 0.895);
Please rate the climate of your unit(s)/department(s) on the following continuum by selecting the appropriate number (Check the appropriate box.). For example, in the first row, the value 1 indicates hostile while the value 5 indicates friendly, and the numbers in between represent relative combinations of each.

For this scale, we kept the scale if more than three of all five items are available using “MEAN.3” function in SPSS to minimize the number of missing values.
Tolerance Scale: Given the results of the factor analysis above, the Tolerance Scale was constructed using a mean of the following three items (Cronbach's Alpha = 0.835);
Please rate the climate of your unit(s)/department(s) on the following continuum by selecting the appropriate number (Check the appropriate box.). For example, in the first row, the value 1 indicates hostile while the value 5 indicates friendly, and the numbers in between represent relative combinations of each.

For this scale, we kept the scale if more than two of all three items are available using “MEAN.2” function in SPSS to minimize the number of missing values.
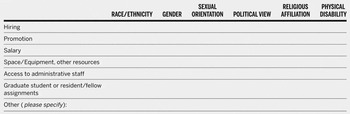
Discrimination Experience: We counted the number of positive answers (items checked) in the following survey items relevant to any discriminating experiences felt by respondents;
Please indicate in the chart below any job-related discrimination you personally have experienced at your institution within the last five years, noting the basis for the discrimination (race/ethnicity, gender, sexual orientation, etc.). Please check all that apply.