


Introduction
Guidelines for the primary prevention of coronary heart disease (CHD) are based on the assessment of an individual’s absolute risk of developing CHD rather than the value of any single risk factor (Grundy et al., Reference Grundy, Pasternak, Greenland, Smith and Fuster1999; Jackson, Reference Jackson2000). These guidelines encourage quantitative risk assessment and suggest that preventive treatment should be considered if the patient’s absolute risk exceeds a certain cut-off point. Therefore, a crucial task for clinicians involved in cardiovascular prevention is combining quantitative risk assessment with decisions about whether or not to treat individual patients. The effectiveness of drug treatment recommendations depends on the accuracy with which the clinician can estimate CHD risk in individual patients.
The most widely used algorithms for the assessment of CHD risk are based on equations derived from the Framingham Heart Study (Anderson, Reference Anderson, Odell, Wilson and Kannel1991). However, questions have been raised about the usefulness of these equations as a practical clinical tool for primary prevention. Equations based on Framingham data tend to overestimate the true cardiovascular risk in low-risk populations and underestimate it in high-risk populations (Menotti et al., Reference Menotti, Puddu and Lanti2000a; Empana et al., Reference Empana, Ducimetière, Arveiler, Ferrières, Evans, Ruidavets, Haas, Yarnell, Bingham, Amouyel and Dallongeville2003; Brindle et al., Reference Brindle, Beswick, Fahey and Ebrahim2006), which may lead to inappropriate treatment decisions. Therefore, a risk-scoring system based on a large pool of European data sets (SCORE), which includes separate equations for high- and low-risk regions, has been adopted in Sweden (Conroy et al., Reference Conroy, Pyörälä, Fitzgerald, Sans, Menotti, De Backer, De Bacquer, Ducimetière, Jousilahti, Keil, Njølstad, Oganov, Thomsen, Tunstall-Pedoe, Tverdal, Wedel, Whincup, Wilhelmsen and Graham2003), and a system based on national data (CUORE) has been developed in Italy (Giampaoli et al., Reference Giampaoli, Palmieri, Chiodini, Cesana, Ferrario, Panico, Pilotto, Sega and Vanuzzo2004).
There is evidence that risk estimation tools, such as charts or computer programs, are used rarely in clinical practice (Frolkis et al., Reference Frolkis, Zykanski, Schwartz and Suhan1998; Hickling et al., Reference Hickling, Rogers and Nazareth2005; Mosca et al., Reference Mosca, Linfante, Benjamin, Berra, Hayes, Walsh, Fabunmi, Kwan, Mills and Simpson2005; Van Wyk et al., Reference Van Wyk, van Wyk, Sturkenboom, Moorman and van der Lei2005). Judgements tend to be intuitive or subjective. Doctors’ intuitive risk estimates have been shown to deviate systematically from calculations derived from risk equations based on epidemiological data. Some studies using simulated patient cases show that general practitioners (GPs) overestimate the absolute risk when it is low (Grover et al., Reference Grover, Lowensteyn, Esrey, Steinert, Joseph and Abrahamowicz1995; Friedman et al., Reference Friedman, Brett and Mayo-Smith1996), while other studies show an underestimation of the risk, especially when it is high (Meland, Reference Meland, Laerum and Stensvold1994; Backlund et al., Reference Backlund, Bring and Strender2004). This is consistent with the observation that in primary and secondary prevention lipid-lowering treatment is often inappropriate, leading to underuse or overuse of statins (McBride et al., Reference McBride, Schrott, Plane, Underbakke and Brown1998; Abookire et al., Reference Abookire, Karson, Fiskio and Bates2001; Tonstad et al., Reference Tonstad, Rosvold, Furu and Skurtveit2004). Difficulties in assessing the risk may be behind the deviation from guidelines and may influence the physician’s decision about treatment. Furthermore, some studies have shown that factors that are not directly related to the actual risk of the patient may influence risk management practices. For example, women (Kim et al., Reference Kim, Hofer and Kerr2003), older individuals (Ko et al., Reference Ko, Mamdani and Alter2004), and patients with multiple chronic conditions (Redelmeier et al., Reference Redelmeier, Tan and Bootyh1998) have been shown to receive suboptimal cardiovascular preventive care.
The possible influence of the average risk level in a particular population on the doctors’ perceptions of CHD risk levels has not been directly investigated. Variations in mean levels of cardiovascular risk factors and cardiovascular disease mortality across European regions have been described (Murray and Lopez, Reference Murray and Lopez1997; Sans et al., Reference Sans, Kesteloot and Kromhout1997; Menotti et al., Reference Menotti, Lanti, Puddu and Kromhout2000a; Reference Menotti, Puddu and Lanti2000b; Houterman et al., Reference Houterman, Boshuizen, Verschuren, Giampaoli, Nissinen, Menotti and Kromhout2002; Levi et al., Reference Levi, Lucchini, Negri and La Vecchia2002; Conroy et al., Reference Conroy, Pyörälä, Fitzgerald, Sans, Menotti, De Backer, De Bacquer, Ducimetière, Jousilahti, Keil, Njølstad, Oganov, Thomsen, Tunstall-Pedoe, Tverdal, Wedel, Whincup, Wilhelmsen and Graham2003). In this study, we aimed to assess whether GPs in a high CHD risk country in northern Europe and in a low-risk country in southern Europe, give different estimations of cardiovascular risk and recommendations regarding lipid-lowering treatment for the same series of patient cases. Some evidence suggest that the decision to start cardiovascular therapies is dependent on patients’ baseline cardiovascular risk (Backlund et al., Reference Backlund, Danielsson, Bring and Strender2000; Alter et al., Reference Alter, Manuel, Gunraj, Anderson, Naylor and Laupacis2004). If physicians are appropriately attuned to the risk profiles of their patients, it might be assumed that patients at highest baseline risk will be investigated and treated more aggressively. Our hypothesis was that the GPs’ risk estimates would be attuned to the population risk level in a comparison between the high- and the low-risk country. As a consequence, the mean risk estimate would be higher in the high-risk country and at least as many cases would be selected for treatment in the high-risk country as in the low-risk country. The rationale for this should be a combination of clinical experience from the outcomes of patients with different patterns of risk factors, knowledge from the literature of the different risk levels in different countries, and also experience from using the recent and more correct risk-estimating tools. We also wished to investigate the correspondence between treatment decisions and the Framingham risk levels of the cases. The Framingham cut-off of the risk of developing CHD within 10 years is 20%, which is a cost-effective level for statin treatment and is currently recommended as a threshold for intensified risk factor intervention (Wood et al., Reference Wood, De Backer, Faergeman, Graham, Mancia and Pyörälä1998). The study also aimed to estimate the extent to which a subjective risk estimate of 20% was actually used as the criterion to recommend drug treatment.
We therefore investigated (a) the risk estimates and treatment decisions of GPs in two countries with known high and low cardiovascular risk; (b) the correspondence between subjective risk estimates and treatment decisions on the one hand and Framingham-derived risk estimates and recommended decisions on the other; and (c) the correspondence between doctors’ own risk estimates and treatment decisions.
Methods
Setting
The study was conducted in Stockholm, Sweden, which is part of northern Europe and represents a high cardiovascular risk area (Sans et al., Reference Sans, Kesteloot and Kromhout1997; Conroy et al., Reference Conroy, Pyörälä, Fitzgerald, Sans, Menotti, De Backer, De Bacquer, Ducimetière, Jousilahti, Keil, Njølstad, Oganov, Thomsen, Tunstall-Pedoe, Tverdal, Wedel, Whincup, Wilhelmsen and Graham2003), and in Sicily (the Caltanissetta, Enna, and Agrigento districts), which is part of southern Europe and represents a low cardiovascular risk area (Menotti et al., Reference Menotti, Lanti, Puddu and Kromhout2000b; Levi et al., Reference Levi, Lucchini, Negri and La Vecchia2002). The populations of the two areas are 1 212 000 and 870 000, respectively.
Design
The study was a cross-sectional survey. A questionnaire relating to nine clinical cases was mailed to 180 GPs (90 in each area) in October 2005, with a written reminder sent within two weeks. All GPs received the same set of nine cases in the same order. Physicians were asked to estimate the risk of CHD within 10 years on a visual analogue scale (VAS) between 0% and 100% without using a risk table or any other decision support. The risk categories currently indicated in the Framingham-based tables (low < 5%, mild 5–10%, moderate 10–20%, high 20–40%, and very high risk > 40%) were provided as anchorage points within the scale. We chose the older Framingham risk equation because it is the most widely used method for the assessment of cardiovascular risk, on which most other risk prediction methods are based (Wood et al., Reference Wood, De Backer, Faergeman, Graham, Mancia and Pyörälä1998; Jones et al., Reference Jones, Walker, Jewkes, Game, Bartlett, Marshall and Bayly2001). Although recent risk equations have been published in Sweden and Italy, they differ regarding the risk events chosen as endpoints. Sweden has adopted the SCORE system (Conroy et al., Reference Conroy, Pyörälä, Fitzgerald, Sans, Menotti, De Backer, De Bacquer, Ducimetière, Jousilahti, Keil, Njølstad, Oganov, Thomsen, Tunstall-Pedoe, Tverdal, Wedel, Whincup, Wilhelmsen and Graham2003), which estimates 10-year total cardiovascular risk, defined as fatal coronary and non-coronary cardiovascular events. Meanwhile, risk charts published in Italy take the first major fatal or non-fatal cardiovascular event as the endpoint (Giampaoli et al., Reference Giampaoli, Palmieri, Chiodini, Cesana, Ferrario, Panico, Pilotto, Sega and Vanuzzo2004). These two methods are neither comparable nor used for reference in both countries.
For each case, doctors were asked to specify whether they would recommend a pharmacological lipid-lowering treatment for the patient, assuming that lifestyle interventions had been tried for at least six months (Figure 1 provides an example of a case). The questionnaire asked for participants’ age and sex, but were anonymous to increase the likelihood that answers would be given without the use of risk tables or other decision supports.
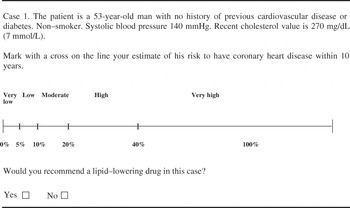
Figure 1 Example of a case description
Sample
A random sample of 90 GPs was drawn from each local database of healthcare professionals, which comprised 828 GPs in Stockholm and 732 GPs in the Sicilian study area. To enter the research study, physicians had to be Family Medicine specialists in Stockholm and board certified in Sicily.
Clinical cases
Each GP was presented with nine patient cases with a combination of the variables included in the Framingham risk tables: age, sex, systolic blood pressure, cholesterol, and smoking. No patient had a history of cardiovascular disease or diabetes, as risk assessment is not relevant for patients with such conditions, and no patient had systolic blood pressure of above 160 mmHg, since higher values might have caused the doctors to consider the treatment of hypertension more relevant than the treatment of hypercholesterolemia. The cases were constructed so that the resulting 10-year risk of a fatal or non-fatal coronary event, based on the Framingham equation (Anderson, Reference Anderson, Odell, Wilson and Kannel1991), was composed of a spectrum of high- to low-risk patients. According to this equation, a 10-year absolute CHD risk of 20% or more is the threshold for pharmacological lipid-lowering treatment. Therefore, 20% was the cut-off level when defining high- and low-risk cases in the Results section. The calculated Framingham median score for all cases was 17.0 (range 3–45), for the four high-risk cases 30.5 (range 27–45), and for the five low-risk cases it was 15.0 (range 3–17).
To minimize the risk of an anchorage effect (Tversky and Kahneman, Reference Tversky and Kahneman1974), we opened the questionnaire with the medium-risk case; the following cases were randomly ordered.
A summary of the nine cases presented to the doctors is shown in Figure 2.
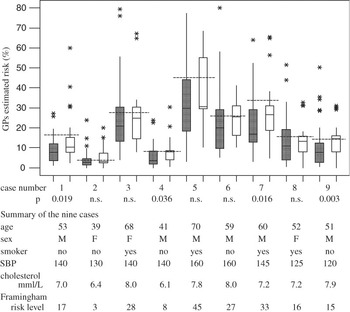
Figure 2 Boxplot of doctors’ risk estimate in Stockholm (filled bars) and Sicily (empty bars) and summary of the nine cases in the order they were presented to the doctors, along with the calculated Framingham risk level for each case (dashed lines). The bottom of the boxes are at the first quartile, the top at the third quartile, and the continuous lines across the boxes are at the median value. The whiskers are drawn to the highest and lowest values that are not considered as outliers. Outliers, marked with asterisks, are estimates outside these limits
Statistical analysis
Summary measures for normally distributed continuous variables are given as means (SD) and for others as medians (interquartile range). Categorical variables are presented as percentages. The statistical significance of the differences between Stockholm and Sicily was tested with the independent two-sample t-test or Mann–Whitney rank sum test. Multiple linear regression analysis was used to identify independent predictors of risk estimate and decision to start treatment, with risk estimate and proportion of decisions to treat as dependent variables, and sex and age as independent variables.
We used Minitab (version 13) for statistical analysis.
Results
General data
Thirty-eight doctors (42.2%) answered the questionnaire in Stockholm (median age 54 years, range 43–65) and the same number in Sicily (median age 51 years, range 42–70), respectively. There were more men among GPs in Sicily (76.3%) than in Stockholm (39.5%). Risk estimate and proportion of decisions to treat were not significantly related to the doctor’s age or sex according to the regression analysis.
Ratings
GPs’ risk estimates for each case are shown in Figure 2 as box-plots. The inter-individual differences within each group in rating risk were large, and in both groups the ratings were in general lower than the Framingham-derived estimates. The risk estimates for each of the nine cases are shown in Table 1 as medians.
Table 1 Risk estimates for each case
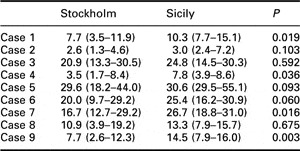
Data are expressed as medians (interquartile range).
The median ratings, one for each GP across the nine cases, were calculated and compared between the two groups of doctors (Table 2). Overall risk estimates did not differ significantly. However, when the cases were divided according to their actual Framingham risk level into four high-risk cases and five low-risk cases and analysed separately, estimates from Stockholm were significantly lower for both high- and low-risk cases.
Table 2 Risk estimates for the entire group of cases, high- and low-risk cases
Data are expressed as medians (interquartile range).
The concordance of GPs’ risk estimates to the calculated Framingham risk, defined as the mean value of the proportions of each GP’s risk estimates above 20% when the actual Framingham risk was above 20%, and each GP’s risk estimates below 20% when the actual Framingham risk was below 20%, was significantly lower in Stockholm than in Sicily for both the entire group of cases (0.73 (0.17) and 0.84 (0.13), respectively, P = 0.006) and the high-risk cases subgroup (0.53 (0.42) and 0.76 (0.27), respectively, P = 0.007). The difference was not statistically significant for the low-risk group.
Decisions
Table 3 shows the mean values of the proportions of GPs’ decisions to start pharmacological treatment, calculated as the number of ‘yes’ decisions divided by the total number of decisions for each GP. These were higher in Sicily than in Sweden, but the difference was not statistically significant in the entire group or in the high- and low-risk subgroups.
Table 3 GPs’ decisions to treat for the entire group of cases, high- and low-risk cases

Data are expressed as means (SD) of GPs’ proportions to treat.
Relation between estimates and decisions
Compared to Sicilian GPs, Swedish GPs less often decided to start pharmacological treatment when their estimated risk was above the cut-off limit of 20% (Table 4). The difference was statistically significant for the entire group of cases and for high-risk cases, but there was no significant difference when the estimated risk was below 20%.
Table 4 Relation between GPs’ risk estimate and decision to start treatment
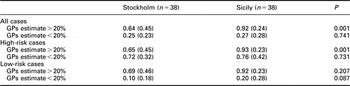
Data are expressed as means (SD) of GPs’ estimate proportions.
Discussion
This study demonstrates that two groups of GPs from areas with different cardiovascular risk levels, Sweden and Sicily, make different cardiovascular risk estimates when assessing the same set of clinical cases.
We found that the GPs’ estimates were lower in Stockholm than in Sicily, which was contrary to our hypothesis. Current guidelines recommend starting treatment on the basis of global risk rather than single risk factors, but the influence of the risk level in the overall population on a GP’s risk estimate for a single patient has received little attention. It is generally assumed that GPs are attuned to the risk level in their country and judge accordingly. Thus a patient with a certain pattern of risk factors should be correctly judged as having a higher risk by Swedish doctors than the corresponding patient in a Sicilian context. However, our findings support a different line of thinking in accordance with the demonstrated relativism of judgments in everyday life (Parducci, Reference Parducci1968). When the background risk of the population is high, a subject with a high absolute risk level is perceived as having a medium risk. Conversely, a subject with the same risk pattern in a low-risk population will be considered as very high risk. We suggest that the different background cardiovascular risk in the two populations leads to the underestimation of actual cardiovascular risk of a patient in Sweden and to the overestimation in Sicily. The differences in risk estimate reflect the differences in the population cardiovascular risk profile between the two countries.
Sicilian doctors estimate closer to Framingham values and they appear to use the 20% risk level as a criterion for treatment decision to a greater extent than Swedish doctors. This could be in part because they are more familiar with risk estimates; statins are free of charge in this region for patients with an absolute cardiovascular risk of above 20%, calculated with the national risk charts. A rule such as this may induce doctors to raise the risk estimate to the desired 20% level.
Our results are in line with a previous study that demonstrated that Swedish GPs underestimate the risk for high- and moderate-risk patients (Backlund et al., Reference Backlund, Bring and Strender2004).
When we investigated the relation between subjective risk estimates and decisions to treat with respect to the cut-off level of 20%, we found that GPs in Stockholm were less likely than GPs in Sicily to start treatment when their risk estimate was above 20%. Therefore, Swedish GPs tend to under-treat both through underestimation of the risk and reluctance to treat even when their own risk estimate is above 20%.
In this latter situation, reluctance to treat may be due to the lack of awareness of 20% as a recommended cut-off point to start treatment. Also, there seems to be some perception of the risk level of a specific case compared to that of the population, which may influence the decision to treat, independent of the quantitative estimate. Due to the doctors’ perception of the high background cardiovascular risk in the population, even a patient with a subjective risk estimate well above 20% may not be considered as a candidate for pharmacological treatment. This could have important implications in clinical practice. Subjects who are at high risk may not reach the threshold for treatment and thus lack appropriate drug therapy. This result is consistent with our previous finding that pharmacological intervention tends to be started at higher levels of cholesterol in Stockholm than in Sicily (Danielsson et al., Reference Danielsson, Vancheri, Åberg and Strender1998). Finally, the reluctance to treat may reflect disagreement with the guidelines. Regardless of the reasons, the implication should be encouraging the use of objective risk estimation tools and to improve doctors’ education to identify subjects for whom the benefits of lipid-lowering drugs are documented.
Our study has some limitations. Firstly, the GPs’ estimates might have been influenced by the structure of the clinical cases, which was limited to a few variables and might not reflect real-life practice. Because all doctors faced the same cases, however, valid comparisons can still be made. Furthermore, the use of clinical vignettes to measure the quality of physicians’ practice has been shown to have a rather good validity (Kelly et al., Reference Kelly, Eliasson, Stocker and Hnatiuk2002; Peabody et al., Reference Peabody, Luck, Glassman, Jain, Hansen, Spell and Lee2004). Nonetheless, physicians may respond to clinical vignettes in an ideal fashion that differs from their usual practice. Secondly, the moderate response rate we observed was a possible source of bias, although this rate is not unusual for a mail survey (Friedman et al., Reference Friedman, Brett and Mayo-Smith1996). Thirdly, we cannot exclude the possibility that some GPs used risk tables in their risk estimate and treatment decisions. However, a recent European survey showed that the proportion of doctors using risk calculator charts is only 13% (Hobbs and Erhardt, Reference Hobbs and Erhardt2002). In Italy, the main use of risk charts is for economical reasons, as statins are free of charge when the calculated cardiovascular risk of the patient is above 20%.
In conclusion, we found that GPs’ cardiovascular risk estimates and pharmacological lipid-lowering treatment recommendations in a high cardiovascular risk country in northern Europe differ from those made in a low-risk country in southern Europe, for the same series of patient cases.
Our results provide evidence that the average cardiovascular risk in the general population influences the GPs’ perception of cardiovascular risk in a single patient. The GPs’ risk estimates seem to be inversely related to the background risk of the population. This has practical implications. In high-risk populations, true cardiovascular risk is likely to be underestimated, and high-risk individuals may not receive appropriate drug treatment. Conversely, overestimation of true risk in low-risk populations may lead to drug treatment overuse.
These results are unexpected and contrary to our hypothesis that the GPs’ risk estimates would be higher in the high-risk country.
Moreover, our results also give some information about the prescription attitude, which is not related to the actual risk of the patient, but may instead result from the doctors’ perceived risk.
Further studies in more areas with different risk levels might be useful in testing our tentative hypothesis of an inverse relation between doctors’ risk judgements and the background risk in the population.
Knowledge of such differences may allow risk scores to be a more effective clinical tool.


