


I. INTRODUCTION
Solid state and structural characterization is a key element in Materials Science. A variety of analytical techniques such as powder X-ray diffraction (PXRD), differential scanning calorimetry, Fourier transform infrared and Raman spectroscopy, solid state nuclear magnetic resonance, terahertz pulsed spectroscopy, and optical microscopy are used for studying the structure of materials in the solid state (Vitez et al., Reference Vitez, Newman, Davidovich and Kiesnowski1998; Bugay, Reference Bugay2001; Stephenson et al., Reference Stephenson, Forbes and Reutzel-Edens2001; Német et al., Reference Német, Demeter and Pokol2009; Shen, Reference Shen2011). Most of these techniques have the ability to distinguish between different solid phases of the material and have been successfully used for the qualitative and quantitative analysis of impurity phases, with a varied range of sensitivity. For various reasons such as small sample size, rapid analysis, ease of sample preparation, and nondestructive nature, PXRD is one of the most commonly employed tools for the identification and characterization of materials. Owing to a high degree of the robustness and reproducibility of PXRD methods, it is one of the most preferred techniques for regulated pharmaceutical analysis, wherein the phase analysis of the active pharmaceutical ingredient (API) is of great significance because of its implications on product performance (Chieng et al., Reference Chieng, Rades and Aaltonen2011). The solid forms of API during various stages of drug development, e.g., manufacturing, processing, and storage are typically monitored by PXRD.
While PXRD is the most preferred technique for qualitative and quantitative phase analysis, it is generally less preferred for the quantification of low levels of phase impurities compared with other available spectroscopic tools such as IR, Raman, and terahertz. However, with advances in instrumentation and computational algorithms, there have been tremendous improvements with respect to sensitivity with PXRD analysis toward identifying and quantifying different crystalline phases (Newman and Byrn, Reference Newman and Byrn2003). Quantitative analysis using PXRD is generally performed using different regression methods based on the analysis of a single peak (SP) or by whole profile fitting (WPF) (Suryanarayanan, Reference Suryanarayanan and Brittain1995; Német et al., Reference Német, Sajó and Demeter2010; Bernardi et al., Reference Bernardi, Ferreira, Cuffini, Campos, Monti, Kuminek, Oliveira and Cardoso2013). Both these methods are based on the direct correlation of the intensity of the reflection with the weight fraction of the characteristic phase typically measured through peak height, peak area, and/or their ratio. In general, for the quantification of lower amounts of impurity phase, the SP method is preferred over the WPF method. This is particularly so for the organic compounds (molecular crystals), where the PXRD pattern consists of closely spaced diffraction peaks within practically limited 2θ range and requires relatively higher exposure time. With the SP method, quantitative analysis could be achieved with practical data collection times by focusing on the 2θ range of interest (Stephenson et al., Reference Stephenson, Forbes and Reutzel-Edens2001). Many studies have demonstrated that the SP method using highest intensity peak [I/I 0 = 100%] can be more effective for quantitative analysis when peak intensity is measured using the area under the curve of the peak than the peak height (Cullity, Reference Cullity1978; Suryanarayanan, Reference Suryanarayanan and Brittain1995; Roberts et al., Reference Roberts, Williams, Grimsey and Booth2002; Tiwari et al., Reference Tiwari, Chawla and Bansal2007; Kuncham et al., Reference Kuncham, Shete and Bansal2014). The appropriate consideration of the chemical purity/impurity attributes of materials under analysis is an important aspect to be focused, particularly when lower limits of phase detection and quantification are desired. Also, in general, the peak parameters associated with diffraction lines are strongly influenced by material attributes such as homogeneity of phase distribution in powder, preferred orientation, and potential sources of operational errors such as the nature of the sample (triboelectric properties), sample preparation, and instrumental artifacts. Hence, it is critical to establish the robustness and reliability of such quantitative measurements to be able to extend their use in regulated testing environments, e.g., food and pharmaceuticals.
Brettphos oxide (BPO, Figure 1) is an oxidation byproduct of a phosphine ligand, Brettphos, commonly used in palladium catalyzed Buchwald–Hartwig reactions for the synthesis of carbon–nitrogen (C–N) bonds (Fors et al., Reference Fors, Watson, Biscoe and Buchwald2008; Hartwig, Reference Hartwig2008; Surry and Buchwald, Reference Surry and Buchwald2008; Surry and Buchwald, Reference Surry and Buchwald2011). Implications of the presence of BPO, a potential process impurity, on the solid form analysis of API and complexities associated with polymorphism of BPO have been previously reported (Dikundwar et al., Reference Dikundwar, Chodon, Thomas and Bhutani2017; Dikundwar et al., Reference Dikundwar, Pal, Chodon, Narasimhamurthy, Kameshwar, Sundaram and Bhutani2019). In this manuscript, we highlight the feasibility of the quantification of ultra-low levels of BPO in the API, using simple laboratory PXRD measurements.

Figure 1. Chemical structure of BPO [IUPAC name: dicyclohexyl(2′,4′,6′-triisopropyl-3,6-dimethoxy-[1,1′-biphenyl]-2-yl)phosphine oxide; mol. formula: C35H53O3P, mol. weight: 552.77 Da].
II. EXPERIMENTAL
A. Materials
All chemical reagents were commercially available and were sourced from Sigma-Aldrich (India) unless otherwise noted. API and BPO were synthesized using previously reported methods (Dikundwar et al., Reference Dikundwar, Chodon, Thomas and Bhutani2017). Water with a resistivity of 18.2 MΩ-cm was obtained from a Milli-Q plus system (Millipore AS, MA, USA). High-performance liquid chromatography (HPLC) grade trifluoroacetic acid and acetonitrile were purchased from Sigma-Aldrich (St. Louis, MO, USA).
B. Preparation of standard mixtures of BPO and API
Known quantities of BPO and the API (both assay corrected) were mixed using an agate mortar and pestle with the help of a spatula to prepare a stock sample (target concentration, BPO in API = ~10% w/w and achieved concentration, BPO in API = 9.236% w/w). The stock sample concentration was further reduced to desired standard compositions (0.90%, 0.45%, 0.35%, 0.25%, 0.15%, 0.10%, and 0.07% w/w BPO in API; Table I) by adding required quantities of the API using the geometric dilution method. Details are provided in the supplementary information.
TABLE I. Standard composition physical mixtures prepared by spiking BPO in API.

a The batch of API used for preparing standard mixture samples of BPO spiked API contained 0.03% w/w (259 ppm) BPO as confirmed by HPLC analysis.
While the description of the API has not been included because of proprietary reasons, it is to be noted that the API is an organic molecule and does not contain any heavy elements (beyond silicon). Also, particle size and shape of the API and BPO materials were evaluated and found to have no significant impact with respect to microabsorption or preferred orientation effects.
C. Powder X-ray diffraction (PXRD)
PXRD data were recorded at room temperature on a Bruker D8 Advance diffractometer equipped with a LYNXEYE position sensitive detector with an angular opening of 2.9°, using CuKα radiation (λ = 1.5406 Å) generated from a sealed tube X-ray source. A nickel filter (thickness: 0.02 mm) was used to filter Kβ radiation. The diffractometer incident beam path was equipped with a 2.5° soller slit. All data were collected in the Bragg–Brentano (theta/theta) horizontal geometry using flat plate reflection mode. The peak areas were obtained by integration using MDI JADE 9 (MDI, 2012). Method parameters were optimized to suite the requirement of the detection and quantification of low levels of BPO as explained in the following sections.
1. PXRD method development
Sample preparation methods as well as instrumental parameters such as scan rate, divergence slit width, and anti-scatter slit width, have been reported to affect the area of diffraction peaks (Jenkins and Snyder, Reference Jenkins, Snyder and Winefordner1996; Tiwari et al., Reference Tiwari, Chawla and Bansal2007). These parameters were evaluated using BPO spiked API test samples. Sample rotation was used during the scan to minimize potential mixing inhomogeneity effects and improving particle statistics.
a Sample preparation
To minimize particle size dependant effects, standard mixture samples were prepared as fine powder by light manual grinding. Mostly irregular block-shaped particles with a particle size of <20 μm (by optical microscopy) were observed for the ground samples. Specimen preparation was carried out under controlled relative humidity (55 ± 5%) and temperature (25 ± 2 °C). Poly(methyl methacrylate), PMMA sample holder supplied by Bruker AXS GmbH with a sample reception depth of ~0.25 mm and circular grooves, accommodating ~450 mg of material, was uniformly packed with powder samples. Smooth sample surface coplanar with that of the outer surface of the holder was achieved by pressing with a microscope glass plate.
b Optimization of scan rate
Scan rate for data collection was optimized by assessing the effect of increment per step (i.e., step size) and exposure time per step (i.e., step time) individually, by monitoring the corresponding effect on the intensity and resolution of diffraction peaks of interest.
c Optimization of divergence slit width
The optimization of divergence slit width was carried out by assessing its effect on the observed intensity of BPO peaks relative to API peaks. Also, the effect of slit width on the flatness of baseline was monitored. The experimental ratio of the intensity of BPO peak and the intensity of API peak in a standard mixture was calculated. A slit width of 0.5° was found to be optimal with relatively higher intensity ratio and acceptable baseline flatness.
Based on the outcomes of different evaluations, an optimized PXRD method (Table II) was finalized to be used for the quantitative analysis of BPO in API.
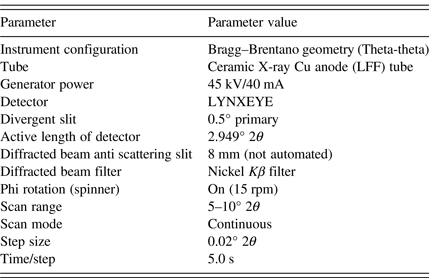
TABLE II. Method parameters for the optimized PXRD method.
2. Preparation of the calibration curve
Standard physical mixtures of BPO in API (corresponding to 0.90%, 0.45%, 0.35%, 0.25%, 0.15%, 0.10%, 0.07%, and 0.03% w/w) were analyzed in quintuplet (n = 5) using the PXRD method as described in Table II. A calibration curve was plotted using the area of a BPO peak (at 8.86° 2θ) in comparison to the API peak (at 7.38° 2θ) against the weight fraction of BPO in the API.
3. PXRD method validation
The PXRD method (Table II) developed for the quantification of BPO in API was evaluated for the standard set of validation parameters such as specificity, limit of detection (LOD), limit of quantification (LOQ), accuracy, precision, and ruggedness as per relevant guidelines (ICH harmonised tripartite guideline Q2 (R1), 1995; ICH harmonised guideline Q6A, 2000; US FDA, 2007). Details of assessment on each of these parameters and corresponding data are provided in supplementary information.
a Specificity
Specificity of the method was confirmed by individually analyzing BPO and the API samples. Unique diffraction peaks were identified for both BPO and the API.
b Limit of detection and limit of quantification
Based on the calibration curve, LOD and LOQ for the optimized method were calculated using Eqs. (1) and (2), respectively. The linear range of the calibration curve was used for determining these values.
 $${\rm LOD} = \displaystyle{{3.3\sigma } \over S}\;$$
 $${\rm LOQ} = \displaystyle{{10\sigma } \over S}\;$$
where σ is the standard deviation of the response (n = 6) and S is the slope of the calibration curve.
c Precision
Precision (repeatability) of the method was confirmed by calculating the relative standard deviation (RSD) of area ratio from nine measurements (i.e., three concentrations of BPO, each in triplicate).
d Accuracy
Accuracy of the method was determined by performing recovery study at three different concentrations measured in triplicate. The percentage recovery in each case was calculated.
e Estimation of assay error
Assay error parameters such as instrument repeatability and intra- and inter-day reproducibility were evaluated by comparing RSD of area ratio from different measurements. Intra-day reproducibility was estimated by acquiring data on the same standard mixture sample five times over a period of 8 h. For inter-day precision, results from samples analyzed on different days were compared. RSDs of the peak area ratio of these measurements were calculated.
D. High-performance liquid chromatography
Chromatographic analyses were performed using an Agilent 1200 series HPLC system consisting of a quaternary pump, a column oven, an on-line degasser, and a well plate auto sampler (Agilent technologies, Palo Alto, CA, USA). Mobile phase A was prepared by adding 0.5 ml of 99.0% w/v trifluoroacetic acid to a mixture containing 900 ml of water and 100 ml of acetonitrile. Mobile phase B was prepared by adding 0.5 ml of 99.0% w/v trifluoroacetic acid to a mixture of 900 ml of acetonitrile and 100 ml of water. Samples were injected onto an HPLC column Waters Xbridge C18, 100 mm × 4.6 mm i.d., 3.5 μm particle size (Waters Gesellschaft m.b.H., Czech Republic); at a flow rate of 1.0 ml/min and eluted using a gradient elution program. A UV photodiode array detector was used (a detection wavelength of 205 nm) for the analysis (see supplementary information for details).
III. RESULTS AND DISCUSSION
The neat form of BPO exists as a highly crystalline material [percentage crystallinity calculated using EVA (Bruker AXS GmbH, DIFFRAC.EVA, User Manual, version 09, 2017) = 94.47%]. The phase purity of bulk BPO was confirmed by the comparison of the bulk PXRD profile of BPO with the simulated PXRD pattern from the reported crystal structure (Figure 2). While the overall profile matches well with the reference pattern, minor differences in relative peak intensity can be noted indicating possible preferred orientation.
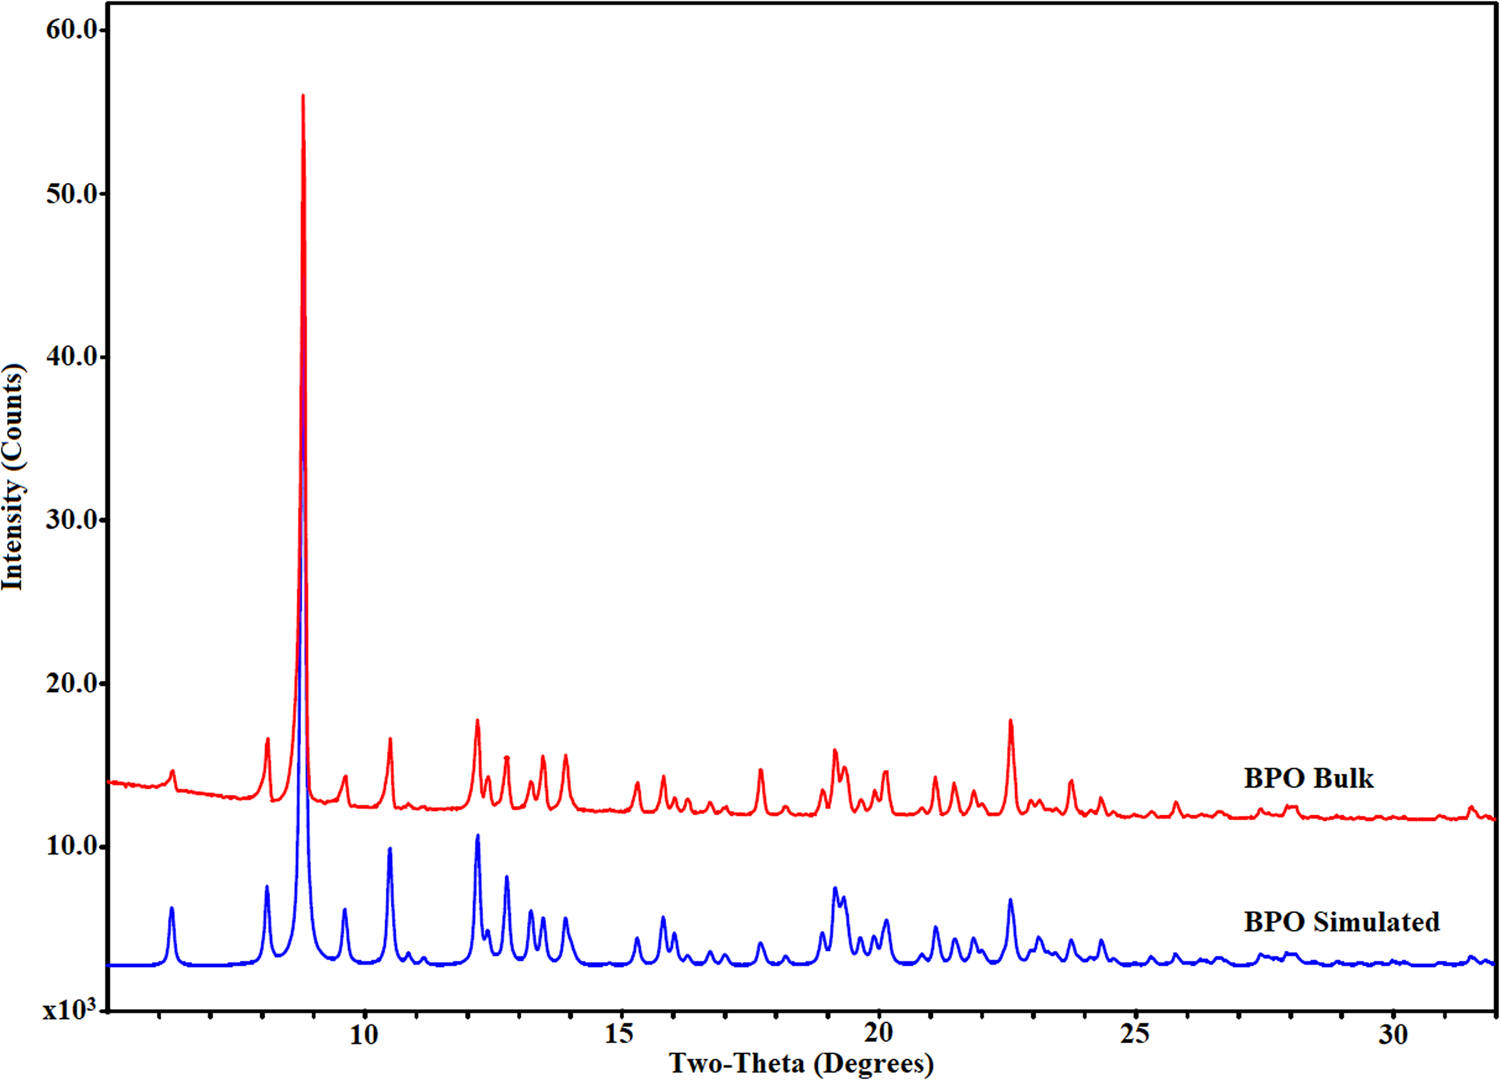
Figure 2. Comparison of the bulk PXRD pattern of BPO with the simulated PXRD pattern (BPO Form-I; CuKα radiation, λ = 1.5406 Å).
Notably, the diffractogram of BPO is significantly distinct to that of the API for a broader 2θ range, allowing for unambiguous form identification. A scan range of 5–10° 2θ was selected for the purpose of quantitative evaluation, as it covers the most intense peak of BPO at 8.86° 2θ which is non-interfering with diffraction peaks of API (Figure 3).

Figure 3. PXRD overlay of BPO (Form-I) and API in the range 5–10° 2θ.
With regard to quantitative analysis based on the SP method, the 8.86° 2θ peak satisfies all necessary requirements (Suryanarayanan, Reference Suryanarayanan and Brittain1995). It is a unique peak with respect to the diffraction pattern of majority phase, i.e., API; is the highest intensity peak of minority phase (BPO); has a Gaussian distribution and is indeed a SP as indicted by the hkl list derived from the crystal structure of BPO. Hence, the method development was mainly focused on monitoring the intensity and resolution of this peak in the test mixture samples. All critical method parameters were optimized within the scan range of 5–10° 2θ, as described in the experimental section. Interestingly, the observed intensity of the characteristic peak of BPO increases gradually with an increase in the amount of the BPO spiking level in the samples, indicating the suitability of the selected method for the purpose of quantitative analysis (Figure 4). While an API diffraction peak at 8.48° 2θ appears to have a small overlap with the diffraction peak of interest from BPO (8.86° 2θ), peak profile fitting analysis suggests no significant interference between these peaks (see Section 4.1 in Supplementary Information).

Figure 4. PXRD overlay of BPO spiked API (% w/w) standard mixtures.
To ascertain this visual observation quantitatively, intensities of the BPO peak for each of the samples were harvested through peak area measurements. Considering variations in the weight fraction of BPO in the standard mixtures, intensity ratio with a corresponding peak of API at 7.38° 2θ was used for comparison (Cullity, Reference Cullity1978). For a biphasic mixture (BPO + API), the amount of BPO present and the intensity of peak corresponding to BPO can be expressed as
 $$\displaystyle{{I_{{\rm BPO}}} \over {\lpar {I_{{\rm BPO}}{\rm \;} + {\rm \;}I_{{\rm API}}} \rpar }} = {K}w_{{\rm BPO}}{\rm \;}$$
where I BPO is the highest intensity peak area of the impurity phase BPO (at 8.86° 2θ), I API is the peak area for the selected peak (at 7.38° 2θ) in the majority phase, i.e., API, w BPO is the weight fraction (% w/w) of BPO in the standard mixture, and K is a constant which can be determined from the calibration curve.
Figure 5 shows a calibration curve highlighting a linear relationship between the measured intensity [I BPO/(I BPO + I API)] and the content of BPO in the standard mixtures. Characteristic descriptors of the curve are summarized in Table III.

Figure 5. Calibration curve plotted using area ratio corresponding to the integrated intensity of BPO peak at 8.86° 2θ against the weight fraction of BPO in the API in standard mixtures.
TABLE III. Key validation parameters for the PXRD method for the quantification of BPO in API.

A near-perfect linear relationship between observed intensity and weight fraction of BPO also suggests that the standard mixture samples are least affected by the phenomenon of microabsorption (Suryanarayanan, Reference Suryanarayanan and Brittain1995). In general, for the quantitative analysis of a multiphasic sample containing hetero components, it is important to consider potential differences in mass absorption (attenuation) coefficient, μ of the individual components. In cases where the mass absorption coefficient of impurity (μi) is significantly higher (μ i ≫ μ p) or lower (μ i ≪ μ p) than that of the parent phase (μp), one may expect a nonlinear response between the observed intensities (I/I 0) and percent weight fraction (Alexander and Klug, Reference Alexander and Klug1948). In the present case, since BPO is a mostly organic molecule (mol. formula: C35H53O3P), the X-ray absorption behavior of BPO is comparable to that of the API. The calculated values of linear absorption coefficient (CuKα) for BPO and API based on elemental absorption coefficients listed in International Tables for Crystallography (Volume C, 2006) are 0.934 and 0.850 mm−1, respectively.
Based on the calibration curve (Figure 5), the predicted LOD and LOQ for BPO in the API were calculated to be 0.04% w/w and 0.11% w/w, respectively, using Eqs. (1) and (2). To experimentally verify these surprisingly low levels of predicted LOD and LOQ and to be potentially able to qualify such a PXRD method for quantitative analysis, method validation was performed. Evaluations of the available standard mixtures corresponding to the predicted values of LOD (0.068% w/w) and LOQ (0.133% w/w) showed promising results with RSD values (n = 6) of 10.0% for LOD and 5.9% for LOQ. The assessment of the next available lower level for LOQ, i.e., 0.099% w/w BPO in API was also performed and RSD of 7.7% (n = 6) instilled confidence to qualify it as LOQ. Accordingly, the method linearity was established in the range of 0.099–0.866% w/w of BPO in API. The method was found to be precise with RSD between 1.9% and 4.5% and accurate with recovery in the range of 85–101%. Overall, the validation results showed the reliability and ruggedness of the method. Results from the validation study are summarized in Table III, and further details are provided in the supplementary information.
In order to benchmark the quantification results obtained from PXRD analysis, the standard mixture samples with “unknown” concentration of BPO in API were analyzed by PXRD and by HPLC using an appropriate method of analysis (see supplementary information for details). Table IV below shows the comparison of the results obtained by PXRD and HPLC techniques. Notably, the calculated content of BPO in API using the PXRD calibration curve (y = 0.1405x−0.0025) was comparable with the corresponding values obtained by HPLC.
TABLE IV. Comparison of the content of BPO in “unknown” samples of BPO spiked API determined by PXRD and HPLC techniques.

IV. CONCLUSION
While PXRD is used commonly for qualitative and quantitative phase analysis, its applicability in the quantification of low levels of phase impurities is generally limited. Achieving the desired level of accuracy and precision for lower detection limits, using PXRD, appears to be one of the commonly perceived restrictions. It is shown that with appropriate methodology and experimentation, low levels of the solid-state impurity, BPO, could be detected (down to 0.07% w/w) and quantified (down to 0.10% w/w) by the PXRD technique using laboratory X-ray source, which is comparable to reporting threshold as per ICH Q 3A (R2) guidelines. The development of a method with increased sensitivity could be achieved by the systematic evaluation of diffractograms of relevant analytes and by optimizing instrumental parameters. Further, successful method validation provided significant confidence on reliability and transferability of such methods for use in regulated industries such as pharmaceuticals. Close agreement of quantitative results from PXRD with that obtained from liquid chromatographic analysis (HPLC) confirmed accuracy of such measurements for quantification purposes.
SUPPLEMENTARY MATERIAL
The supplementary material for this article can be found at https://doi.org/10.1017/S0885715620000500
DEPOSITED DATA
CIF and/or RAW data files were deposited with ICDD. You may request this data from ICDD at info@icdd.com.
ACKNOWLEDGEMENTS
The authors are thankful to Tamilarasan Subramani and Somanadham Mummadi of Chemical Development and API supply, BBRC for the synthesis of BrettPhos oxide and Roopa Narasimhamurthy and Rudra Sahu of Analytical Research and Development, BBRC for their help with PXRD and HPLC analyses.


