


Social media has given authoritarian governments new opportunities to influence public opinion—both domestically and abroad. Such influence campaigns came to prominence with Russian interference in the US Presidential Election in 2016 (Office of the Director of National Intelligence, 2017). In 2018, Twitter's Elections Integrity Initiative released a public dataset detailing the behavior of thousands of troll accounts from the Kremlin-based Internet Research Agency (IRA). As a result, analysts have shown that IRA accounts used Twitter to overwhelmingly support the Trump campaign over the Clinton campaign (Office of the Director of National Intelligence, 2017; Tucker, Reference Tucker, Guess, Barberá, Vaccari, Siegel, Sanovich, Stukal and Nyhan2018; Linvill, Reference Linvill, Boatwright, Grant and Warren2019). Although new evidence suggests that these IRA activities did not successfully polarize Americans (Bail, Reference Bail, Guay, Maloney, Combs, Hillygus, Merhout, Freelon and Volfovsky2019), trolls posted a wide variety of content in attempts to amplify existing social divisions between liberals and conservatives.
Understanding the range of strategies on Twitter as part of Russian foreign influence is important, yet prior work has focused on explicitly partisan messaging. In contrast, here we describe the use of apolitical content in the 2016 US election, and note its potential use as a strategy for foreign influence. We test the hypothesis that autocratic regimes might use the same techniques in foreign operations that they use in domestic ones. In particular, we consider the technique sometimes called “flooding,” where government-sponsored actors inundate social media communities with innocuous or entertainment content to distract or confuse users (Tucker, Reference Tucker, Theocharis, Roberts and Barberá2017; Roberts, Reference Roberts2018; Sanovich et al., Reference Sanovich, Stukal and Tucker2018; Munger, Reference Munger, Bonneau, Nagler and Tucker2019). Flooding is an important tool in an autocrat's domestic playbook, but here we provide evidence that (often ignored) apolitical content on social media might also be a well-practiced tool for foreign influence. On social media platforms in the US context, it is possible for a very large increase in apolitical content in user feeds to displace and/or distract from more mobilizing content, and, through this, dilute political messaging during an election campaign.
We present descriptive results using a new method of automated text analysis and online crowd-sourcing to identify apolitical content in the Twitter IRA dataset from 2015 until the 2016 election. We show that apolitical content was used asymmetrically across groups—it was commonly used in their artificial liberal community constructed by the IRA trolls (largely tweeting Black Lives Matter related content) and, by election time, rarely used in their artificial conservative community (largely tweeting pro Trump content). Further, we find descriptive evidence for an abrupt change in strategy near the election. Trolls posted large volumes of entertainment and sports content in their liberal community, while simultaneously posting purely political content in their conservative community.
Finally, we compare this possible entertainment “flooding” to more explicit and direct forms of voter suppression, especially tweets encouraging election boycotts or discouraging users to vote. We find that this activity was rare. It is possible that IRA Trolls, fearful that explicit voter suppression tweets would lead to detection and deletion, relied on flooding (and possible displacement of political content) instead. At the same time, the complete IRA troll strategy is difficult to know—it is possible that some behaviors were unintentional and/or not coordinated across agents, for example—and there may be other reasons driving the use of apolitical content, which we note is a fruitful area for future research.
Our contribution is twofold. First, we evaluate whether well-established theories of authoritarian influence over domestic audiences might also apply to foreign interference via social media. While descriptive, our systematic analysis sheds new light on autocratic efforts in exploiting new technology, and highlights the potential importance of autocratic regimes’ accumulated expertise in information campaigns. Second, our results have essential implications for future research on foreign election interference. Prior studies have typically subset the sample of IRA accounts, and only analyzed tweets using specific partisan slogans or keywords. Such research informs us about explicit targeted messaging, but overlooks the potentially strategic use of apolitical content.
Strategic use of apolitical content
Non-democratic regimes typically seek to control their populations’ political activities on social media, often through Internet access restrictions and online censorship.Footnote 1 Recently, autocratic governments are also relying on the use of coordinated, counter-information campaigns. Flooding is one prominent technique in these efforts (Roberts, Reference Roberts2018; Sanovich et al., Reference Sanovich, Stukal and Tucker2018; Munger, Reference Munger, Bonneau, Nagler and Tucker2019). Its use is well known in China, where government-affiliated users have fabricated posts in attempts to shift online discussions away from controversial issues, often using Chinese history and inspirational quotes (King et al., Reference King, Pan and Roberts2017).
But Russia and Venezuela have also used flooding to discourage domestic coordination (Østbø, 2017; Munger, Reference Munger, Bonneau, Nagler and Tucker2019). For example, to demobilize its domestic population in 2014 after the Crimea annexation, Russian pro-regime social media accounts switched from aggressive hate speech against the opposition to posting sad and empathetic content (Østbø, 2017). In Venezuela, Munger (Reference Munger, Bonneau, Nagler and Tucker2019) shows during the anti-Maduro regime protests in 2014, the government purposefully flooded Twitter with apolitical posts that were unrelated to opposition criticism, in addition to their pro-regime cheerleading. While prior work has studied “flooding” by non-democratic regimes on their own populations (see Keremoglu and Weidmann (Reference Keremoglu and Weidmann2020) for a recent review), we contribute by studying how actors may apply this tactic to a foreign population. In particular, we consider the hypothesis that foreign government-sponsored trolls use innocuous or entertainment content in attempts to selectively manipulate levels of attention to politics in the United States. We evaluate whether trolls might flood specific populations on social media with apolitical content, perhaps to distract from and/or displace political content just before an election.
Finally, while we note an alternative use of apolitical content—namely to attract followers—early in the election, we also show asymmetric patterns across liberal and conservative trolls later on, indicating a more complex strategy.
Data and methods
In this research note, we use text scaling and hand labeling to score and categorize apolitical messages by trolls over the course of the campaign. Our analyses focus specifically on identifying and measuring apolitical content that could be used in attempts to distract and demobilize American voting blocs. We describe our data and text scaling method below, while a more extensive description of our methods can be found in the online Appendix. All of our analyses can be easily replicated using publicly available data and to-be-released R code.
Data
Our data comes from three sources: (1) Twitter's own release of a complete dataset of Russian troll tweets and account descriptions (available here: https://transparency.twitter.com/en/information-operations.html), to which we incorporate (2) Linvill and Warren (2020)'s hand labels of accounts (available here: https://github.com/fivethirtyeight/russian-troll-tweets)Footnote 2, and (3) hand-coded labels of tweets we collected through Amazon Mechanical Turk and Figure Eight (labels will be made available in replication materials).
Twitter's Elections Integrity Initiative released their public dataset in late 2018. It initially contained more than 10 million tweets sent by 3841 accounts affiliated with the IRA, a Kremlin-based Russian troll farm. These accounts represent the efforts of human-controlled Russian operators, or “trolls,” as opposed to computer-controlled accounts, or “bots.” The list was compiled by Twitter based on number of factors, including account origin and IP, account activity, and internal review of accounts. These accounts also appear to be relatively coordinated, in that they formed tight clusters of interacting accounts (see Figure A17 in the SI), which may have contributed to both increased influence (the accounts promoted each other) and later discovery. While most likely not the full universe of foreign accounts, this data is the most comprehensive source available to researchers and consists of a set of active and influential IRA accounts that are coded with a reasonable degree of reliability.Footnote 3 This exact dataset is also employed by similar studies on the topic, and so provides a degree of replication across studies.
We link the Twitter data release to Linvill and Warren's 2020 account categories using tweet IDs.Footnote 4 Linvill and Warren (Reference Linvill and Warren2020) use expert hand coding to classify accounts into the following categories, which we adopt (and validate using community detection in the Appendix): Right Troll, Left Troll, News Feed, and Hashtag Gamer. At a high level, right trolls posted right-leaning, populist, and nativist messages as well as about Trump, and left trolls tweeted support of the left, socially liberal values, and Black Lives MatterFootnote 5; we refer to these as conservative and liberal accounts throughout our analysis. Accounts labeled as news feed mimicked local news stations and served as news aggregators, and hashtag gamer accounts promoted various hashtags, both divisive and apolitical.Footnote 6
We analyze tweets in Twitter's official dataset that were posted or retweeted by the troll accountsFootnote 7 before the election on 8 November 2016. We also remove non-English accounts, for example, those using the Russian alphabet. In the main text, we focus our text analysis on troll messaging during the general election, and so present analyses based on tweets posted after 1 January 2016—further analyses are included in the Appendix. For hand-labeled data, we studied tweets posted after the end of the Republican presidential primary (starting our analysis in June 2016), but we also present longer time series based on our hand-coded labels in the online Appendix.
Because prior work has inferred that Russian trolls promoted Republicans over Democrats, and so might have had different messaging goals for Republican-leaning versus Democratic-leaning communities, we analyze two sets of tweets: (1) all tweets, excluding news aggregators, and (2) tweets within liberal and conservative clusters.
Methods
Our ultimate findings rely on analyses of hand-labeled tweets. However, we use automated text analysis to identify the kinds of language that would fit the description of “flooding” previously used by authoritarian regimes. In China, for example, users posted positive comments about Chinese history (King et al., Reference King, Pan and Roberts2017). We do not expect Russian trolls to discuss Chinese history to flood American social media, and so we need some means to determine what topics they might have promoted instead. We first analyzed the text using scaling, and then we repeated those analyses using hand-coded categories. Thanks to insights from the initial text analysis, we can provide coding instructions in clear and simple terms; this practice is also recommended by prior work (Benoit, Reference Benoit, Conway, Lauderdale, Laver and Mikhaylov2016).
Automated text analysis
The method for automated text analysis that we use, called pivoted text scaling (Hobbs, Reference Hobbs2019), is a form of principal component analysis on word co-occurrences. The method is closely related to many standard methods in automated text analysis, including topic models, and it is designed for corpora of short texts in which many documents might contain only common words. The method measures variation in the use of very common words rather than highly specific words to capture particularly broad patterns in (short) texts. We explain the procedure in detail in the online Appendix. In short, PCA is conducted on a standardized and truncated word co-occurrence matrix, and its top dimensions are the vectors that explain the greatest variance in that word co-occurrence matrix. From this, each word is assigned a vector of numbers representing its locations on several dimensions (i.e., a vector of scores), and documents are then scored using the average of their words’ scores. The main difference between this method and a topic model, for our purposes here, is that this text scaling estimates very broad and low-dimensional variation in word usage (e.g., liberal-conservative, political-not political) rather than more high-dimensional and highly clustered word usage (e.g., separate issues like immigration or climate change that might use especially distinct languageFootnote 8).Footnote 9
With the top dimensions of the PCA output (specifically, the top two dimensions explaining the most variation in common word use), we identify two theoretically relevant latent variables to analyze and validate with crowd-sourced hand coding: (1) a partisan dimension, which for example separates the Linvill and Warren conservative accounts from liberal accounts, and (2) a possible “flooding” dimension (or, concretely, a politics versus not politics dimension), in which left-leaning trolls post American entertainment content, such as tweets about popular music.
These latent dimensions can be constructed using addition and subtraction of principal components—although scaling in political science is often used to identify a top partisan dimension, there is no guarantee that a top dimension of an unsupervised scaling will capture a specific latent variable of interest.
The partisan dimension shown in the main text is the 2nd dimension in Appendix Table A5 and the politics versus not politics (flooding) dimension shown in the main text is the 1st dimension plus the 2nd dimension in Appendix Table A6, both of which have the same over-time patterns and qualitatively similar keywords.
Hand label analysis
After identifying relevant topics, we analyze the data using hand-labeled tweets. This analysis of hand-labeled tweets assesses whether we see the same over-time patterns in politics versus entertainment when using human coders to assess tweet content.
It also places our text scaling estimates onto a more interpretable scale—the proportion of documents about politics or entertainment. In this analysis, we report the level of agreement among raters at the tweet level (which is moderate, especially compared to what might be seen for much more concrete labels) to note some subjectivity and likely measurement error in the human labels, but our tests focus on over-time averages in topics of tweeted content. We then incorporate uncertainty in the labels using a linear regression—the labels enter as our dependent variable, and standard errors from linear regressions incorporate measurement error in the dependent variable. However, these estimates can still be biased downwards if we have error in the independent variable (such as in the left versus right troll classification), and if hand coders provide uniform, random responses that do not reflect the prevalence of a label (we use majority labels to combat this possibility).
To collect hand labels, we designed a human coding exercise completed by workers from Amazon Mechanical Turk (hosted on the crowdsourcing platform Figure Eight; see Appendix). We asked human workers to read individual tweets, and sort them into four categories: (i) Politics and Elections, (ii) Social Justice and Race Relations, (iii) Entertainment, and (iv) Unclear/Other. The workers coded a random sample of 900 tweets—450 from right trolls and another 450 from left trolls—and each of these tweets was categorized by three independent individuals.
Tweets were assigned a topic when two out of three coders chose that topic.Footnote 10 This follows recommendations to use multiple coders in crowd-sourced tasks, since this helps reduce noise in the labels provided by online workers (Benoit, Reference Benoit, Conway, Lauderdale, Laver and Mikhaylov2016)—noise which might reflect worker attention and quality rather than features of the text data.Footnote 11
To evaluate systematic agreement for the majority categories assigned by coders (as we'll use in the analysis), we trained a supervised modelFootnote 12 on 50 percent of the hand-labeled data and predicted the remaining labels. Across 1000 replicates, we observe an average intraclass correlation (human versus machine) of 0.65 for entertainment (AUC: 0.89), 0.74 for politics (AUC: 0.92), and 0.58 for social justice and race relations (AUC: 0.86).Footnote 13 More importantly—beyond validating that there is systematic agreement in the human coding for these categories—we also show in the Appendix that our supervised models produce probabilities that match the observed category proportions in hand labels (as recommended by Card and North (Reference Card and North2018)), and that analyses based on hand labels alone do not substantively differ from the supervised ones. With the supervised labels, we track activity over a longer period of time (see Appendix Figures A14 and A15) and more precisely at frequent intervals.
Results
Recruitment and politicization
Our results construct a timeline of text-based strategies used over the course of the campaign to demonstrate the various uses of apolitical content. First, we confirm that apolitical content was used in recruitment, supplementing findings in prior work (Tucker, Reference Tucker, Guess, Barberá, Vaccari, Siegel, Sanovich, Stukal and Nyhan2018; Dawson and Innes, Reference Dawson and Innes2019; Linvill, Reference Linvill, Boatwright, Grant and Warren2019). Based on account categories released by Linvill and Warren (Reference Linvill and Warren2020), along with our validation of those categories using network community detection (see Appendix), we combine the IRA clusters into two main categories: polarized accounts (either liberal or conservative) and ambiguous accounts (no clear ideological messaging), in addition to the local news accounts that primarily tweeted links rather than other users’ content.
Prior work has documented general patterns of troll activity; our analysis confirms the same. For the sake of comparison, Figure A10 in the Appendix plots the number of tweets posted by each cluster from June 2015. Over time, we see a reliance on local news and ambiguous accounts until fall of 2016, at which point there is a significant increase in the activity of polarized accounts. The lower panel of this figure shows that ambiguous accounts mentioned non-trolls at extreme rates in 2015, suggesting a massive effort to contact and/or recruit Americans to follow the troll accounts.
Past studies have generally concluded that IRA troll accounts posted political content, namely propaganda, designed to divide, incite, and agitate viewers on both side of the political spectrum (Bastos and Farkas., Reference Bastos and Farkas2019). They have also observed sharp increases in the tweeting of conservative content in September 2016 (Howard, Reference Howard, Ganesh, Liotsiou, Kelly and Frano¸ois2018). Similarly, the red line in Figure 1 documents a late-campaign surge toward conservative content in our data, and we also see a partisan divide in messaging through much of 2016. Our results also speak to recent work showing distinct differences in hyperlink content sharing among liberal and conservative IRA accounts in the 2016 elections (Golovchenko, Reference Golovchenko, Buntain, Eady, Brown and Tucker2020). Figure A16 in the Appendix shows estimates within account (i.e., centered at account means).
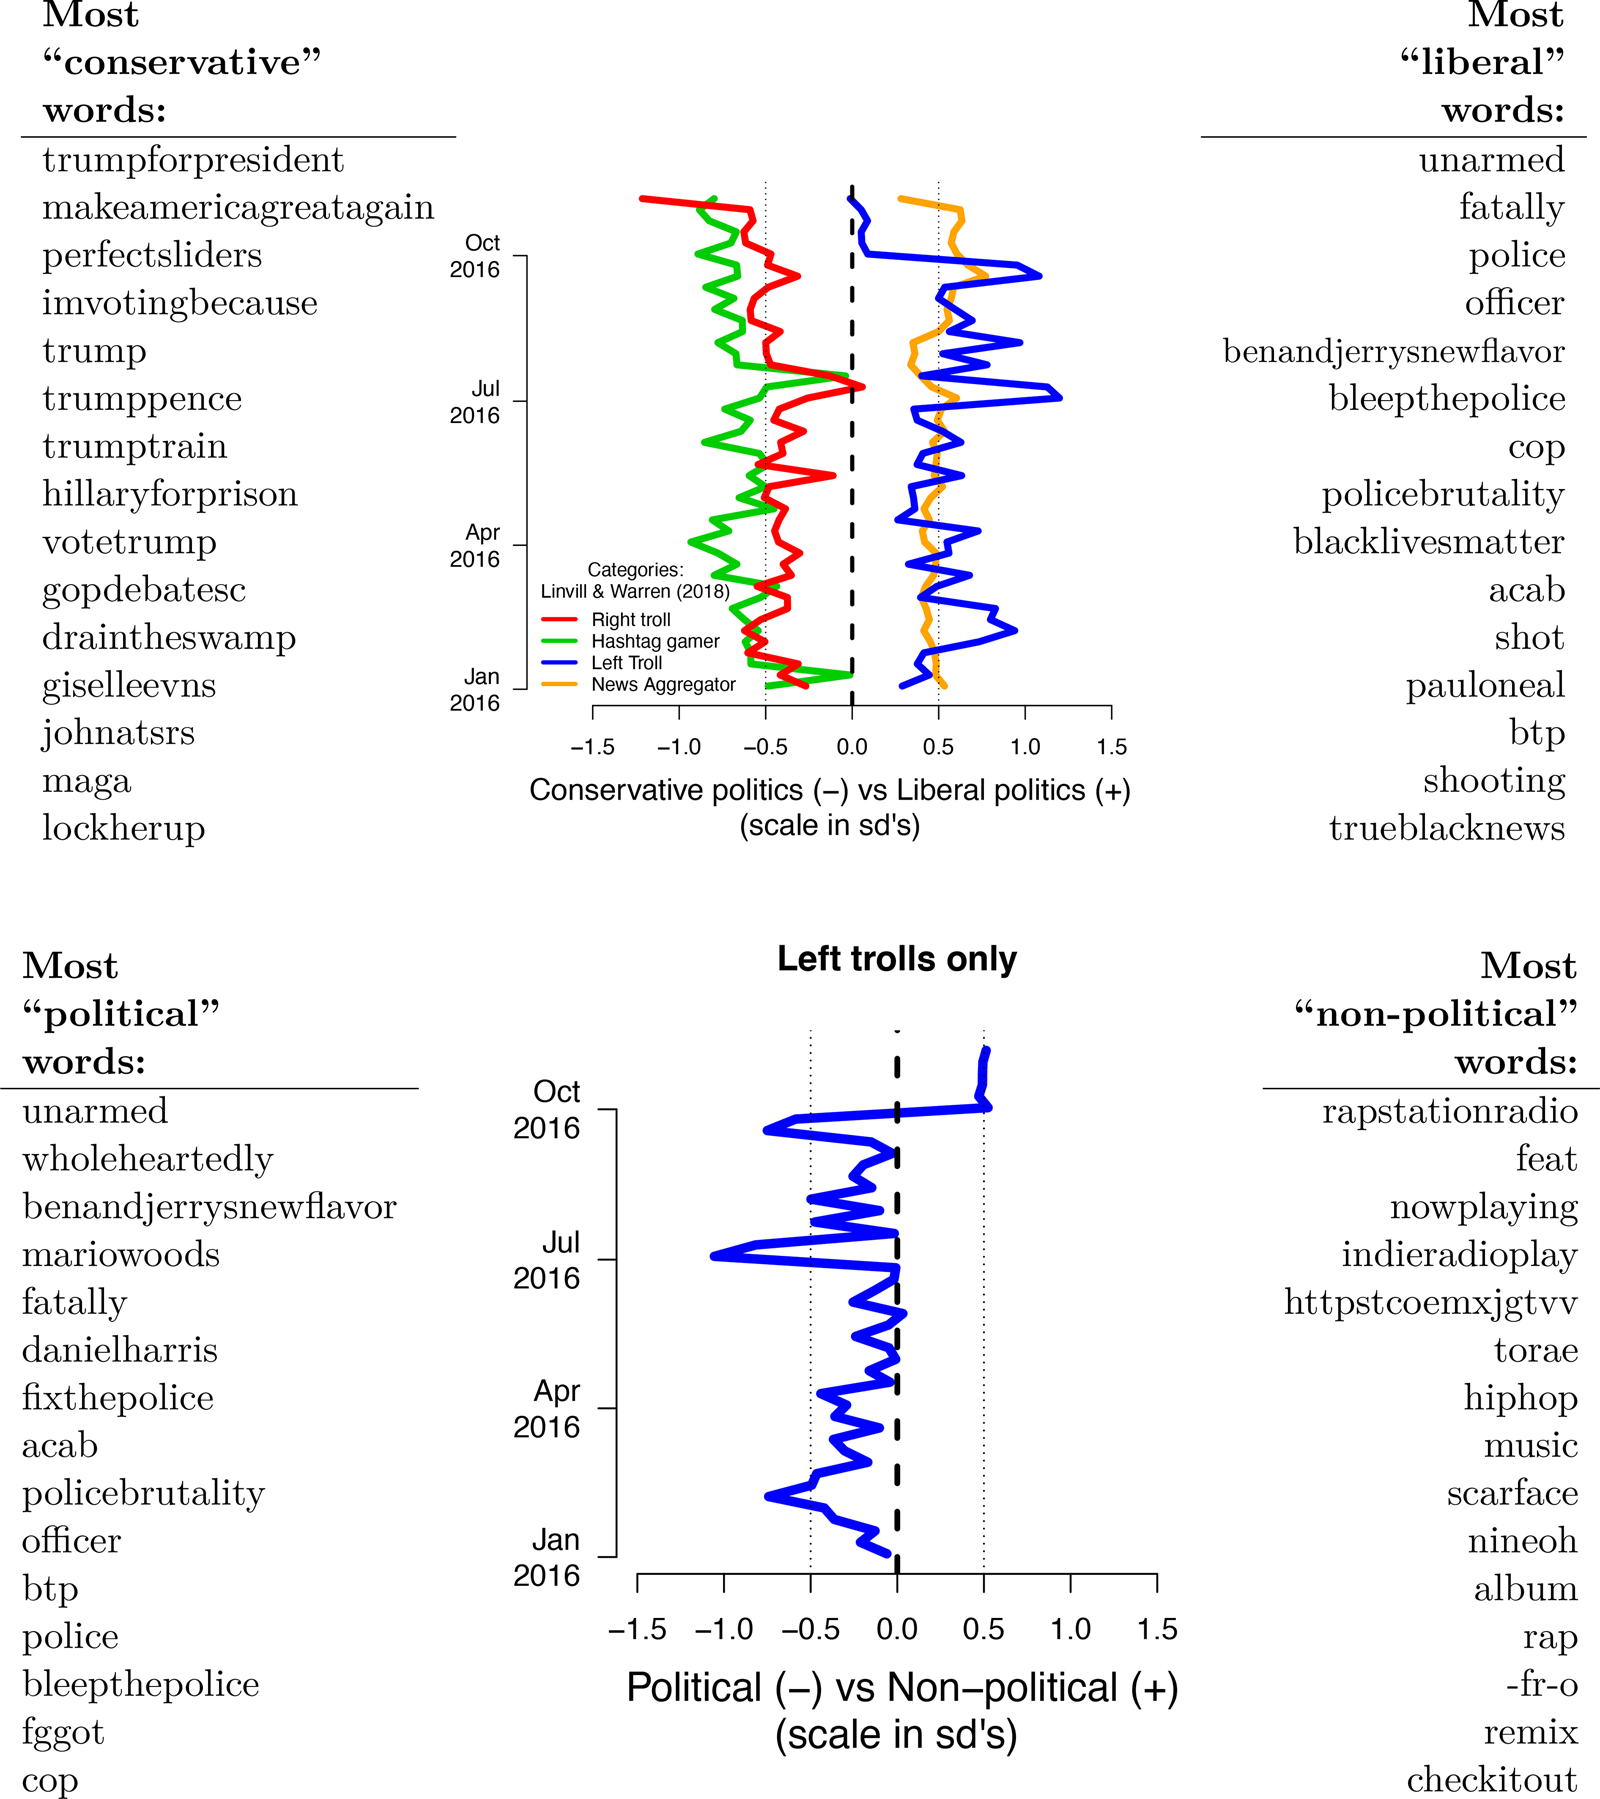
Figure 1. Consistently political conservative content and a shift away from political liberal content. The top panel shows the average text scores on the dimension of the overall text scaling that we labeled the “partisan” dimension (this is the 2nd dimension, opposed to the 1st which captured Twitter hashtags versus mentions). Conservative accounts tweeted consistently right-leaning content during the campaign. The bottom panel displays the top dimensions of the analysis subset to liberal trolls, and shows that liberal imitators instead increased entertainment content relative to social justice and politics close to election time. We use the above dimensions, keywords, and our interpretations of them (in quotes) to create labeling instructions in follow-up human coding.
Selective use of apolitical content
Our results next demonstrate the asymmetric use of apolitical content. The secretive nature of foreign interference makes it difficult to definitely determine the motives behind the specific behavior of IRA troll accounts, who appear to have had goals of both increasing support for Trump as well as sowing partisan divisions (Tucker, Reference Tucker, Guess, Barberá, Vaccari, Siegel, Sanovich, Stukal and Nyhan2018). But we believe we can learn from prior studies that have shown that social media can actively mobilize populations, from pro-democratic protests (Tucker, Reference Tucker, Theocharis, Roberts and Barberá2017) to turning out to vote (Bond, Reference Bond, Fariss, Jones, Kramer, Marlow, Settle and Fowler2012; Fowler, Reference Fowler, Franz, Martin, Peskowitz and Ridout2021), as well as work on flooding in authoritarian regimes, which argue that apolitical content is used as a demobilization strategy (Østbø, 2017; Roberts, Reference Roberts2018; Sanovich et al., Reference Sanovich, Stukal and Tucker2018; Munger, Reference Munger, Bonneau, Nagler and Tucker2019).
In this light, we consider evidence for a possible strategy using apolitical content—for demobilization, or perhaps distraction from and displacement of political content—focusing on the #BlackLivesMatter campaign. The IRA attempted to capitalize on racial and partisan divides surrounding the campaign by posting BLM content on Twitter, Facebook, Youtube, and Instagram, among others (Howard, Reference Howard, Ganesh, Liotsiou, Kelly and Frano¸ois2018). We show that this entertainment “flooding” content was more common in the trolls’ artificial liberal community, and that these accounts switched further to entertainment content near the 2016 election. In contrast, during this switch, the trolls’ conservative community posted consistently political content.
The blue line in the top panel of Figure 1 demonstrates that while left-leaning accounts were actively tweeting about BLM content in the summer and early fall of 2016, they were, as a fraction of all content, less likely to tweet such content near the end of the campaign. Because this shift could be explained by an increase in 2016 election content without a corresponding shift toward apolitical content, the bottom panel of Figure 1 explores this in further detail by examining left troll IRA accounts only. Here, it is clear these accounts switched to using apolitical content (talking about music and videos) instead of political or divisive content. This “flooding” may have been used to distract, demobilize, or displace political content, though we can not distinguish among these motivations or the actual effects of posts with the data available. But these patterns demonstrate a clear and asymmetric use of apolitical content.
Hand label analysis
We validate these results by analyzing average labels in hand-labeled tweets. This analysis is important because it evaluates whether human raters who have read the tweets are, in aggregate, able to perceive (1) a difference in average levels of political content across left and right trolls, and (2) a decline in political content, in that we can see a substantial decline in the averages of their political labels.
In Table 1, we show linear regressions for changes in political content among left trolls and right trolls. This analysis is limited to the random sample of tweets for which we collected hand labels, and, given that the labels enter as our dependent variable, the confidence intervals in this regression account for measurement error in the labels. We also measure our dependent variable in two ways: first, the fraction of labels that were either politics or social justice, and second, an indicator variable (0/1) if the majority of coders labeled a tweet as being about “politics” or a majority labeled it about “social justice/race relations.”
Table 1. Decline in political content among left trolls (linear regression on hand labels)
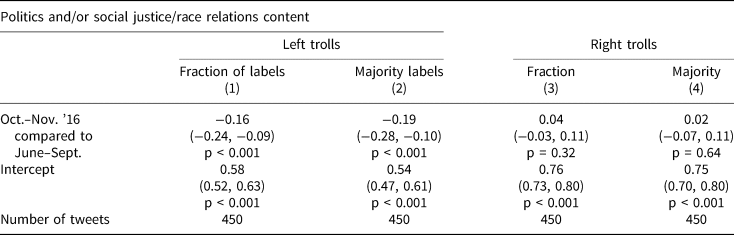
This table displays linear regressions estimating changes in averages of tweets that were labeled as “politics” or “social justice/race relations,” comparing the months October and November 2016 to June through September 2016 (the full time span of hand-labeled tweets). We display multiple models. The dependent variable in the “fraction of labels” columns is the fraction of labels that were either politics or social justice. The “majority” columns are indicators for either a majority of coders labeling a tweet as being about “politics” or a majority labeling it about “social justice/race relations.”
Overall, the table shows that there was a statistically significant decline in political content only among the left trolls (− 0.19 percentage points, 95 percent CI −0.28 to −0.10) for tweets with 2 out of 3 labels (listing politics or social justice/race relations). This effect represents an approximately 30 percent decline in political content compared to tweets from June through September. Note that this result is no different if we instead use the “entertainment” label as the dependent variable.
Figure 2 below, as well as Figures A5 and A6 in the Appendix, present this result in more detail, focusing on the 2 out of 3 hand label averages by month, as well as the averaged predicted probabilities (from the supervised model) by week. They show the same over-time patterns as the pivoted text scaling, which are all consistent with distraction-based messaging. We can further see that the artificial liberal community was less likely to discuss politics or social justice than the artificial conservative community, even before the late campaign shift away from political discussion (Figure A16 in the Appendix shows this shift within accounts). Finally, the top-right of Figure 2 shows a spike in number of tweets both right troll and left troll content in the month or two preceding the 2016 election. Right trolls maintained political content during a spike in content, while left trolls shifted toward entertainment content. We do not have an interpretation for the different timings of these spikes.
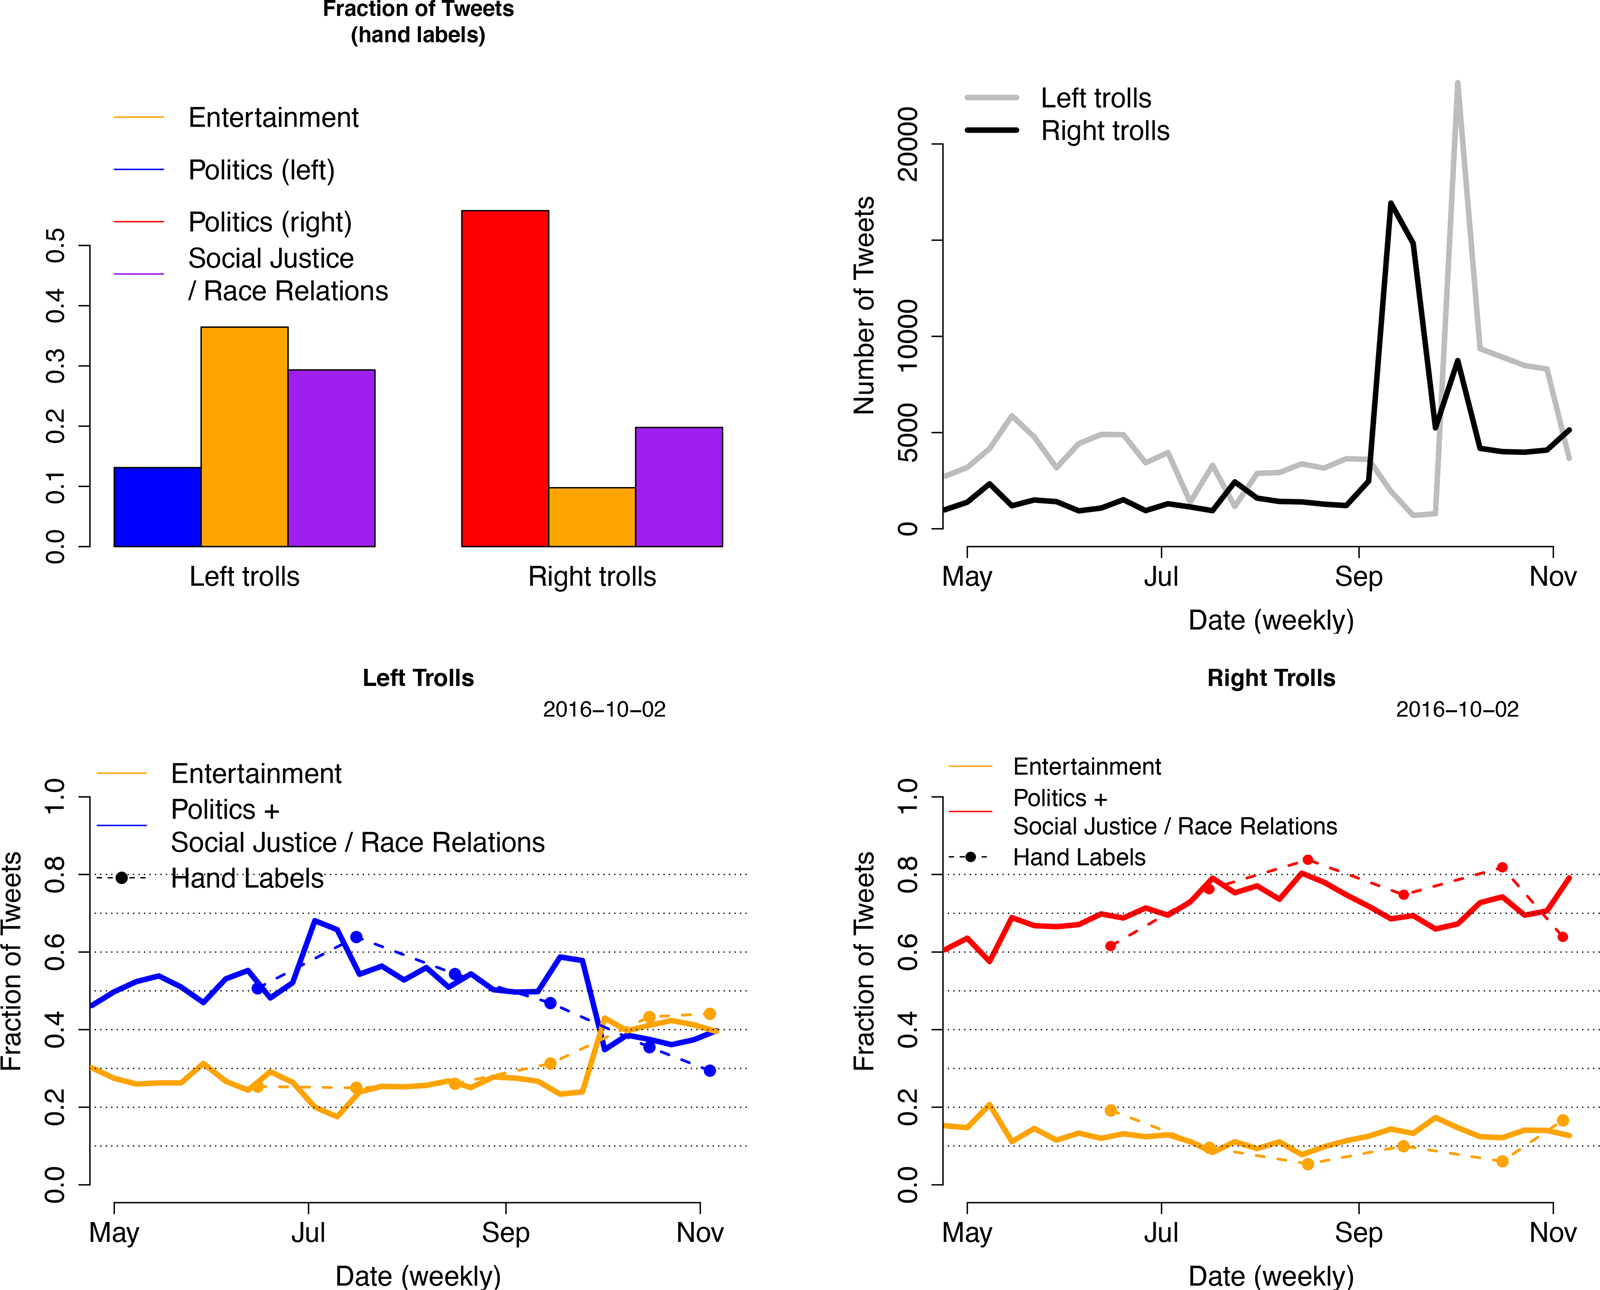
Figure 2. Hand-labeled results. Top-left panel shows the proportion of tweets per topic from a sample of hand-coded tweets, and bottom row shows the results from applying a supervised model to label the full corpus. Top-right panel shows the number of tweets from left and right trolls. Note that right trolls did not change content when increasing posting frequency.
Explicitly demobilizing language
We can also use this same data to look at an explicit strategy to demobilize, which would involve tweets that actively discourage users to participate in the election (“boycott the election,” or “do not vote”). In contrast to flooding, this is perhaps the most transparent and direct form of demobilization. The existence of voter suppression tweets has been documented (Howard, Reference Howard, Ganesh, Liotsiou, Kelly and Frano¸ois2018), but studies have not focused on their usage over time. We explore to what extent the IRA used a strategy of direct voter suppression, by looking for mentions of voting keywords (such as “vote,” “voting,” “election,” “support”) as well as negation phrases (such as “not,” “n't,” “boycott,” “sit out,” “truth,” “rigged,” “before,” “illegal”). The additional negation words cover phrases identified by prior studies (DiResta, Reference DiResta, Shaffer, Ruppel, Sullivan, Matney, Fox, Albright and Johnson2018; Howard, Reference Howard, Ganesh, Liotsiou, Kelly and Frano¸ois2018; Kim, Reference Kim2018), as examples of demobilization from suppression (for more discussion, see Appendix).
In Figure 3, we show that overall voter suppression tweets are rare, especially compared to entertainment content. In addition, trolls on the left rarely discussed voting at all (positively or negatively) compared to right-leaning trolls. Yet the lack of direct voter suppression tweets may explain the high volume of apolitical flooding—this could potentially be driven by policing on the platform. We know Russian IRA accounts spent time and effort to adopt American personas and develop followers (Dawson and Innes, Reference Dawson and Innes2019; Schafer, Reference Schafer2018); troll accounts that feared detection and deletion by Twitter may be less likely to engage in direct and obvious voter suppression.
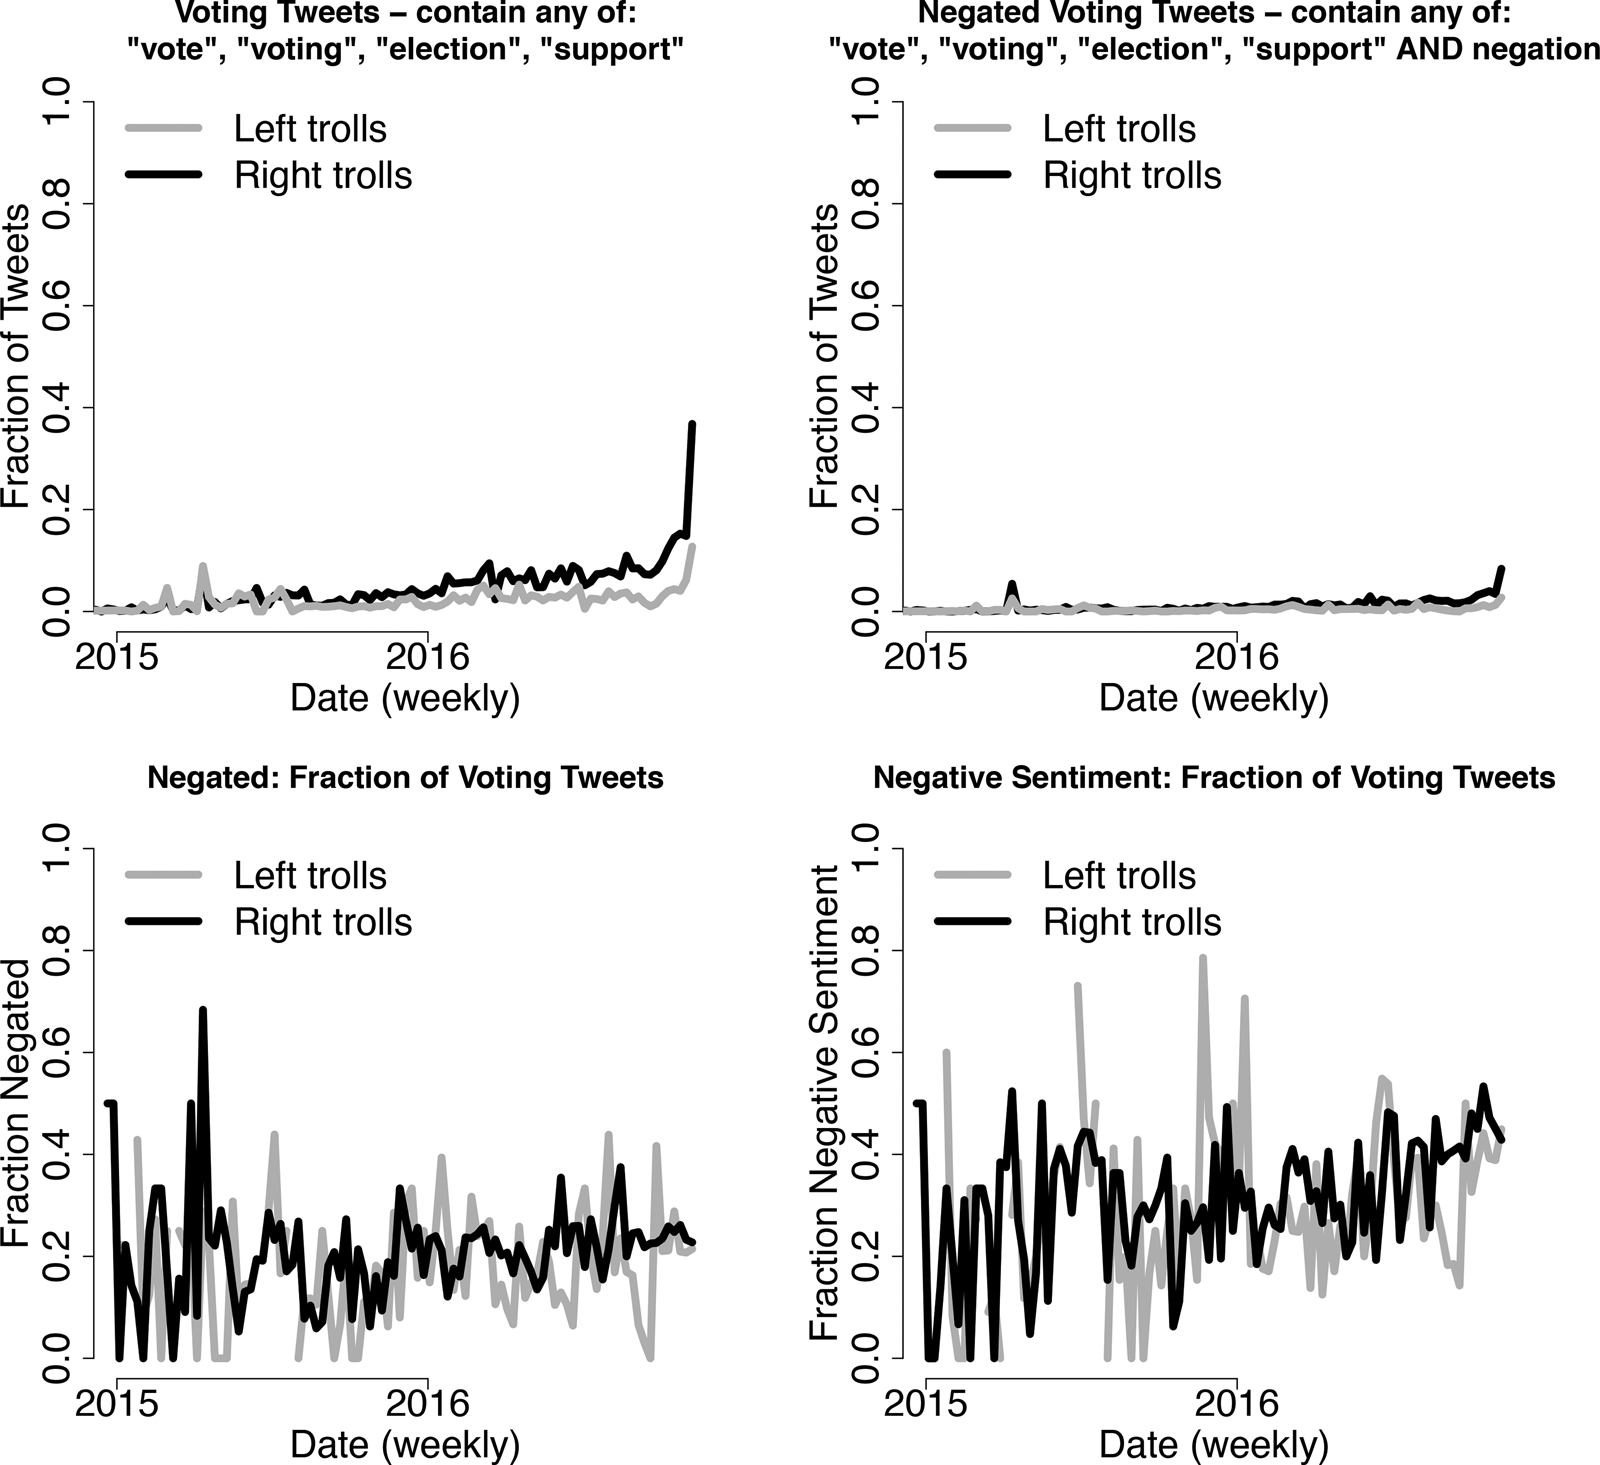
Figure 3. Voting and voter suppression. This figure shows that the right trolls mentioned “vote,” “election,” “support” in around 35 percent of tweets in the week leading up to the election, while the left trolls tweeted these words in slightly over 10 percent of tweets. Left trolls were not more likely to negate or use negative sentiment (here, the fraction of tweets with average AFINN scores (Nielsen, Reference Nielsen2011) less than 0) in their tweets about voting.
This again highlights an important comparative consideration for research on foreign influence compared to work on domestic authoritarian flooding. In authoritarian regimes, the state has tight control over the media market; in contrast, the US social media environment is a competitive market where numerous actors compete for the attention of users. Even if the goal was to polarize American citizens, IRA accounts needed to both attract and influence users without immediate detection and removal.
Conclusion
When the Twitter IRA data was first released in 2018, one puzzling finding was that much of the content posted by Russian trolls was seemingly apolitical—“camouflage” tweets with no clear connection to an IRA agenda, or social content such as recipes or celebrity gossip (Linvill, Reference Linvill, Boatwright, Grant and Warren2019)—and potentially designed to attract followers (Tucker, Reference Tucker, Guess, Barberá, Vaccari, Siegel, Sanovich, Stukal and Nyhan2018). We consider here whether apolitical content might also be a strategy for foreign interference, and use our data to document previously overlooked patterns of IRA troll behavior. Thus one of our contributions is methodological—past research has studied the tweets of IRA trolls by focusing explicitly on divisive content, and subsetting data samples using specific political or partisan keywords. In doing so, scholars could be omitting any consideration of apolitical content, which might form part of a foreign agent's strategy.
We also contribute to the literature by testing autocratic theories of social media “flooding” (Østbø, 2017; Roberts, Reference Roberts2018; Sanovich et al., Reference Sanovich, Stukal and Tucker2018; Munger, Reference Munger, Bonneau, Nagler and Tucker2019) as an example of foreign interference in the US election. We find that while right-leaning and moderate trolls distributed political content to followers in support of Donald Trump, left-leaning trolls were more likely to use apolitical messaging toward liberal constituents, especially close to the election. In contrast with past work, our results suggest that direct efforts to demobilize, such as mentions of difficulty voting or opposition to Hillary Clinton, might have been secondary to indirect efforts to distract.
We hope these descriptive analyses lay the ground for future research. Going forward, the results demonstrate the need for scholars and policymakers to not only focus on active, divisive messaging in foreign election interference, but to consider the broader set of tools used by authoritarian regimes in their domestic and foreign influence campaigns.
Supplementary material
The supplementary material for this article can be found at https://doi.org/10.1017/psrm.2022.9. To obtain replication material for this article, please visit https://doi.org/10.7910/DVN/PH1AQ4.
Acknowledgments
We are grateful to Nicholas Beauchamp, Nir Grinberg, Molly Roberts, and participants at the PolMeth conference, for valuable comments and suggestions


 Open access