


Introduction
Baird's tapir Tapirus bairdii is one of the last representatives of the megafauna that survived Pleistocene extinctions and is considered a living fossil because of its unique morphological and behavioural characteristics, which resemble those of primitive ungulates (Janis, Reference Janis, Eldredge and Stanley1984). Tapirs are the largest native terrestrial mammals inhabiting the Neotropics (Naranjo, Reference Naranjo2009), and because of their size and feeding habits they provide important ecosystem services as seed dispersers and seed predators and help shape forest succession via their selective browsing of seedlings (O'Farrill et al., Reference O'Farrill, Galetti and Campos-Arceiz2013).
Historically, Baird's tapir ranged from south-east Mexico to north-west Colombia (García et al., Reference García, Jordan, O'Farril, Poot, Meyer and Estrada2016). It is now restricted to areas with large remnants of tropical forest (Schank et al., Reference Schank, Cove, Kelly, Mendoza, O'Farrill and Reyna-Hurtado2017). Populations are declining because of poaching, droughts and habitat loss caused by land-use change, and logging and fires (García et al., Reference García, Jordan, O'Farril, Poot, Meyer and Estrada2016). However, the extent of this decline is not well known because there is no reliable information on population density and size across most of the species’ range (Naranjo, Reference Naranjo2009; Mejía-Correa et al., Reference Mejía-Correa, Diaz-Martinez and Molina2010; González-Maya et al., Reference González-Maya, Schipper, Polidoro, Hoepker, Zarrate-Charry and Belant2012; Carbajal-Borges et al., Reference Carbajal-Borges, Godínez-Gómez and Mendoza2014; Lavariega-Nolasco et al., Reference Lavariega-Nolasco, Briones-Salas, Mazas-Teodocio and Durán-Medina, E2016; Botello et al., Reference Botello, Romero-Calderón, Sánchez-Hernández, Hernández, López-Villegas and Sánchez-Cordero2017). With an estimated global total of c. 3,000 adults, Baird's tapir is categorized as Endangered on the IUCN Red List, (García et al., Reference García, Jordan, O'Farril, Poot, Meyer and Estrada2016), although variations in estimates (Naranjo, Reference Naranjo2009; García et al., Reference García, Jordan, O'Farril, Poot, Meyer and Estrada2016; Schank et al., Reference Schank, Cove, Kelly, Mendoza, O'Farrill and Reyna-Hurtado2017) reflect uncertainty about the size of the population.
For estimating population and distribution parameters, including for elusive and unmarked species, camera trapping combined with density models is considered a robust tool (O'Connell et al., Reference O'Connell, Nichols and Karanth2011). Three types of models have been developed. (1) The spatial capture–recapture model incorporates capture history information along with spatial information on where individuals were recorded (Efford et al., Reference Efford, Borchers, Byrom, Thomson, Cooch and Conroy2009; Royle et al., Reference Royle, Chandler, Sollmann and Gardner2014). This model requires individual identification, which is problematic for species lacking individually identifiable markings (Rich et al., Reference Rich, Kelly, Sollmann, Noss, Maffei and Arispe2014). (2) Spatial mark–resight is a variation of the spatial mark–recapture model using individual encounter histories for animals that are marked and accumulated counts for unmarked individuals (Sollmann et al., Reference Sollmann, Gardner, Chandler, Shindle, Onorato, Royle and O'Connell2013; Rich et al., Reference Rich, Kelly, Sollmann, Noss, Maffei and Arispe2014; Royle et al., Reference Royle, Chandler, Sollmann and Gardner2014). (3) The random encounter model is an adaptation of gas collision theory, facilitating estimates of density without requiring identification of individuals, using the speed of movement of animals and sensor detection parameters of camera traps (Rowcliffe et al., Reference Rowcliffe, Field, Turvey and Carbone2008). These three types of model have been tested independently on a range of species (Sollmann et al., Reference Sollmann, Gardner, Chandler, Shindle, Onorato, Royle and O'Connell2013; Cusack et al., Reference Cusack, Swanson, Coulson, Packer, Carbone and Dickman2015) but only a few studies have compared the effectiveness and applicability of these methodologies on the same population, especially for species that lack natural markings (Noss et al., Reference Noss, Gardner, Maffei, Cuéllar, Montaño and Romero-Muñoz2012; Zero et al., Reference Zero, Sundaresan, O'Brien and Kinnaird2013; Anile et al., Reference Anile, Ragni, Randi, Mattucci and Rovero2014; Rich et al., Reference Rich, Kelly, Sollmann, Noss, Maffei and Arispe2014; Kane et al., Reference Kane, Morin and Kelly2015).
A related technique, occupancy models, have been widely used to make inferences regarding the factors influencing the distribution patterns of species (MacKenzie et al., Reference MacKenzie, Nichols, Royle, Pollock, Bailey and Hines2006), estimating the probability that a species occurs in a particular area (ψ) and its probability of detection (p), based on detection/non-detection histories obtained from repeat sampling (MacKenzie et al., Reference MacKenzie, Nichols, Royle, Pollock, Bailey and Hines2006). The modelling of ψ against covariates facilitates evaluation of which landscape variables are most strongly associated with a species’ occupancy, and thus can be used to investigate species habitat preferences and create maps of potential distribution, to prioritize management and conservation efforts.
Here, we estimate the population size of Baird's tapir in the Sierra Madre de Chiapas using data from camera traps. We first compared the performance of the three density estimation models, and then used occupancy modelling to extrapolate density to areas with the highest probability of occurrence of the species and thus estimated the species’ population in the Sierra Madre de Chiapas. Using these findings, we propose measures for the conservation of Baird's tapir in this region.
Study area
The Sierra Madre de Chiapas in southern Mexico is a rugged mountain range of c. 5,500 km2 at 200–2,900 m (CEIEG, 2010). It includes four protected areas: a State Reserve (Pico el Loro-Paxtal, 613 km2), and three federal protected areas (the Biosphere Reserves El Triunfo, 1,191 km2, and La Sepultura, 1,673 km2; and the Natural Resources Protected Area La Frailescana, 1,775 km2; Fig. 1). The landscape is a heterogeneous mosaic, with private and communal lands surrounding the protected areas. Land is used mainly for crop and livestock production, expansion of which continues to drive the agricultural frontier into forested areas. This habitat conversion, along with subsistence hunting and fires, are the main threats to wildlife in the region, especially for tapirs and other large mammals (Naranjo, Reference Naranjo2009).
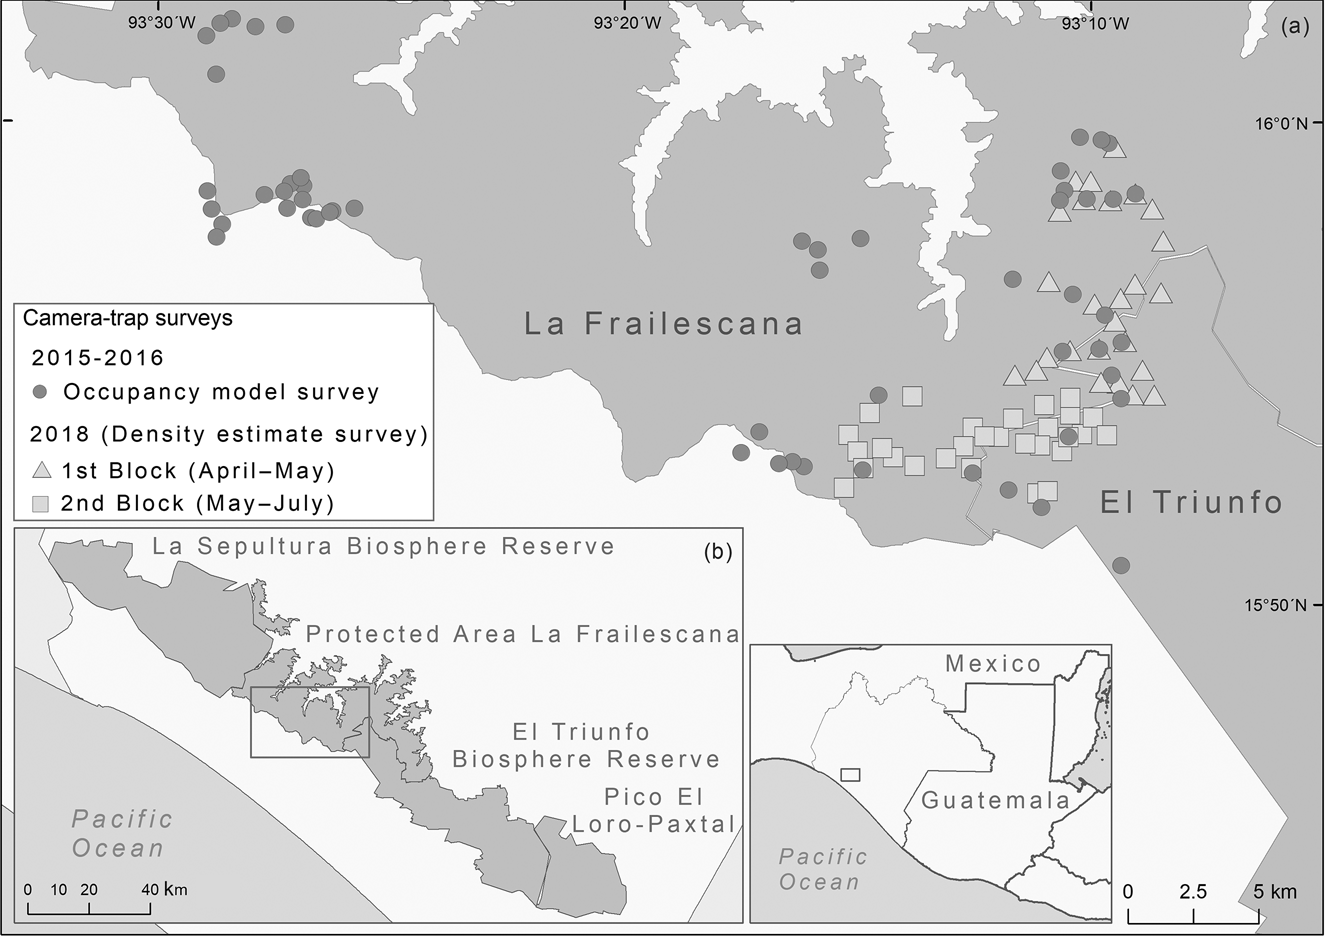
Fig. 1 (a) Camera-trap stations used in 2015–2016 and 2018 in the Natural Resources Protected Area La Frailescana in the Sierra Madre de Chiapas, Mexico for Baird's tapir Tapirus bairdii. (b) The Sierra Madre de Chiapas, showing the four protected areas.
Methods
Density
We conducted a camera-trap survey in La Frailescana during April–July 2018, with a total of 58 camera-trap stations (48 with two cameras and 10 with single cameras). Camera-trap stations where in two contiguous blocks of 29 camera-trap stations each, over a total area of 70 km2 (Fig. 1). The first block was active during April–May 2018 and the second block during May–July 2018. Sampling effort was 2,975 camera-days and stations were active 53 ± SE 2 days to ensure demographic closure. Stations were a mean distance of 813 ± SE 227 m apart, and installed c. 50 cm above the ground.
We calculated tapir density estimates using spatial capture–recapture, spatial mark–resight, and the random encounter models. Spatial capture–recapture models consider that each individual of the population has an activity center (s) around which the movements of that individual are concentrated. This model estimates density by modeling the number and location of the individuals' activity centers si within the space state S. Therefore, encounter probability is modeled as a function of the distance between camera traps and the individual activity center. The model requires that all photographed individuals be identified. All tapir photographs obtained from the camera-trap survey were analysed to identify tapir individuals from unique marks such as spots, scars, notches on the ears, body structure and sex (González-Maya et al., Reference González-Maya, Schipper, Polidoro, Hoepker, Zarrate-Charry and Belant2012). Tapir images that could not be assigned to an individual were discarded for the spatial capture–recapture analysis, but were included as unmarked individuals for the spatial mark–resight analysis. To improve the accuracy of individual identification, we used the methodology of Foster & Harmsen (Reference Foster and Harmsen2012), in which two researchers independently classified all tapir individuals and then compared results to reach a consensus.
We analysed our data with a maximum-likelihood spatial capture–recapture model (Efford et al., Reference Efford, Borchers, Byrom, Thomson, Cooch and Conroy2009) using the package secr 3.2.0 (Efford, Reference Efford2020) in R 3.5.1 (R Core Team, 2018). We defined our state-space as the size of the camera array polygon plus a buffer of 2.3 km; this distance was chosen based on the theory that the buffer should be wide enough to have zero probability that animals present at the edge appear in our sample (Efford et al., Reference Efford, Borchers, Byrom, Thomson, Cooch and Conroy2009). Spatial capture–recapture models allow for variation in parameters related to the detection probability, but for the purposes of this study we assumed that detection probabilities were the same. We fitted the model using a half-normal detection function with a Poisson distribution (Efford, Reference Efford2020). We used the same parameter values for the spatial mark–resight model, to facilitate comparison.
We implemented the spatial mark–resight model by using encounter history data from marked individuals and counts of unmarked individuals. In this model, sampling events are either marking or sighting occasions (Efford, Reference Efford2020). We used the sighting-only model with the number of marked animals at the time of sampling unknown, using function addSightings and the attributes markocc and Tu in secr. We used the same buffer size and input files as for the spatial capture–recapture models but with an additional capture history data set, which included counts of unmarked animals in binary form (1/0). For the counts dataset, images where only parts of the individual were visible were discarded and we did not use temporary marks such as dermal parasites or physical condition, to avoid misidentification of marked and unmarked individuals. We used the half-normal detection function to fit the model. Because of the overdispersion of the counts, we re-fitted the model using an overdispersion-adjusted pseudo-likelihood (Efford, Reference Efford2020).
The random encounter model (Rowcliffe et al., Reference Rowcliffe, Field, Turvey and Carbone2008) uses information from the camera-trap detection zone, and the species’ encounter rate and speed of movement. This model estimates density (D) using:
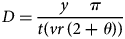 $$D = \displaystyle{{y\,\,\,\,\,\,\,\pi } \over {t( vr\,( 2 + \theta ) ) }}$$
where y = number of independent tapir detections, t = survey effort (in days), v = speed of movement (km/day), r = radial distance to the animal (in m), and θ = zone of detection (in radians).
We defined independent detections as photographs of Baird's tapir separated by at least 24 h (Lavariega-Nolasco et al., Reference Lavariega-Nolasco, Briones-Salas, Mazas-Teodocio and Durán-Medina, E2016). Ideally, v is estimated at the same time and place as the camera-trap survey (Rowcliffe et al., Reference Rowcliffe, Field, Turvey and Carbone2008). However, as speed of movement data were not available for Baird's tapir at the study site, we used data for Baird's tapir in Indio Maíz, Nicaragua (Jordan et al., Reference Jordan, Hoover, Dans, Schank, Miller, Reyna-Hurtado and Chapman2019), for Tapirus pinchaque in the Central Andes, Colombia (Lizcano & Cavelier, Reference Lizcano and Cavelier2004), and for Tapirus terrestris in Madre de Dios, Peru (Tobler, Reference Tobler2008). Based on the mean speed of the three species and on expert judgment (M. Tobler, pers. comm., 2018), we used 6 km/day for v. Detection zone parameters, r and θ, were calculated by performing measurements for each camera trap. We ran the random encounter model using 10,000 bootstraps in camtools 1.0 for R (Rowcliffe, Reference Rowcliffe2019).
For each density estimate, we calculated the coefficient of variation as a measure of precision (White et al., Reference White, Anderson, Burnham and Otis1982). We compared the three models using the 95% confidence intervals, considering estimates to be significantly different if the confidence intervals did not overlap.
Occupancy
We used likelihood-based occupancy modelling to identify variables that best explain occupancy and detectability in the Sierra Madre de Chiapas. We used the framework and camera-trap data of de la Torre et al. (Reference de la Torre, Rivero, Camacho and Álvarez-Márquez2018), also from Sierra Madre de Chiapas, as these data were from a greater number of sites. Camera trapping took place during August 2015–December 2016, with 55 camera-trap stations over 400 km2 in La Frailescana (Fig. 1). Sampling effort was 9,274 trap-days and stations were active from 34 days to 15 months.
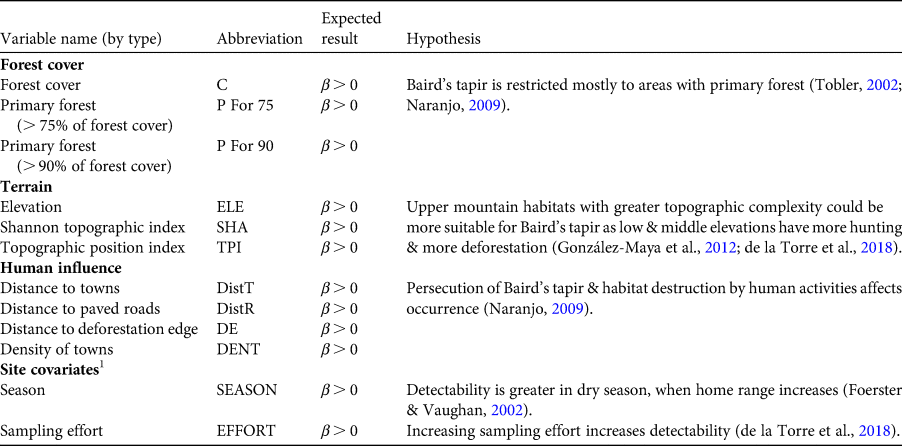
We compiled 12 covariates to model occupancy and detection probabilities for Baird's tapir (Table 1). We generated raster layers with pixels of 30 × 30 m resolution and used circular moving window radii of 30, 90, 240, 510, and 1,020 m to evaluate the most informative scale for analysis. We developed detection/non-detection histories based on photographic records, using 15-day sampling periods to increase detection probability as Baird's tapir can move its home range every 10–12 days (Jordan, Reference Jordan2015). We extracted values of each covariate from the location of the camera trap and rescaled them using the mean value for each covariate divided by the standard deviation. We compared all variables with a Pearson test for multicollinearity and we did not include in the same model variables correlated at > 0.6.
Table 1 The 12 covariates used to model occurrence (ψ) and detectability (p) of Baird's tapir Tapirus bairdii in the Sierra Madre de Chiapas, Mexico.
1 Only for modelling detectability.
Detection and occupancy probabilities were estimated on 35 sampling occasions following a single season model, assuming a closed population and constant tapir occupancy throughout the sampling period (MacKenzie et al., Reference MacKenzie, Nichols, Royle, Pollock, Bailey and Hines2006). We fitted occupancy models in the package Unmarked 3.1.1 for R (Fiske et al., Reference Fiske, Chandler, Miller, Royle, Kery, Hostetler and Hutchinson2011), using the logit link function and 2,000 bootstraps to assess the adjustment fit (P). We compared models using Akaike information criterion (AIC) scores and weights, and we only considered models with ΔAIC ≤ 2 (Burnham & Anderson, Reference Burnham and Anderson2004).
We evaluated the accuracy of our best candidate model by calculating the area under the receiver operator characteristic (ROC) curve, which is obtained by plotting sensitivity (number of true positive predictions) vs 1 − specificity (number of false positives; Manel et al., Reference Manel, Williams and Ormerod2001). This measures the model's ability to correctly determine which locations are occupied. Usually, values of ≤ 0.5 indicate that the model performs no better than random. Values > 0.5 indicate progressively better discrimination (Manel et al., Reference Manel, Williams and Ormerod2001). We also determined the optimal threshold value with 95% confidence intervals for categorizing continuous occupancy values as potential habitat and non-habitat (Liu et al., Reference Liu, Berry, Dawson and Pearson2005). To have a more robust estimate of the potential habitat for the species in the region, we defined occupancy probabilities greater than the upper confidence interval of the optimal threshold value as potential habitat, and areas below the upper confidence interval of the optimal threshold value as non-habitat. We used the R package pROC (Robin et al., Reference Robin, Turck, Hainard, Tiberti, Lisacek and Sanchez2011), and a database of 58 Baird's tapir records from the region (observations of footprints and scats; CONABIO, 2020), and generated 800 random points as pseudo-presences for the analysis.
To calculate tapir occupancy probability in each cell of 30 × 30 m, we used the inverse logit function, applying the information of the best occupancy model in the Raster Calculator tool of ArcGIS 10.2 (Esri, Redlands, USA). We used forest cover > 75% as a data mask to extract values of the occupancy raster. We grouped occupancy probability values into three categories: (1) low occupancy: from the upper confidence interval of the optimal threshold value to 0.59; (2) medium occupancy: 0.6–0.89; and (3) high occupancy: 0.9–1.0. We converted the raster into polygons and calculated the surface area of each classification. To estimate the population size of Baird's tapir in the Sierra Madre de Chiapas, we extrapolated density estimates using the mean density of each model and extrapolated to each interval.
Results
Density
We obtained 426 photographs of Baird's tapir. Of these, 38 were independent records, separated by more than 24 h, with a capture rate of 1.3 photographs/100 camera days. We identified eight adult individuals and there were nine independent records that could not be assigned to an identified individual. The estimated density was 8 individuals/100 km2 (95% CI 4–16) with the spatial capture–recapture model, 10 individuals/100 km2 (95% CI 8–14) with the spatial mark–resight model, and 26 individuals/100 km2 (95% CI 13–42) with the random encounter model. Spatial mark–resight had the lowest coefficient of variation, indicating a better precision compared to the other models (Table 2).
Table 2 Summaries of the spatial capture–recapture, spatial mark–resight and random encounter models for estimating the density of Baird's tapir using data from camera trapping in the Sierra Madre de Chiapas during April–July 2018.
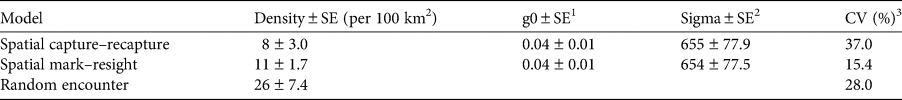
1 Magnitude of detection function.
2 Spatial scale of detection function (m).
3 Coefficient of variation calculated as SE[D]/D × 100.
Occupancy
The data of de la Torre et al. (Reference de la Torre, Rivero, Camacho and Álvarez-Márquez2018) contained 154 independent records of Baird's tapir. The species was detected at 25 of the 55 sampling sites, giving a naïve occupancy estimate of 0.45. The best model (i.e. with the lowest ΔAIC; Table 3) suggested that tapir occupancy increased with elevation (ELE1020 β 0.99, 95% CI 0.16–2.1) and greater topographic heterogeneity (SHA240 β 2.78, 95% CI 0.99–5.2). Detection probability also increased at higher elevations (ELE90 β 0.53, 95% CI 0.19–0.88), at greater distances from deforested patches (DE90 β 0.56, 95% CI 0.23–0.89) and when sampling effort was greater (EFFORT β 0.16, 95% CI 0.07–0.26). Our results suggest that Baird's tapir is associated with higher elevations and rugged terrain, landscapes that are found in the most remote areas of the Sierra Madre de Chiapas, where human presence is scarce or limited (for more details, see de la Torre et al., Reference de la Torre, Rivero, Camacho and Álvarez-Márquez2018). The area under the ROC curve for our best occupancy model was 0.79 (95% CI 0.75–0.84), meaning that it can be considered to have good discriminatory ability (Pearce & Ferrier, Reference Pearce and Ferrier2000). The model correctly predicted occupied sites (sensitivity 0.83, 95% CI 0.72–0.97) better than unoccupied sites (specificity 0.69, 95% CI 0.52–0.78). The optimum threshold value to discriminate Baird's tapir habitat from non-habitat was 0.02 (95% CI 0.01–0.2).
Table 3 Occupancy (ψ) and detection (p) models for Baird's tapir, based on data from camera trapping in the Sierra Madre de Chiapas during August 2015–December 2016 (de la Torre et al., Reference de la Torre, Rivero, Camacho and Álvarez-Márquez2018).
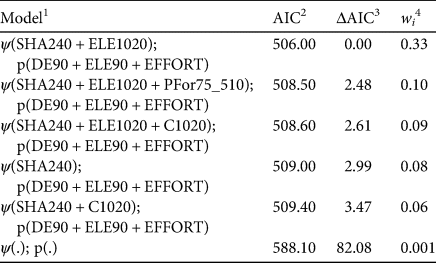
1 Numbers after the variable represent the window area radii (90, 240, 510, 1,020 m) and (.) is a constant.
2 Akaike information criterion.
3 ΔAIC, difference in AIC from best-performing model.
4 wi, Akaike weight.
Population size in the Sierra Madre de Chiapas
Using the model that best described tapir occupancy, we estimated that the area of occurrence of Baird's tapir in the Sierra Madre de Chiapas encompassed a maximum area of 2,305 km2 (considering all three occupancy intervals; Fig. 2). Considering medium and high occupancy intervals (1,660 km2) combined with the density estimate from the spatial mark–resight model (i.e. the model with the best precision), we obtained a population size of 166 (95% CI 133–232) individuals; and using the three occupancy intervals (2,305 km2), 231 (95% CI 184–323) tapir individuals for the entire region (Table 4).
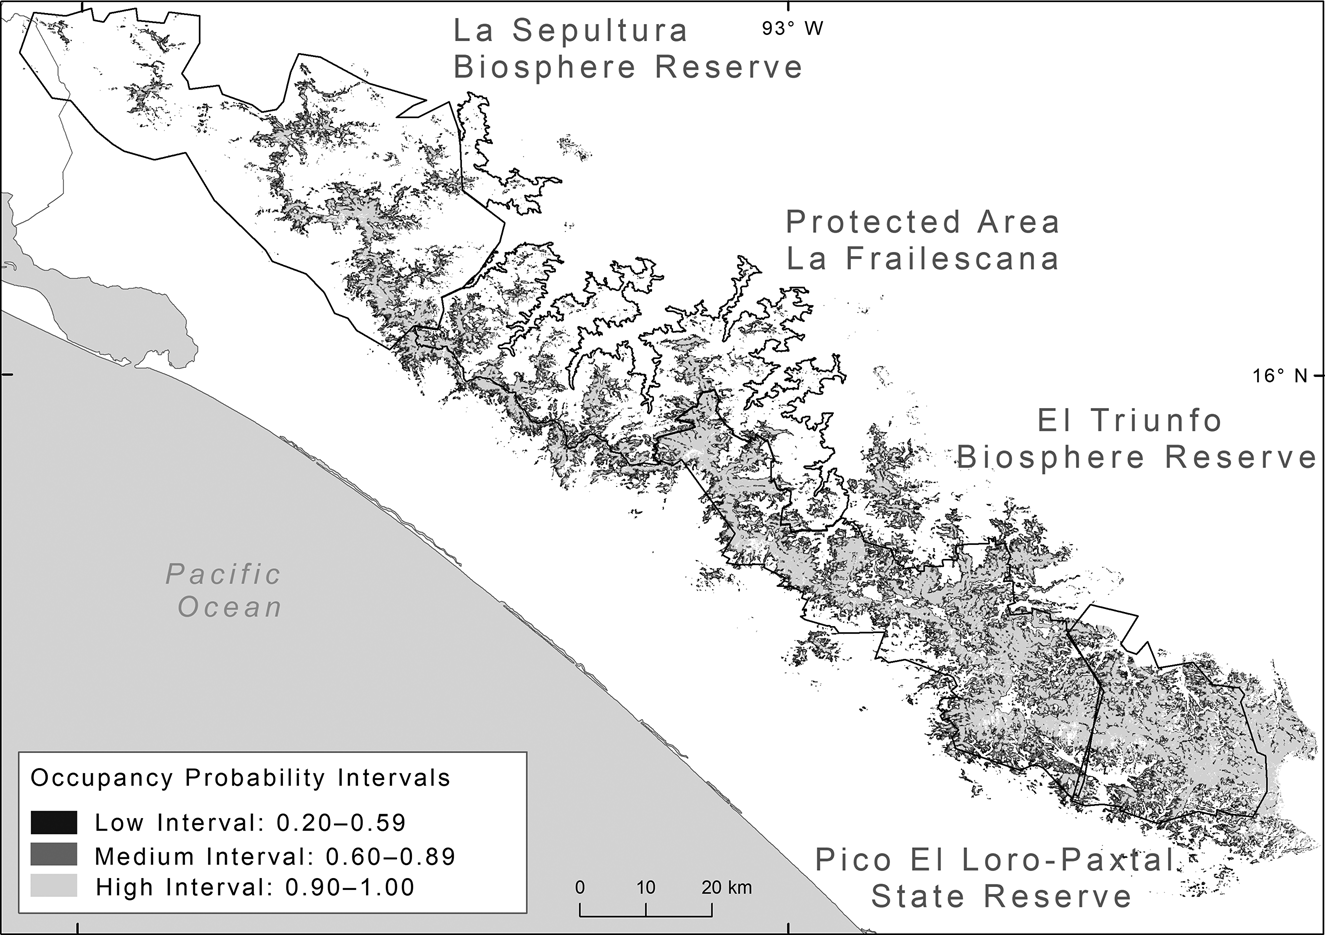
Fig. 2 Probability of occupancy of Baird's tapir in the Sierra Madre de Chiapas, classified in areas of low, medium and high occupancy.
Table 4 The number of Baird's tapir in the Sierra Madre de Chiapas estimated for each occupancy interval, based on the mean density estimated by the spatial capture–recapture, spatial mark–resight and random encounter models.
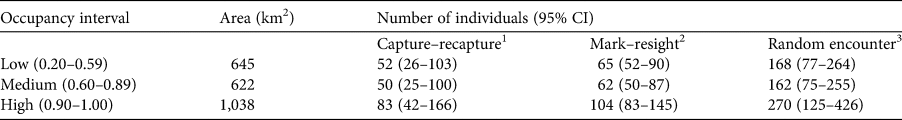
1 8 individuals/100 km2 (95% CI 4–16).
2 10 individuals/100 km2 (95% CI 8–14).
3 26 individuals/100 km2 (95% CI 12–41).
Discussion
Estimating density
As far as we are aware, this is the first study to estimate the density of Baird's tapir from camera-trap data using two spatially explicit models and the random encounter model. Although we do not have a complete census of this tapir in the Sierra Madre de Chiapas with which to compare our estimates from the three models, our findings suggest the spatial mark–resight model produced the most precise density estimate. The three models have overlapping 95% confidence intervals, indicating no significant differences between them. However, the estimate of density from the spatial capture–recapture model was one of the lowest across the species' range (Table 5).
Table 5 Mean estimates of the density of Baird's tapir from three locations in Mexico and one each in Costa Rica and Colombia, determined using the spatial capture–recapture and random encounter models, with the number of camera-trap stations, camera-trap days, independent photographs and identified individuals, and the effective sampled area.
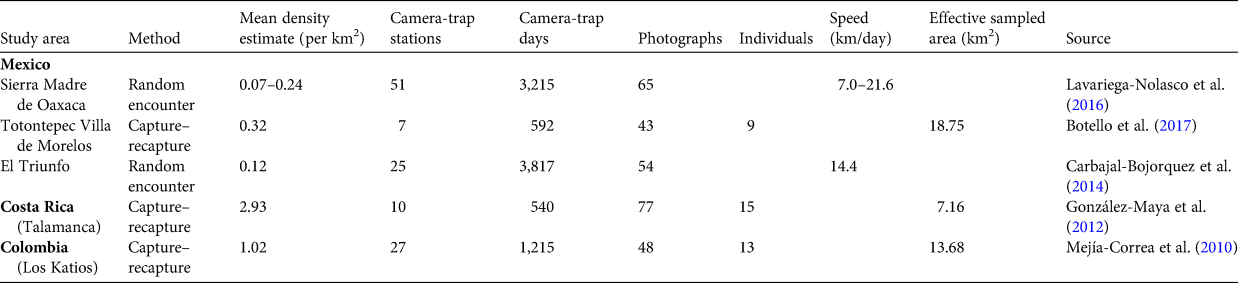
Although the low density of Baird's tapir in the Sierra Madre de Chiapas may be a result of poaching and habitat loss (de la Torre et al., Reference de la Torre, Rivero, Camacho and Álvarez-Márquez2018), the large variations in density estimated in previous studies may be related to data quality and methods of data analysis. For example, some studies that used capture–recapture models and resulted in the highest density values (Mejía-Correa et al., Reference Mejía-Correa, Diaz-Martinez and Molina2010; González-Maya et al., Reference González-Maya, Schipper, Polidoro, Hoepker, Zarrate-Charry and Belant2012; Botello et al., Reference Botello, Romero-Calderón, Sánchez-Hernández, Hernández, López-Villegas and Sánchez-Cordero2017) deployed ≤ 10 camera trap stations, with an effective sampling area of 7–19 km2 estimated from ½ mean maximum distance moved (Table 5). This approach is now known to overestimate density because spatial information related to home range and movement obtained from camera-trap locations is not adequately integrated into modeling (Noss et al., Reference Noss, Gardner, Maffei, Cuéllar, Montaño and Romero-Muñoz2012; Tobler & Powell, Reference Tobler and Powell2013). Moreover, to obtain a reliable density estimate, camera-trap polygons should be several times larger than the average home range of the target species, and have sufficient camera-trap stations to ensure recaptures of multiple individuals at multiple stations (Noss et al., Reference Noss, Gardner, Maffei, Cuéllar, Montaño and Romero-Muñoz2012).
For the random encounter model, we obtained a coefficient of variation of 28%, which indicates a low precision (White et al., Reference White, Anderson, Burnham and Otis1982). This may be because camera-trap locations were not chosen randomly as a result of the rugged terrain, and the speed of movement parameter was not available for our study site, potentially introducing additional bias as the model depends on the reliability of this parameter (Rowcliffe et al., Reference Rowcliffe, Field, Turvey and Carbone2008; Cusack et al., Reference Cusack, Swanson, Coulson, Packer, Carbone and Dickman2015).
Spatially explicit models have proven to be effective for estimating the density of species with individually identifiable markings, and of unmarked animals (Anile et al., Reference Anile, Ragni, Randi, Mattucci and Rovero2014; Rich et al., Reference Rich, Kelly, Sollmann, Noss, Maffei and Arispe2014; Kane et al., Reference Kane, Morin and Kelly2015). In our study, even though the two spatially explicit models gave similar results, spatial mark–resight produced a slightly higher density estimate with a coefficient of variation of 15.4%, in contrast to 37% for the spatial capture–recapture model (White et al., Reference White, Anderson, Burnham and Otis1982). Differences in estimation and precision between models are likely because spatial mark–resight uses both the encounter data from the marked individuals, which provides movement and detection information, and the count data of unmarked individuals (Royle et al., Reference Royle, Chandler, Sollmann and Gardner2014). The latter helps to improve density estimates that would otherwise be biased by removing a large proportion of photographs that cannot be attributed to individuals (Chandler & Royle, Reference Chandler and Royle2013).
Previous studies have also shown that, compared to other models, the spatial mark–resight model improves density estimates for species without individually identifiable markings (Rich et al., Reference Rich, Kelly, Sollmann, Noss, Maffei and Arispe2014; Kane et al., Reference Kane, Morin and Kelly2015), and simulations have shown that estimates from the spatial mark–resight model are more precise and less biased than those using only marked individuals (Chandler & Royle, Reference Chandler and Royle2013). Nevertheless, there are some potential limitations arising from the assumptions of the spatial mark–resight model (no marks are lost between marking and resighting, and all individuals are correctly identified as marked or unmarked; Royle et al., Reference Royle, Chandler, Sollmann and Gardner2014), especially when using camera traps. Both assumptions may be violated if blurred photographic records or temporary marks are used. Other limitations are the time required to identify individuals and uncertainty associated with identification. However, several studies on tapirs have shown consistency between researchers in the number of individuals identified, and identification can be improved when results are discussed among researchers, to reach a consensus (González-Maya et al., Reference González-Maya, Schipper, Polidoro, Hoepker, Zarrate-Charry and Belant2012; Tobler et al., Reference Tobler, Hibert, Debeir and Richard-Hansen2013). We attempted to ensure that we met these assumptions and performed individual identification as accurately and conservatively as possible. Although the model needs to be improved (Chandler & Royle, Reference Chandler and Royle2013; Royle et al., Reference Royle, Chandler, Sollmann and Gardner2014), spatial mark–resight can address many of the problems of estimating the population density of species that may not always have individually identifiable marks.
Population size in the Sierra Madre de Chiapas
Considering only the medium and high occupancy intervals (1,660 km2) and using the density estimated by the spatial mark–resight model, our estimate of a population size of 166 (95% CI 133–232) Baird's tapirs in the Sierra Madre de Chiapas is lower than the 225 individuals estimated by Naranjo (Reference Naranjo2009) for the same region and a similar area (1,500 km2). If we include the lower occupancy interval (645 km2), our estimate of population size increases to 230 (95% CI 184–323). However, areas with lower occupancy must be considered cautiously, as occurrence probability is < 60%, and these areas are closer to towns, roads, livestock and agricultural lands, which limit tapir presence. Although any extrapolation should be considered cautiously, we were confident to extrapolate our estimates of density to the whole Sierra Madre de Chiapas landscape because its characteristics (rugged and mountainous terrain, vegetation types, climate, social context, and threats to Baird's tapirs; Naranjo, Reference Naranjo2009) are similar to those of the area where we set camera traps.
Conservation implications
The Sierra Madre de Chiapas harbours one of the six remaining Baird's tapir populations in Mexico, and the area is critical for maintaining connectivity with the populations of El Ocote in Chiapas and Chimalapas in Oaxaca (de la Torre et al., Reference de la Torre, Rivero, Camacho and Álvarez-Márquez2018; Schank et al., Reference Schank, Arima, Cove, Brandt, Brenes-Mora and Carver2020). Our findings support the need to strengthen the four protected areas of the Sierra Madre de Chiapas. A comparison of our findings with those of Naranjo (Reference Naranjo2009) suggest the tapir population in the Sierra Madre de Chiapas could have declined by c. 30% in the last 10 years. Poaching is a severe threat to Baird's tapir in this region (Naranjo, Reference Naranjo2009; de la Torre et al., Reference de la Torre, Rivero, Camacho and Álvarez-Márquez2018), and we therefore recommend that La Frailescana be given a higher category of protection (e.g. Biosphere Reserve), as it is located between two existing Biosphere Reserves (El Triunfo and La Sepultura) and it is crucial to maintain the connectivity and integrity of the entire Sierra Madre de Chiapas landscape.
If not addressed, the debilitation of the Commission of Protected Areas by past and current administrations, including the dismissal of park rangers and other personnel and decreases in conservation budgets, will potentially result in the loss of genetic connectivity for Baird's tapirs and other species in the Sierra Madre de Chiapas. Any further loss of connectivity and increase in habitat fragmentation could lead to the extirpation of threatened and emblematic species from this region, including Baird's tapir and the jaguar Panthera onca. If the tapir metapopulation in Mexico is to remain viable, there needs to be investment in the establishment of additional habitat for the species, including through schemes such as payments for ecosystem services on communal and private lands (de la Torre et al., Reference de la Torre, Rivero, Camacho and Álvarez-Márquez2018; Schank et al., Reference Schank, Arima, Cove, Brandt, Brenes-Mora and Carver2020). For the Sierra Madre de Chiapas, we encourage the government to add national lands to existing protected areas, to increase their size and prevent further habitat degradation and deforestation. To contribute to these strategies, future research on tapirs in the Sierra Madre de Chiapas should focus on surveying areas for which there is no information, such as Pico El Loro-Paxtal State Reserve, and unprotected areas that hold potential value as genetic corridor habitat (Schank et al., Reference Schank, Arima, Cove, Brandt, Brenes-Mora and Carver2020).
Moreover, it will be critical to integrate local communities in decision-making to ensure that strategies and conservation actions for Baird's tapir have their support. Within communal lands, other conservation strategies will also be necessary, including participatory management and land-use planning to identify and prioritize conservation areas and actions for Baird's tapirs on communal lands. Fostering alternative sustainable livelihoods such as ecotourism and agroforestry systems can alleviate and reduce the impact of poaching and habitat loss in the region and in turn promote the improvement of livelihoods and the conservation of habitat for Baird's tapir (Cove et al., Reference Cove, Vargas, de la Cruz, Spínola, Jackson, Saénz and Chassot2013). Ultimately the only way to ensure Baird's tapir conservation in the Sierra Madre de Chiapas is for local and federal government institutions, NGOs and local communities to collaborate in ways that allow them to strengthen protected areas and promote the development of sustainable alternatives to livestock production and other extensive agricultural systems, to facilitate the coexistence of tapirs and local communities.
Acknowledgements
MR acknowledges the scholarship and financial support provided by Consejo Nacional de Ciencia y Tecnología (624549) and El Colegio de la Frontera Sur. We thank the administration of the Natural Resources Protected Area La Frailescana (Comisión Nacional de Áreas Naturales Protegidas, particularly R. Diaz-Velazquez and M. Morales-Hernandez, for supporting this research; the communities of Plan de Ayala, Reforma-Agraria, Francisco-Murguía and Joaquín Miguel-Gutierrez, and especially the community monitors, and Itzamná Guarneros and Leonardo Díaz, for field assistance; Paulina Arroyo for help with tapir identification; Ninon Meyer for comments on the text; and two anonymous reviewers for their helpful critiques. This work was financed by the Zoological Society of London EDGE of Existence Programme–National Geographic Photo Ark and Wildlife Conservation Network.
Author contributions
Conceptualization: MR; study design: MR, JAdlT, RR-H, MWT, EJN; compilation of data, setting camera traps: MR, JAT, GC; writing: MR, assisted by JAdlT, RR-H, MWT, EJN, CAJ, RAM.
Conflicts of interest
None.
Ethical standards
This research abided by the Oryx guidelines on ethical standards.


 Open access