


Introduction
The snow leopard Panthera uncia, although globally threatened, is one of the least studied large mammalian carnivores (Snow Leopard Network, 2014). Its patchy distribution spans c. 2.8 million km2 of high mountains across 12 Asian countries (McCarthy et al., Reference McCarthy, Mallon, Sanderson, Zahler, McCarthy and Mallon2016). Based on field studies, extrapolation of density estimates to non-surveyed areas, expert opinion and interviews, the global population is estimated to be 7,446–7,996, and in 2017 the species was recategorized, from Endangered to Vulnerable, on the IUCN Red List, suggesting that threats to snow leopards have diminished (McCarthy et al., Reference McCarthy, Mallon, Jackson, Zahler and McCarthy2017). Nevertheless, burgeoning livestock grazing pressure on its natural prey (Mishra et al., Reference Mishra, Van Wieren, Ketner, Heitkönig and Prins2004), poaching (Li & Lu, Reference Li and Lu2014; Nowell et al., Reference Nowell, Li, Paltsyn and Sharma2016), and escalating conflicts with herder communities over livestock depredation (Bagchi & Mishra, Reference Bagchi and Mishra2006; Suryawanshi et al., Reference Suryawanshi, Bhatnagar, Redpath and Mishra2013) continue to threaten the species. As many as 221–450 snow leopards are killed annually in retaliation by herder communities or as a result of becoming accidentally ensnared in traps set for other species (Nowell et al., Reference Nowell, Li, Paltsyn and Sharma2016). Habitat loss, fragmentation and degradation from infrastructure development (Zaller, Reference Zaller, McCarthy and Mallon2016), resource extraction (Farrington, Reference Farrington, McCarthy and Mallon2016) and changing climate patterns (Li et al., Reference Li, McCarthy, Wang, Weckworth, Schaller and Mishra2016) have exacerbated anthropogenic impacts on snow leopard habitat.
In 2013 governments of the snow leopard range countries initiated the Global Snow Leopard Ecosystem Protection Program to combat threats and strengthen transnational collaboration for snow leopard conservation (Snow Leopard Working Secretariat, 2013). Knowledge of the abundance and distribution of the snow leopard across its range is central to the success of the Programme, but reliable information on population status and local threats is unavailable for large parts of the species' range, both within and outside protected areas. Less than 15% of the species' distribution range has been adequately surveyed (Snow Leopard Network, 2014). As a result, conservation decisions, including those of the Program, are based in part on extrapolations of density estimates to non-surveyed areas. Assessments of snow leopard conservation status in unsurveyed regions across the species’ range are thus urgently required for informing management decisions.
The 13,000 km2 of suitable habitat in the Nepal Himalayas has been estimated to support 301–400 snow leopards, c. 10% of the global population (WWF Nepal, 2009). Studies of the snow leopard in Nepal commenced with those of Schaller (Reference Schaller1977), Jackson & Ahlborn (Reference Jackson and Ahlborn1984), and Jackson (Reference Jackson1996) in Shey Phoksundo National Park. Recent studies have focused on the western and central Himalayas (Thapa, Reference Thapa2006; Wegge et al., Reference Wegge, Shrestha and Flagstad2012; Ale et al., Reference Ale, Yonzon and Thapa2007, Reference Ale, Shrestha and Jackson2014; Devkota et al., Reference Devkota, Silwal, Shrestha, Sapkota, Lakhey and Yadav2017), but a large part of potential habitat remains poorly studied, in particular Api Nampa Conservation Area in the western Himalayas.
Reliable estimates of species abundance are fundamental for conservation and management. Recently developed non-invasive techniques, including camera trapping and DNA analysis, are among the best methods to study large elusive carnivores such as the snow leopard (Jackson et al., Reference Jackson, Roe, Wangchuk and Hunter2006; Janecka et al., Reference Janecka, Jackson, Yuquang, Diqiang, Munkhtsog, Buckley-Beason and Murphy2008), but are costly. Camera trapping can be logistically challenging when information on presence/absence of the study species is not available. In these circumstances, information on spatial distribution can be useful for defining conservation priorities. The presence and spatial distribution of a species can be assessed based on indirect evidence of species occurrence (e.g. pugmarks, scrapes; Jackson & Hunter, Reference Jackson and Hunter1996).
The goal of this study was to determine snow leopard presence and to estimate the abundance of its wild prey in Api Nampa Conservation Area, and thus to estimate the number of snow leopards that this area could potentially support. We also examined the influence of ecological and anthropogenic variables on encounter rate of snow leopard signs.
Study area
The 1,903 km2 Api Nampa Conservation Area, established in 2010, lies in the far-western Himalayas of Nepal (Fig. 1) at altitudes of 518–7,132 m. Monthly mean maximum temperature is c. 24°C in summer and in winter the minimum temperature can drop to c. −30°C. Precipitation above 3,500 m is mainly in the form of snow, which starts to melt in March. Topography is characterized by undulating terrain and river valleys. Vegetation above 3,600 m is largely dry alpine steppe characterized by meadows rich in sedges and graminoids such as Stipa, Carex and Kobresia. On drier sites and rugged slopes vegetation is dominated by dry grasses and shrubs such as Caragana brevifolia and Lonicera spinosa. Below 3,600 m mixed broadleaved and conifer forest species include blue pine Pinus wallichiana, Himalayan fir Abies spectabilis, birch Betula utilis, burans Rhododendron arboreum, oak Quercus spp. and juniper Juniperus indica. The fauna includes the Himalayan marmot Marmota himalayana, woolly hare Lepus oiostolus, musk deer Moschus chrysogaster, Himalayan goral Naemorhedus goral and bharal (blue sheep) Pseudois nayaur. Bharal is the most common ungulate and a food source for the snow leopard, golden jackal Canis aureus and grey wolf Canis lupus.

Fig. 1 The location of Api Nampa Conservation Area in Nepal.
Within the suitable habitat for the snow leopard (generally above 3,500 m), local communities are mainly agro-pastoralist. Green peas, potato and barley are the main agricultural crops. The dominant source of income for local communities is animal husbandry and collection of non-timber forest products, including a valuable medicinal product that is a complex of the parasitic fungus Cordyceps sinensis and the ghost moth caterpillar Thitarodes spp. (Pant et al., Reference Pant, Rai, Wallrapp, Ghate, Shrestha and Ram2017). Livestock species include sheep, goats, yaks, cattle–yak hybrids (dzo, jhopas), and horses. Migratory herders employ a seasonal grazing pattern in which they move large herds of livestock to higher elevations in late April, rotate them among pastures, and then herd them to lower elevations in mid September.
Methods
Snow leopard sign survey
We adopted the Snow Leopard Information Management System (Jackson & Hunter, Reference Jackson and Hunter1996) to determine snow leopard presence and to estimate the relative encounter rate of snow leopard signs. Although this system was not developed specifically for estimating snow leopard abundance, it is nevertheless a useful method for conducting presence/absence surveys as it is straightforward for field assistants with little formal education to use, has minimal impact on the species being studied, and is inexpensive (Ale et al., Reference Ale, Shrestha and Jackson2014). Based on anecdotal information of snow leopard occurrence we selected six study blocks, Tinkar, Nampa, Ghusa, Khandeshowri, Sitaula and Rapla, with areas of 31–50 km2. Within these blocks we located ridgelines, narrow valleys and human trails (used and unused) where snow leopards were most likely to leave signs of territory marking and/or communication (Jackson, Reference Jackson1996), to serve as transects. No routes were surveyed more than once. We recorded the location and sign type (scrape, pugmark, scent marking, scats) with a GPS, and the elevation at the beginning and end of the transect. To quantify potential human disturbance on the snow leopard we recorded presence/absence of recent human activities/use of the area (e.g. firewood collection, livestock grazing, snares, poaching camps and fires), as a proxy. A transect was considered to be disturbed if direct evidence for any of these activities was observed at least at one location along the transect. A distance of at least 250 m was maintained between consecutive transects, to avoid spatial autocorrelation. Transects were at 3,000–5,038 m, nearly all above the treeline. Surveys were conducted in 2014, during October–November, when migratory livestock graze at lower elevations, resident livestock are fed in stalls, and human disturbance is minimal.
Bharal survey
While conducting sign surveys along transects we also counted bharal using binoculars and spotting scopes (Schaller, Reference Schaller1977; Shrestha & Wegge, Reference Shrestha and Wegge2008). To determine population structure and recruitment we recorded the age class and sex of each bharal seen. Following Schaller (Reference Schaller1977) and Wegge (Reference Wegge1979), bharal were categorized as adult males (7+ years old; horns curved and > 45 cm in length), subadult males (4–7 years; horns curved backwards, with a length of 30–45 cm), young males (2–3 years; horn length 15–35 cm), adult females (> 2 years), yearlings (both sexes, 1–2 years) and young (< 1 year). Additional information on group size, particular characteristics and composition of the group (e.g. male groups), location, time and behaviour were recorded for cross checking and to avoid double counting. For the same reason we also surveyed adjacent transects that were within the potential daily movement distance of bharal groups (5–6 km). Surveys were conducted in 2014, during October–November, when bharal herds congregate for courtship and mating and are therefore easiest to count.
Data analysis
Density estimates for bharal within each block were calculated by dividing the number of animals recorded by the effectively sampled area (the area covered by scanning from the survey transects). We expected that mean elevation (mean of elevation at beginning and end of transect), prey availability (number of bharal encountered per transect) and human disturbance (presence/absence of recent human activities/use) would influence the sign encounter rate (Wolf & Ale, Reference Wolf and Ale2009; Sharma et al., Reference Sharma, Bhatnagar and Mishra2015; Alexander et al., Reference Alexander, Gopalaswamy, Shi, Hughes and Riordan2016a; Suryawanshi et al., Reference Suryawanshi, Redpath, Bhatnagar, Ramakrishnan, Chaturvedi, Smout and Mishra2017). To test the influence of these potential predictor variables on the number of signs encountered along each transect, we used generalized linear models with a Poisson error distribution and log link function. The predictor variables were standardized to z-scores prior to analysis, which allowed us to interpret the model coefficients and to compare effect sizes between alternative models. We assessed collinearity between the predictor variables, using Pearson’s correlation coefficients. We did not include covariates that were substantially correlated (Pearson's |r|> 0.7) in the same model (Dormann et al., Reference Dormann, Elith, Bacher, Buchmann, Carl and Carré2013). We ranked models using the Akaike information criterion adjusted for small samples (AICc; Burnham & Anderson, Reference Burnham and Anderson2002). Models with ΔAICc < 2 were considered to be strongly supported by the data. We used the R package MuMin to perform model averaging of all candidate models (Barton, Reference Barton2017), and computed 95% confidence intervals of the beta coefficients for each predictor variable. The model-averaged beta-coefficients of covariates and their 95% confidence intervals were examined to assess the significance of their effect on leopard sign encounter rate. Confidence intervals that included zero indicated no significant effect of the covariates. The relative importance of each covariate was determined by summing the Akaike weights of the models containing these factors. All analyses were carried out in R 3.4.2 (R Development Core Team, 2017).
We calculated the maximum number of snow leopards that the available bharal population could support following the predator–prey ratio suggested by Oli (Reference Oli1994). We estimated the number of bharal that the suitable snow leopard habitat (c. 600 km2; G. Khanal, unpubl. data) could support based on bharal counts in six blocks (a total of c. 200 km2), and then converted the estimated number into biomass. Because there is little reliable empirical information on body weights for each category of bharal, we considered adult male, subadult male, young male, adult female, yearling and young age classes to have a mean weight of 65, 60, 55, 55, 30 and 25 kg, respectively (Schaller, Reference Schaller1977). We then used the predator–prey weight ratio (1 : 114–159; Oli, Reference Oli1994) to estimate the number of snow leopards that Api Nampa Conservation Area could potentially support. This ratio was based on findings (Jackson & Ahlborn, Reference Jackson and Ahlborn1984) that an adult snow leopard requires 600–900 kg of meat annually (20–30 bharal) after accounting for energy expenditure in a wild snow leopard and the inedible parts of its prey (Jackson & Ahlborn, Reference Jackson and Ahlborn1984).
Results
We surveyed 51 transects, covering a total distance of 106 km, with lengths of 900–3,770 m and a mean length of 2,082 m. We recorded 203 snow leopard signs on 35 transects (Table 1), with a mean encounter rate of 1.91 signs/km. We excluded scats from the analysis because we were uncertain of identification to species. Scrapes were the most frequently detected sign (n = 89, 0.84/km), followed by pugmarks (n = 67, 0.63/km). The highest encounter rate of all types of sign was in the Tinkar block (2.35/km; Table 1).
Table 1 Results of transect surveys for snow leopard Panthera uncia signs conducted at six sites within Api Nampa Conservation Area (Fig. 1) during October–November, 2014.

The predictor variables elevation, human disturbance and prey availability were not highly intercorrelated (Pearson correlation coefficients were all < 0.60) and hence all were used in the regression analyses. Elevation was the most important variable in determining the encounter rate of snow leopard signs along transects, followed by a negative effect of human use (Tables 2 & 3). Snow leopard signs were also positively associated with number of bharal detected from the transect, but the relationship was not statistically significant (Table 3).
Table 2 Poisson regression models describing the occurrence of the snow leopard in Api Nampa Conservation Area (Fig. 1) during October–November 2014, ranked according to the Akaike information criterion adjusted for small sample size (AICc).

1Elevation (m); HumanDist, presence/absence of recent human use of the area; Prey, number of bharal encountered.
2Number of parameters.
3Difference between the AICc value of the best-supported model and successive models.
4Akaike model weight.
Table 3 Model-averaged parameter estimates and 95% confidence interval describing snow leopard occurrence in Api Nampa Conservation Area (Fig. 1) during October–November 2014.

1Elevation (m); HumanDist, presence/absence of recent human use of the area; Prey, number of bharal encountered.
2Averaged from all models.
We counted a total of 527 individual bharal in 32 groups, comprising 30% males, 38% females, 14% yearlings and 18% young (Table 4), with a mean group size of 16.5 (range 6–48). The highest density of bharal was in the Tinkar block and the lowest in Sitaula, and the greatest numbers of bharal were sighted at 4,000–4,500 m (Fig. 2). The overall density of bharal within the effectively surveyed area of c. 200 km2 was estimated to be 2.28 ± SE 0.49/km2. The adult sex ratio was female biased, with 77 males/100 adult females. Overall recruitment rate was 48 young/100 females. The ratio of yearlings to young was 0.83 : 1, indicating a 17% mortality rate of kids, assuming a stationary age structure and similar recruitment rate to that of the previous 2 years. Approximately 18,100 kg of bharal biomass was estimated to be available within the effectively sampled area.
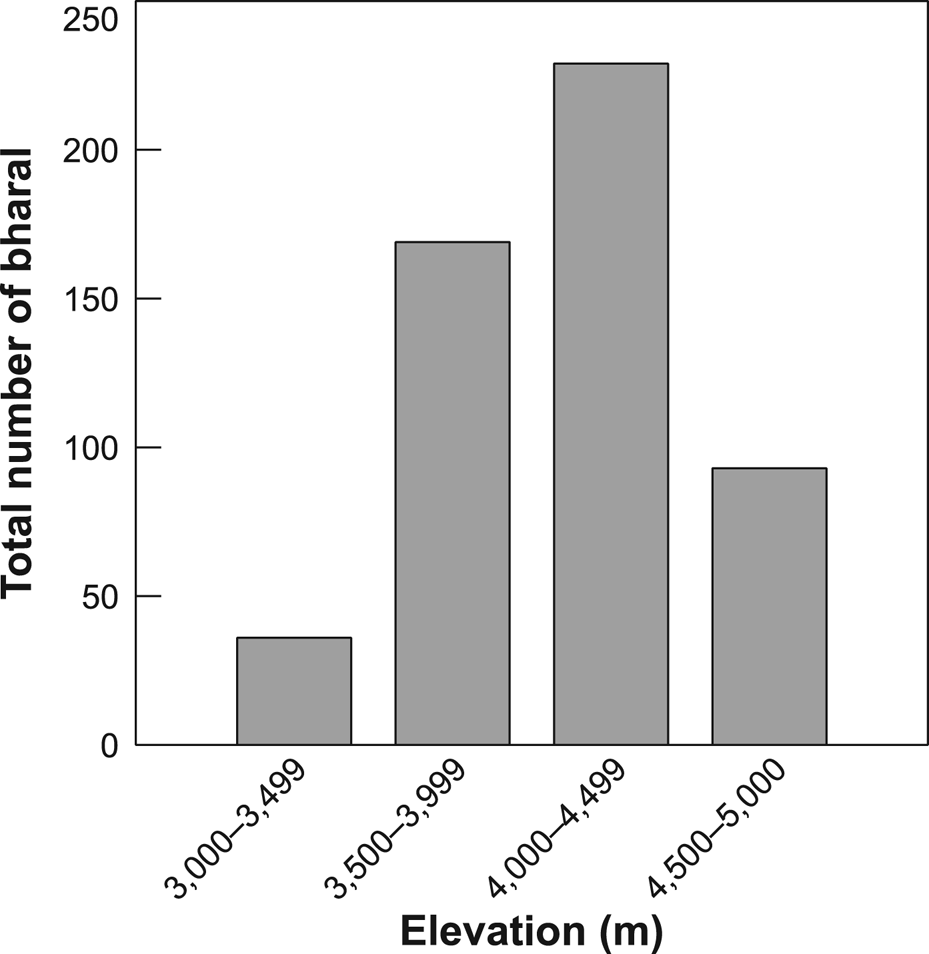
Fig. 2 Total number of bharal Pseudois nayaur observed across four bands of altitude in Api Nampa Conservation Area (Fig. 1) in autumn.
Table 4 Bharal population structure in Api Nampa Conservation Area (Fig. 1) in October–November 2014.

This biomass could support 3–4 snow leopards. Based on our occupancy surveys, c. 600 km2 of suitable habitat is available for bharal and snow leopards in Api Nampa. With an estimated density of 2.28 bharal/km2 in the surveyed blocks, we estimate that the suitable habitat (31% or 600 km2 of the whole 1,903 km2 protected area) could support a minimum of 1,000 bharal. Considering 40 kg as the mean weight of an individual bharal, this total population is c. 40,000 kg of biomass, which, based on the predator–prey ratio (Oli, Reference Oli1994), could sustain 6–9 snow leopards.
Discussion
Our study provides the first evidence of snow leopard presence in Api Nampa Conservation Area, Nepal. The information on the estimated number of snow leopards and bharal biomass and density reported here will help in setting up priorities for conservation, research and management.
Snow leopard distribution
We recorded snow leopard presence in five of the six blocks surveyed. Although the rate at which we encountered snow leopard signs (1.9/km for all blocks combined) was lower than reported in other protected areas of Nepal (Kanchenjunga Conservation Area: 5.4 signs/km, Thapa, Reference Thapa2006; Sargarmatha National Park: 4.2 signs/km, Ale et al., Reference Ale, Yonzon and Thapa2007; Annapurna Conservation Area: 5.8 signs/km, Ale et al., Reference Ale, Shrestha and Jackson2014; Manaslu Conservation Area: 3.5 signs/km, Devkota et al., Reference Devkota, Silwal, Shrestha, Sapkota, Lakhey and Yadav2017), the prey biomass was sufficiently large to support a breeding population of snow leopards. Survey times may influence sign encounter rate. There may be a higher detection rate in winter and post-winter because of accumulation of snow and minimal human presence (Jackson & Hunter, Reference Jackson and Hunter1996). Devkota et al. (Reference Devkota, Silwal, Shrestha, Sapkota, Lakhey and Yadav2017), for example, surveyed both pre-winter (November–December) and post-winter (May–April). Our surveys, however, were conducted just after the migratory livestock grazing and fungal caterpillar collection season (October–November). In addition, we did not consider putative snow leopard scats in our analysis, which could have lowered the overall sign encounter rate.
Factors influencing sign encounter rate
Contrary to our initial expectation, there was only a weak positive association between the availability of bharal and the number of snow leopard signs. Although abundance of wild prey is a key determinant of habitat use and abundance of snow leopards (Sharma et al., Reference Sharma, Bhatnagar and Mishra2015; Suryawanshi et al., Reference Suryawanshi, Redpath, Bhatnagar, Ramakrishnan, Chaturvedi, Smout and Mishra2017), it was not the main predictor variable in our study. This could be because the length of the individual transects (1–2 km) was insufficient to encompass the variability required for the model to detect the relationship, given the wide-ranging nature of snow leopards (Johansson et al., Reference Johansson, Rauset, Samelius, McCarthy, Andrén, Tumursukh and Mishra2016). A temporal mismatch between bharal presence and the time when leopards left signs may also have obscured a direct relationship between the two species. In the Qilian Shan region of China there was a weak association between prey and snow leopard site use at a fine scale (16 km2; Alexander et al., Reference Alexander, Shi, Tallents and Riordan2016b), but a strong positive relationship at a landscape scale (Alexander et al., Reference Alexander, Gopalaswamy, Shi, Hughes and Riordan2016a). It is also possible that other factors, such as terrain ruggedness, which we could not measure (our sampling units were linear transects and it was not possible to compute a terrain ruggedness index adequately for such features), could have better explained the variability in sign encounter rate, as in Sagarmatha National Park, Nepal (Wolf & Ale, Reference Wolf and Ale2009).
In Api Nampa Conservation Area snow leopards were less likely to leave signs in areas of active human presence. Generally, large carnivores avoid using such areas, especially where hunting or harassment is common (Kerley et al., Reference Kerley, Goodrich, Miquelle, Smirnov, Quigley and Hornocker2002). In our study area, although illegal resource extraction and hunting are prohibited, local herders disclosed that illegal activities, such as use of snares to hunt bharal and pheasants Lophophorus impejanus, and collection of timber and non-timber forest products, occur frequently. This could be causing significant disturbance to snow leopards. In Sagarmatha National Park snow leopards were less likely to use trails used by tourists, guides or porters and their yak caravans (Wolf & Ale, Reference Wolf and Ale2009).
We were unable to distinguish whether the greater sign encounter rate that we found at higher elevations reflects greater site use or increased sign detection probability as a result of more snow accumulation and greater retention time of signs. Higher elevations are often more remote and less visited by people. A study of the fine scale occurrence of snow leopards in Qilian Shan, China, found that the probability of site use by snow leopards increased with altitude (Alexander et al., Reference Alexander, Gopalaswamy, Shi, Hughes and Riordan2016a).
Wild prey bharal density estimates
Our density estimates and recruitment rate of bharal were lower than in other protected areas in Nepal (Table 5). Schaller (Reference Schaller1977) attributed the low recruitment rate in Shey Phoksundo National Park, Nepal, to excessive livestock grazing, but high predation on young animals could also have been a contributing factor. In Spiti Valley, Himachal state, India, high grazing pressure by livestock led to a low bharal reproductive rate (Mishra et al., Reference Mishra, Van Wieren, Ketner, Heitkönig and Prins2004). However, because of fine-scale habitat partitioning, forage competition between livestock and bharal may not be as direct as commonly assumed (Shrestha & Wegge, Reference Shrestha and Wegge2008). We did not collect information on habitat relationships or on forage availability but based on our general observations and information on livestock numbers, we suggest that high grazing pressure by seasonally grazing livestock may be a contributing factor to the low recruitment of bharal. Accounts from local community leaders and herders, and data available at the Api Nampa Conservation Area office, suggest that a minimum of 10,000 livestock graze on the rangelands in summer, c. 10× higher than our estimate of 1,000 bharal.
Table 5 Bharal density and population recruitment estimates for Nepal.

Limitations and further studies
The information on snow leopard distribution and factors influencing the sign encounter rate reported here are based on limited survey data, and sign encounter rate is a less accurate metric for assessing snow leopard habitat use than movement data from radio telemetry. Our analyses of encounter rates may reflect where we were more likely to detect signs, rather than habitat use per se. Detection of snow leopard signs may be influenced by survey season, search effort, observer experience and fatigue, weather (snow fall), substrate (e.g. snow cover), sign type and longevity, terrain type, site selection (e.g. ridgeline vs river bank trails) and human and livestock use of the area (McCarthy et al., Reference McCarthy, Fuller, Ming, McCarthy, Waits and Jumabaev2008).
Our estimate that 6–9 snow leopards could be supported in Api Nampa Conservation Area is based on the predator–prey ratio (Oli, Reference Oli1994), which does not take into account the contribution of livestock and alternative prey such as the marmot (Mallon et al., Reference Mallon, Harris, Wegge, McCarthy and Mallon2016). Livestock can contribute up to 42% of annual snow leopard diet (Wegge et al., Reference Wegge, Shrestha and Flagstad2012), and smaller mammals such as the marmot can contribute as much as 45% of the summer food of snow leopards (23% of annual requirements; Schaller et al., Reference Schaller, Junrang and Mingjiang1988). Although the total prey biomass in the Conservation Area could therefore potentially support more than 6–9 snow leopards, we observed a relatively low abundance of marmots, and local residents indicated there is little livestock depredation by snow leopards. Use of the predator–prey ratio to estimate snow leopard numbers also assumes there is no competition from other predators for the same prey biomass. Because we rarely encountered wolf signs and local herders reported that wolves were seldom observed, it is unlikely that other predators consume a substantial proportion of the bharal biomass.
Our method for surveying the bharal population does not account for imperfect detection and therefore probably underestimated the density of this key prey species, thus also affecting the inference from the predator–prey ratio. The double observer method, which allows the detection probability to be estimated, for correcting the counts, and also allows estimation of the precision of the estimates, could have produced more accurate estimates of the bharal population (Suryawanshi et al., Reference Suryawanshi, Bhatnagar and Mishra2012). We counted bharal from transects that often ran along ridgelines. Bharal are wary of disturbance and retreat when they detect humans on ridgelines, even far away. We estimated bharal density by dividing the number of animals seen by the area effectively sampled, which was based on the sum of areas that we considered to have been scanned. This method is subjective and may have overestimated the total sampling area, leading to an underestimation of density. Overall, the potential for underestimation of total prey availability suggests that 6–9 snow leopards is a conservative estimate of the number Api Nampa Conservation Area could support.
Large mammalian carnivores are threatened globally (Ripple et al., Reference Ripple, Estes, Beschta, Wilmers, Ritchie and Hebblewhite2014; Wolf & Ripple, Reference Wolf and Ripple2017), and knowledge of the factors influencing distribution is critical for their conservation. Studying an elusive carnivore such as the snow leopard in remote and rugged terrain is challenging, and using methods such as camera trapping to survey all areas where the species could exist can be costly and logistically difficult. Sign surveys therefore continue to provide evidence for informing conservation decisions and for establishing a baseline for future monitoring. Standardizing the survey protocols (e.g. search effort, observer bias, selection of sampling sites, study season and duration), accounting for imperfect detection in study design and modelling (MacKenzie et al., Reference MacKenzie, Nichols, Lachman, Droege, Royle and Langtimm2002) and training local herders as citizen scientists and involving them in field surveys could improve the reliability of data from such surveys. For Api Nampa Conservation Area, we suggest that reliable baseline information on snow leopard distribution and abundance be established from standardized sign surveys, preferably combined with camera trapping or genetic studies.
Our field observations and interactions with local communities revealed that human disturbance and habitat degradation associated with extraction of non-timber forest products, livestock grazing, and poaching are major threats to snow leopards in Api Nampa Conservation Area. Conservation awareness campaigns and regulation of natural resource extraction in collaboration with local communities could be crucial in reducing threats to this landscape in general, and to the snow leopard in particular.
Acknowledgements
We thank the Department of National Parks and Wildlife Conservation for providing the research permit for this study; The Rufford Foundation, Cleveland Metroparks Zoo and Cleveland Zoological Society for funding the fieldwork; IDEA Wild Inc., USA, for providing the research equipment; Man Bahadur Khadka, Maheshwar Dhakal, Sher Singh Thagunna, Koustubh Sharma, Hem Raj Acharya, Ashok Kumar Ram, Saroj Panthi, Gokarna Jung Thapa, Pemba Sherpa, Dipendra Nath and Indra Nagari for their support; Rachel Moseley for help in improving the text; and the editor and two anonymous reviewers for their constructive comments.
Author contributions
Study design: GK, PW; data collection and analysis: GK; writing: GK, PW, LPP, BPD, RR.
Conflicts of interest
None.
Ethical standards
This research abided by the Oryx Code of Conduct.


