


Introduction
Over the last 5 decades populations of large carnivores have been recovering in Europe following the implementation of conservation policies (Chapron et al., Reference Chapron, Kaczensky, Linnell, von Arx, Huber and Andrén2014). In parallel, conflicts have arisen between people and wildlife (Treves & Karanth, Reference Treves and Karanth2003). The main sources of conflict are damage to livestock, and competition with local hunters for prey species (Ericsson & Heberlein, Reference Ericsson and Heberlein2003; Gunther et al., Reference Gunther, Haroldson, Frey, Cain, Copeland and Schwartz2004; Piédallu et al., Reference Piédallu, Quenette, Mounet, Lescureux, Borelli-Massines and Dubarry2016a). For these conflicts to be resolved, or at least mitigated, the expectations of all stakeholders need to be considered, and management decisions should be based on reliable ecological data (Redpath et al., Reference Redpath, Young, Evely, Adams, Sutherland and Whitehouse2013).
The brown bear Ursus arctos is widely distributed throughout Europe, with multiple populations of various sizes and ranges (Swenson et al., Reference Swenson, Taberlet and Bellemain2011), including a large population in Sweden (Kindberg et al., Reference Kindberg, Swenson, Ericsson, Bellemain, Miquel and Taberlet2011) and a smaller one in the Italian Apennines (Gervasi et al., Reference Gervasi, Ciucci, Boulanger, Randi and Boitani2012). One of the smallest and most threatened populations is in the Pyrenees mountains, between south-western France and north-eastern Spain, and is categorized as Critically Endangered based on IUCN Red List criteria (Huber, Reference Huber2007). Only five individuals were detected in 1995, and individuals were translocated from Slovenia in 1996–1997, 2006 and 2016 as a necessary measure to ensure the survival of the population. The population remains small, and is threatened by demographic stochasticity and inbreeding (Chapron et al., Reference Chapron, Wielgus, Quenette and Camarra2009; Swenson et al., Reference Swenson, Taberlet and Bellemain2011).
The distribution of a wild population is a key element in determining its conservation status (IUCN, 2001). However, this is difficult to assess in the case of elusive species with large home ranges (Gittleman & Harvey, Reference Gittleman and Harvey1982), such as the brown bear. To infer the distribution of large carnivores, monitoring often relies on tracks and indirect observations coupled with DNA analyses to identify the species (e.g. Taberlet et al., Reference Taberlet, Camarra, Griffin, Uhrès, Hanotte and Waits1997; McDonald, Reference McDonald and Thompson2004; Bellemain et al., Reference Bellemain, Swenson, Tallmon, Brunberg and Taberlet2005). The distribution of the brown bear in France remains poorly studied. In Spain, Martin et al. (Reference Martin, Revilla, Quenette, Naves, Allainé and Swenson2012) conducted habitat suitability analyses at a coarse scale on the Cantabrian population and applied their findings in a study of the Pyrenees population, using presence-only methods. Here, we build on these results to address two issues in standard species distribution models.
Firstly, when dealing with free-ranging populations, species detectability is probably < 1, which can lead to false negatives where animals are present but not detected during the survey (Kéry, Reference Kéry2011). Falsely assuming perfect detection can lead to an underestimation of the species’ distribution (Lahoz-Monfort et al., Reference Lahoz-Monfort, Guillera-Arroita and Wintle2014). Site-occupancy models were developed specifically to distinguish between non-detection and absence by modelling the imperfect, possibly heterogeneous observation process (MacKenzie et al., Reference MacKenzie, Nichols, Lachman, Droege, Royle and Langtimm2002). Secondly, standard species distribution models assume that a species always occupies the most favourable area, and that this area can be reached by dispersal, based on the ecological niche concept (Leibold, Reference Leibold1995). However, natural barriers or dispersal limitations (such as small population size) may prevent a species from reaching a favourable area (Araújo & Guisan, Reference Araújo and Guisan2006). To address this, static occupancy models were extended to account for colonization and extinction processes: so-called dynamic or multi-season occupancy models (MacKenzie et al., Reference MacKenzie, Nichols, Hines, Knutson and Franklin2003). Although static occupancy models have often been used to study large carnivores (e.g. Carroll et al., Reference Carroll, Phillips, Schumaker and Smith2003; Carroll & Miquelle, Reference Carroll and Miquelle2006; Bayne et al., Reference Bayne, Boutin and Moses2008; Hines et al., Reference Hines, Nichols, Royle, MacKenzie, Gopalaswamy, Samba Kumar and Karanth2010), there have been only few applications of dynamic occupancy models (Molinari-Jobin et al., Reference Molinari-Jobin, Kéry, Marboutin, Molinari, Koren and Fuxjäger2012; Miller et al., Reference Miller, Nichols, Gude, Rich, Podruzny, Hines and Mitchell2013).
We identified environmental or anthropogenic drivers and trends in habitat use by brown bears in the French Pyrenees. To do so we fitted dynamic occupancy models to detection/non-detection data obtained through a multi-source systematic monitoring protocol during 2008–2014.
Study area and bear population
The study was conducted on the French side of the Pyrenees at the border between north-eastern Spain and south-western France (Fig. 1). The bears here mostly descend from individuals that were translocated from Slovenia to the Pyrenees in 1996–1997 (two females and one male) and 2006 (four females and one male), although the mother of one belonged to the remnant of the original Pyrenean bear population, which was thought to comprise five individuals in 1995. Field observations indicate that two population cores exist on the French side of the Pyrenees: two male bears have been accounted for in the western core, with the rest of the population found in the central core (Fig. 1).
Fig. 1 The counties of the French Pyrenees, where brown bear Ursus arctos monitoring was conducted. Mountain subsections are delineated in grey.
Methods
Data collection and monitoring
Data were gathered during 2008–2014 by members of the national Brown Bear Network (228 professional members from government agencies and 135 unaffiliated amateur members) under the supervision of the French Game and Wildlife Agency. A systematic monitoring protocol was followed using fixed transects along which the agents looked for bear sign such as hair, scats, claw marks or paw prints. The study area was divided into subsections based on ridge lines and valleys, and the mean area of a subsection was 95 km2. The home range of brown bears is c. 85–200 km2 for males and and c. 50–100 km2 for females (Huber & Roth, Reference Huber and Roth1993; Preatoni et al., Reference Preatoni, Mustoni, Martinoli, Carlini, Chiarenzi and Chiozzini2005); however, the upper limits of these home ranges include the rut during May–June, whereas our analyses were focused on July–November, when home ranges are smaller (Preatoni et al., Reference Preatoni, Mustoni, Martinoli, Carlini, Chiarenzi and Chiozzini2005). Each of the 84 subsections investigated included one transect. Each transect was visited at least once per month during July–November. The length of each transect was proportional to the area of the corresponding subsection, with 0.2 km surveyed per km2 of subsection. Signs and observations were validated by experts from the French Game and Wildlife Agency, thus minimizing the risk of false positives resulting from species misidentification (Molinari-Jobin et al., Reference Molinari-Jobin, Kéry, Marboutin, Molinari, Koren and Fuxjäger2012).
Model building and selection
To estimate the probability of bear presence in all the subsections, we built a dynamic occupancy model (MacKenzie et al., Reference MacKenzie, Nichols, Hines, Knutson and Franklin2003) that was parametrized with the probabilities of colonization, γ (the probability of a subsection that was unoccupied the previous year becoming occupied); extinction, ε (the probability for a subsection that was occupied the previous year becoming unoccupied); and initial occupancy, ψ 1 (the probability of a subsection being occupied in the first year of the study); along with the species detection probability p (the probability of detecting the species in a subsection when present). We used years as primary occasions, between which colonization and extinction probabilities could be estimated, and the months July–November as secondary occasions, during which we considered the occupancy status of a subsection to remain unchanged (the closure assumption). By focusing on the July–November period we excluded the breeding season (April–June), during which male bears in particular are known to increase their movement range while they look for females (Clevenger et al., Reference Clevenger, Purroy and Pelton1990). Despite this precaution movements in and out of the subsections may still occur and, assuming these movements are random, occupancy should be interpreted as habitat use rather than the proportion of area occupied by the species (MacKenzie & Nichols, Reference MacKenzie and Nichols2004). More precisely, the usage made of various habitat components within the home range is usually referred to as third-order selection (Johnson, Reference Johnson1980).
We relied on previous habitat suitability studies of brown bears in Europe to select candidate environmental and anthropogenic covariates for our analysis (Mertzanis et al., Reference Mertzanis, Kallimanis, Kanellopoulos, Sgardelis, Tragos and Aravidis2008; Martin et al., Reference Martin, Basille, Van Moorter, Kindberg, Allainé and Swenson2010, Reference Martin, Revilla, Quenette, Naves, Allainé and Swenson2012). We considered five environmental and anthropogenic covariates for each subsection (Table 1; Supplementary Fig. S1). Roughness was calculated as the mean of the absolute differences between the altitude of a subsection and that of its contiguous subsections (Wilson et al., Reference Wilson, O'Connell, Brown, Guinan and Grehan2007). We used the BD ALTI database (250 m resolution; IGN, 2016a) to calculate the mean altitude of each subsection. Forest cover and shrub cover covariates were extracted from the CORINE Land Cover database (CLC, 2012). Road length was extracted from the ROUTE 500 database (IGN, 2016b). Human density was obtained from the NASA Socioeconomic Data and Applications Center (CIESIN & CIAT, 2005). The maximum correlation between these covariates was 0.51 in absolute value. We used Akaike's information criterion (AIC; Burnham & Anderson, Reference Burnham and Anderson2002) for covariate selection, and the difference in AIC (ΔAIC) to compare model support with reference to the model best supported by the data. To account for model selection uncertainty we resorted to model averaging, considering all models with ΔAIC < 2. Given the large number of covariate combinations, we used a multistage approach to model selection (Dugger et al., Reference Dugger, Anthony and Andrews2011; MacKenzie et al., Reference MacKenzie, Seamans, Gutiérrez and Nichols2012; Lee & Bond, Reference Lee and Bond2015). We began by selecting the best model structure, focusing on time-varying covariates only, namely year and survey. We considered eight models in total, with either no effect (.) or a year effect on colonization and extinction, and either no effect (.) or a survey effect (where a survey refers to a month, hence a survey-specific covariate) on detection probability (Table 2). As the sampling effort was homogeneous over the study period, we did not consider a year effect on detection. Then, based on previous bear occupancy studies (Nielsen et al., Reference Nielsen, Stenhouse and Boyce2006, Reference Nielsen, McDermid, Stenhouse and Boyce2010; Mertzanis et al., Reference Mertzanis, Kallimanis, Kanellopoulos, Sgardelis, Tragos and Aravidis2008; Martin et al., Reference Martin, Basille, Van Moorter, Kindberg, Allainé and Swenson2010, Reference Martin, Revilla, Quenette, Naves, Allainé and Swenson2012) and bear biology, we considered specific combinations of the environmental or anthropogenic effects on each of the parameters (ψ 1, γ, ε and p; Table 1). We tested possible negative effects of the covariates human density and road length on initial occupancy ψ 1, as a previous study showed that bears avoided human-caused disturbances (Naves et al., Reference Naves, Wiegand, Revilla and Delibes2003; Mertzanis et al., Reference Mertzanis, Kallimanis, Kanellopoulos, Sgardelis, Tragos and Aravidis2008; Martin et al., Reference Martin, Basille, Van Moorter, Kindberg, Allainé and Swenson2010). Roughness, shrub cover and forest cover were all positively associated with bear presence in previous studies, albeit performed at different scales (Naves et al., Reference Naves, Wiegand, Revilla and Delibes2003; Apps et al., Reference Apps, McLellan, Woods and Proctor2004; Nellemann et al., Reference Nellemann, Støen, Kindberg, Swenson, Vistnes and Ericsson2007; Martin et al., Reference Martin, Basille, Van Moorter, Kindberg, Allainé and Swenson2010, Reference Martin, Revilla, Quenette, Naves, Allainé and Swenson2012). For colonization, we studied possible effects of roughness and human density, which were the most commonly significant covariates in previous studies of bear distribution (Martin et al., Reference Martin, Basille, Van Moorter, Kindberg, Allainé and Swenson2010). For extinction, we considered the possible effect of the two anthropogenic covariates, human density and road length. We tested the possible effect of human density, roughness and forest cover on detection, as all three could potentially influence the accessibility of bear sign to observers. To account for the variability in subsection size we also included area as a covariate on detection in all models without submitting it to selection. In total, we fitted all possible 8,192 models.
Table 1 Definition of the environmental variables used for the occupancy analysis of brown bears Ursus arctos in the French Pyrenees, and the parameters for which an effect of the covariate was tested. Blank cells indicate the effect was not tested; +/− indicates the predicted sign of the effect of the covariate based on previous studies (see text for references).

Table 2 Model selection with time-varying covariates, with models ranked by the Akaike information criterion (AIC).

1ψ 1, initial occupancy probability; γ, colonization probability; ε, extinction probability; p, detection probability; year, year effect on the parameter, which relates to changes between primary occasions (i.e. from 1 year to another in our case); survey, survey effect on the parameter, which relates to the secondary occasions repeated within a year
2ΔAIC, difference between the AIC of the current model and that of the model with the lowest AIC
Given the uncertainty in the selection of the best set of covariates, we resorted to model-averaging for parameter estimation and inference (Burnham & Anderson, Reference Burnham and Anderson2002). Effect sizes were examined to determine the magnitude of a covariate effect (Nakagawa & Cuthill, Reference Nakagawa and Cuthill2007). The covariates were standardized prior to the analyses.
To assess any trend in habitat use over the years we estimated the occupancy status of each subsection for each year, and then tested a linear effect of year on the binary occupancy variable using a conditional autoregressive correlation model and an adjacency matrix between the subsections to specify the correlation matrix (Rousset & Ferdy, Reference Rousset and Ferdy2014). A likelihood ratio test was performed to assess the significance of this temporal trend. We applied this procedure to all models with ΔAIC < 2.
We compiled maps for initial occupancy, detection, colonization and extinction by calculating the probability for a given subsection using the model-averaged parameter estimates and the value of the covariates for the subsection.
Analyses were performed in R v. 3.3.0 (R Development Core Team, 2013), using the unmarked (Fiske & Chandler, Reference Fiske and Chandler2011), spaMM (Rousset & Ferdy, Reference Rousset and Ferdy2014), rgdal, AICcmodavg, classInt, RColorBrewer and spdep packages. The data and R codes are available at http://dx.doi.org/10.5281/zenodo.572637.
Results
Multistage model selection
We found no year or survey effects on any of the parameters ψ 1, γ, ε or p (Table 2). The ΔAIC of the next two best models (with a year effect on extinction and a survey effect on detection) was > 2, and therefore we used the model with constant parameters as the basic structure for the next step. Despite model uncertainty in the results of the selection procedure on environmental and anthropogenic covariates, some covariates were always included in models with ΔAIC < 2 (Table 3): roughness on detection and colonization probabilities, and human density on extinction and initial occupancy probabilities.
Table 3 Model selection, with environmental and anthropogenic covariates (Table 1). We report only models with ΔAIC < 2. The area of subsections was used in all models in the detection probability, and was not subject to the covariate selection procedure.
The effect of covariates on parameters
We refined the patterns found in the covariate selection step by examining the effect sizes (on the logit scale; Fig. 2). The effect of roughness on detection probability and that of human density on both extinction and initial occupancy probabilities were confirmed, but the colonization probability was not associated with any covariates. We investigated further the links between the covariates and initial occupancy, colonization, extinction and detection probabilities by inspecting the form of these relationships (after back-transformation; Fig. 3). An increase in roughness was associated with an increase in the detection probability, whereas it was more difficult to detect bears (when present) in large subsections (Fig. 3c, d). Initial occupancy was strongly negatively correlated with human density (Fig. 3a), with the least populated areas being more likely to be used by bears. Extinction was also negatively correlated with human density (Fig. 3b).
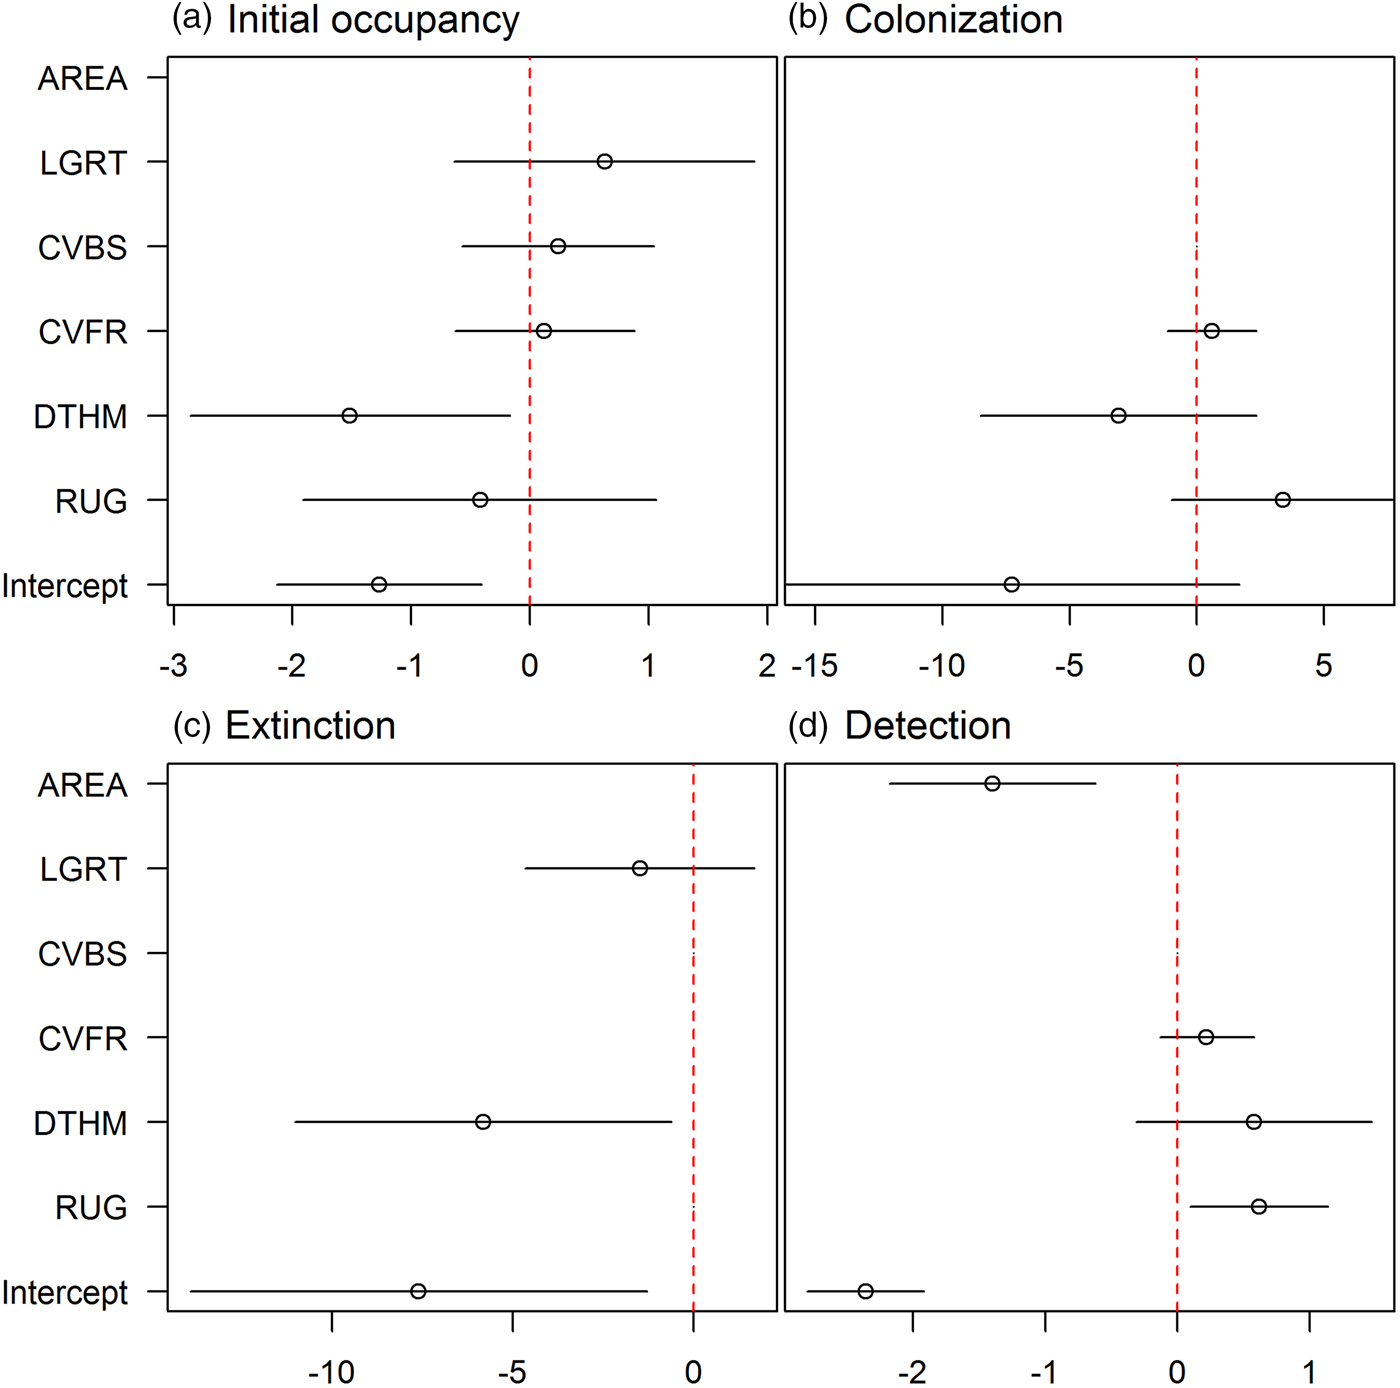
Fig. 2 Model-averaged parameter estimates (on the logit scale) and confidence intervals of the (standardized) covariates effects (see definitions in Table 1) on (a) initial occupancy, (b) colonization, (c) extinction and (d) detection probabilities. An effect does not appear if the corresponding covariate was not considered in the selection procedure. AREA was used in all models in the detection probability and was not subject to the covariate selection procedure.

Fig. 3 Relationships between model-averaged parameter estimates and the most important standardized covariates (based on the effect sizes in Fig. 2). The parameters of interest are on the y-axes: (a) initial occupancy, (b) extinction and (c–d) detection probabilities. The colonization probability is not displayed because of small effect sizes (see Supplementary Fig. S2 for the relationships between parameters and all covariates). For each relationship, we used the mean values of non-focal covariates. The dashes on the x-axes indicate the observed covariate values.
Distribution maps
The initial occupancy map (Fig. 4b) indicates two population cores (western and central), with the central core extending into south-east Ariège, south-west Aude and Pyrénées Orientales (Fig. 1). The extinction probability in the east of the central core was high (Fig. 4d), which is consistent with the disappearance of bears from that area (Camarra et al., Reference Camarra, Sentilles, Bombillon and Quenette2012), whereas the colonization probability in the same subsections was close to zero (Fig. 4c). Detection was higher in the central core than in the western core (Fig. 4a). The colonization map indicates that the western population core is more likely to expand to the east, whereas the central one is more likely to expand to the west (Fig. 4c), which is confirmed by yearly occupancy maps (Fig. 5). Occupancy in the west of the western population core (south-west of the Pyrénées Atlantiques) also decreased, while remaining constant in the east of that core (south-east of the Hautes Pyrénées). Overall, we detected a decrease in habitat use by the brown bear during 2008–2014 (P < 0.01 for all models in Table 3), with no new areas being colonized.

Fig. 4 Maps of the model parameters in the mountain subsections of the French Pyrenees, using the model-averaged parameter estimates and mean values of covariates: (a) detection probability, (b) initial occupancy probability, (c) colonization probability, and (d) extinction probability.

Fig. 5 Yearly occupancy probability (ψ t) of brown bears in mountain subsections of the French Pyrenees from t = 2008 to t = 2014, obtained using the model-averaged parameter estimates, mean values of the covariates, and the formula ψ t + 1 = (1 − ψ t)γ + ψ t(1 − ε) (MacKenzie et al., Reference MacKenzie, Nichols, Lachman, Droege, Royle and Langtimm2002).
Discussion
Environmental and anthropogenic effects on model parameters
Human density had a strong negative effect on initial occupancy probability, with the least densely populated areas being the most likely to be used by bears. This result confirms previous analyses suggesting that bears tend to live far from areas with intense human activity (Martin et al., Reference Martin, Basille, Van Moorter, Kindberg, Allainé and Swenson2010; Long et al., Reference Long, Donovan, MacKay, Zielinski and Buzas2011). Several factors, such as the habituation of bears to human presence (Wheat & Wilmers, Reference Wheat and Wilmers2016) or the need for female bears to shield themselves from sexual conflict (Steyaert et al., Reference Steyaert, Leclerc, Pelletier, Kindberg, Brunberg, Swenson and Zedrosser2016), may mitigate this effect, but the small size of the Pyrenean brown bear population limits the immediate relevance of these factors, as bears tend to disperse further at low densities, lowering the rate of encounter between individuals and the risk of sexually selected infanticide (Stoen et al., Reference Stoen, Zedrosser, Saebo and Swenson2006). These results confirm that anthropogenic effects supersede natural elements when it comes to habitat selection by brown bears (Nellemann et al., Reference Nellemann, Støen, Kindberg, Swenson, Vistnes and Ericsson2007).
Contrary to our expectation, human density was negatively correlated with the probability of extinction. A possible explanation is the influence of demographic stochasticity in small populations (Gabriel & Bürger, Reference Gabriel and Bürger1992), which gives more weight to extinction events (i.e. in a small population an extinction event may lead the entire population to collapse, which is not necessarily the case in a large population). Human density was lower in the south-east of Ariège and the south-west of Aude and Pyrénées Orientales (Supplementary Fig. S1) than it was in the other areas with high occupancy probability (Fig. 4b), and there were several local extinction events in 2010 and 2011 in these places with lower human density (Camarra et al., Reference Camarra, Sentilles, Bombillon and Quenette2012).
We found a positive correlation between the detection probability and roughness. A rougher terrain funnelling pathways of bears and people may explain this pattern. The same funnelling effect may explain why signs of bears were easier to detect (when the species was present) in small subsections than in large ones. Overall, species detection was imperfect and estimated to be < 0.6, thus confirming the need to correct for it to avoid underestimating occupancy.
Brown bear habitat use in the French Pyrenees
The occupancy maps of bears in the Pyrenees indicate the existence of two independent population cores, one in the west and another in the centre of the mountain range (Figs 4b & 5). The two cores remained unconnected during the timespan of the study. The dynamics of occupancy over the study period (Fig. 5) showed that habitat use decreased significantly overall. In particular, the extinction of the species in the eastern part of the central core is consistent with the absence of bear tracks in south-east Ariège and south-west Aude and Pyrénées Orientales (Fig. 1) since 2011 (Camarra et al., Reference Camarra, Sentilles, Bombillon and Quenette2012). These results demonstrate the usefulness of dynamic occupancy models in highlighting trends in habitat use that cannot be identified by static species distribution models (MacKenzie et al., Reference MacKenzie, Nichols, Hines, Knutson and Franklin2003).
That we found many subsections with a high occupancy probability in the western core despite the fact that only 2–3 bears were estimated to live there during 2008–2014 (Piédallu et al., Reference Piédallu, Quenette, Afonso, Bombillon, Gastineau and Jato2016b) suggests a violation of the closure assumption between our secondary occasions (July–November), because there were not enough bears in the population core to occupy all subsections at the same time. We estimated habitat use by brown bears instead of actual occupancy. For species that attack livestock, presence does not have to be permanent to be a source of conflict, and therefore habitat use remains a relevant indicator in the case of large carnivores, which are often characterized by relatively large home ranges (Gittleman & Harvey, Reference Gittleman and Harvey1982) and their use of large areas without actually occupying much land at any given time.
Implications for human–wildlife conflict mitigation
We anticipate that our results will contribute to the scientific evidence that is required for conflict mitigation (Redpath et al., Reference Redpath, Young, Evely, Adams, Sutherland and Whitehouse2013). Attacks on livestock are one of the main causes of negative attitudes towards carnivore presence in general (Kaczensky et al., Reference Kaczensky, Blazic and Gossow2004; Sponarski et al., Reference Sponarski, Semeniuk, Glikman, Bath and Musiani2013) and towards brown bears in the Pyrenees in particular (Piédallu et al., Reference Piédallu, Quenette, Mounet, Lescureux, Borelli-Massines and Dubarry2016a). There is an interest in mapping the areas that are more likely to host bears now and in the future, and the likely hotspots for attacks (Miller, Reference Miller2015). This could be combined with mapping attitudes towards brown bears (Piédallu et al., Reference Piédallu, Quenette, Mounet, Lescureux, Borelli-Massines and Dubarry2016a) to identify areas that combine positive attitudes towards bear presence and low risk of attack, which could be primary targets of future management decisions. This could be the first step towards the development of socio-ecological models designed to mitigate human–wildlife conflicts (Aswani, Reference Aswani2011; Dupont et al., Reference Dupont, Mihoub, Becu and Sarrazin2011; Estoque & Murayama, Reference Estoque and Murayama2014).
Acknowledgements
We are grateful to the volunteers of the Brown Bear Network and the French Game and Wildlife Agency Bear Team for collecting and sharing data and knowledge on Pyrenean brown bears. We also thank Jodie Martin for useful discussions, and two referees and the Oryx editorial team for their inputs.
Author contributions
BP, PYQ and OG conceived and designed the research and wrote the article. BP, NB, AG, CM and PYQ performed the experiments. BP and OG analysed the data.
Biographical sketches
Blaise Piédallu is a population ecologist who is interested in human–wildlife conflict, with a focus on large carnivores. Pierre-Yves Quenette is an ecologist and leads the French Game and Wildlife Agency's brown bear programme. Nicolas Bombillon is an ecologist with an interest in wildlife conservation. Adrienne Gastineau is an ecologist with an interest in the behaviour of large carnivores. Christian Miquel is a population geneticist interested in promoting non-invasive monitoring methods. Olivier Gimenez is a biostatistician with an interest in the population dynamics of large carnivores.


 Open access