“So, there are 6 cardinal colours: Yellow, Red, Orange, Green, Blue, and Purple.
And there are 3,000 shades.
And if you take these 3,000 and divide them by 6, you come up with 500.
Meaning that there are at least 500 shades of The Blues.”
H20 Gate Blues, Gil Scott-Heron
When faced with a complex systems of inter-related equations, economists are used to undertaking perturbation analysis in order to understand key relationships, in which we shock the economic system and trace out the effects on certain variables. We may be interested in whether the system is stable, in plotting its return to equilibrium, or in the dynamics of how variables respond or jump from one resting point to some other. The decision first to hold a Referendum and then the decision to Leave the European Union have certainly shocked our economic and political settlement. The question is whether the Referendum shock has simply revealed something about the system or may go further and act to undermine its fundamentals. In the Economic Prospects section of this Review we present the National Institute's estimates of the consequences of the Referendum, and as indicated in our May Review,Footnote 1 we continue to expect a slowdown in overall economic activity following the Leave vote and a period of heightened uncertainty that will act to bear down further on activity in the UK and, to a lesser extent, abroad.
The shock
The first collective response to the Referendum result was a palpable emergence of the blues in many metropolitan quarters – in contrast perhaps to the delight in many other regions. The political and economic establishment had uniformly advised that leaving the EU was likely to damage the economy in the long run and have short-run consequences that may be hard to manage. And yet on a turnout of 72.2 per cent from a total electorate of 46.5 million, there were 16.1 million (48.1 per cent) votes for Remain and 17.4 million (51.9 per cent) for Leave.Footnote 2 Despite the marginal overall victory, nine of the twelve regions in the UK voted Leave. Clearly even if the average was going to be badly affected, most voters felt that the average did not apply to them or that the economic risk of leaving the EU was worth taking.Footnote 3
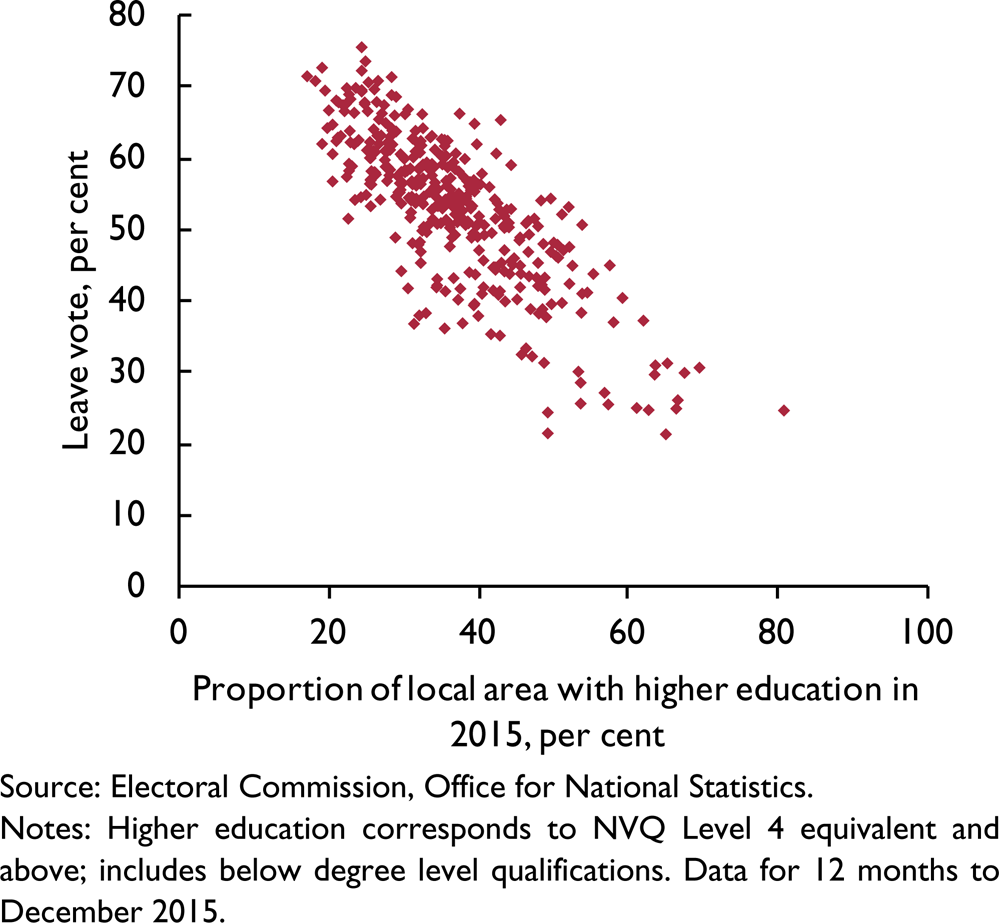
The Institute is trying to understand the economic factors behind the voting patterns and will return to this issue in the November Review but one reasonably clear negative association shown in figure 1 is between the fraction of the population in 380 local areas with higher education qualifications (of those aged 16–64) and the fraction of the population voting Leave. We need to interpret this negative correlation with great care – as it is a simple bivariate relationship – so in the same way that a Vote for Leave may represent many economic, political and social motivations, our measurement of the level of higher education qualifications may be telling us as much about income, opportunity and access. But to the extent that levels of education attainment may tell something about an individual's opportunities, the vote to leave may be then telling us that many do not share that same sense of opportunity.Footnote 4
Figure 1. Leave vote and higher education
The morning after the Referendum, the Prime Minister, David Cameron, announced his intention to resign once a successor had been located, probably in the autumn. As it turned out Theresa May assumed office on 13 July, rather more quickly than anticipated. But nevertheless measures of economic confidence seemed to move sharply down and measures of uncertainty sharply up.Footnote 5 In part, this may be because of lack of clarity in the preferences of the new Cabinet and the lack of an especially effective Opposition at present.
Exit, uncertainty and the economy
Indeed many of the off-model issues connected with the question of a UK exit from the European Union involve what economists term Knightian uncertainty. For example, it is hard to predict what future trading relationships will be, or what the immigration rules will be but also we do not know what economic and political reactions of other countries might be or exactly how the City will be treated,Footnote 6 or whether there may be moves by groups within other countries also to leave the EU. Indeed the process of exit may itself impart a shock and lead to a contagion or even a ‘sudden stop’.Footnote 7 That is to say there is a lump of issues about which it is quite hard to gain numerical probability measures but that we know are thrown open by a possible exit from the EU. Some of the quantitative aspects of uncertainty can be explored with economic uncertainty indices. These indices seem to have some explanatory power for business cycle fluctuations and so it seems probable that heightened and sustained uncertainty will cause delay in investment and some consumption plans. The picture that emerges is rather clear: there are measurable economic risks to an exit from the EU, the balance of those risks seem skewed to the downside and any prolonged uncertainty will tend to shift the whole distribution even further to the downside.
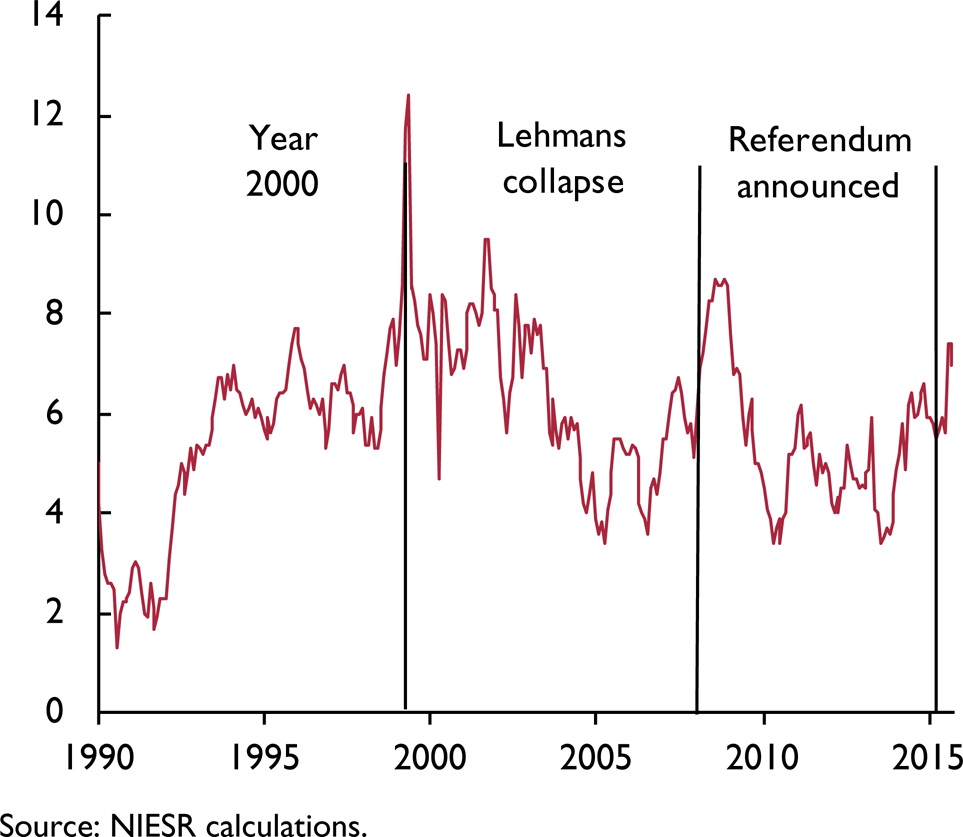
Accordingly, the immediate response of many survey measures of the economy has been to go into a tailspin – measures of consumer confidence, business investment plans and leading indicators of house prices have fallen sharply. Indeed, as a further sign of the blues, figure 2 suggests people are turning to holding notes and coins, with the growth rate in those holdings considerably greater than that of income.Footnote 8 As all serious economists warned: a vote to the leave the EU would increase significantly the probability of a recession. For example, when publishing economic forecasts, NIESR can represent risk arising from uncertainty by wrapping point forecasts of output within a set of confidence intervals. These confidence intervals are derived by subjecting the global econometric model, NiGEM, to a series of historical shocks drawn at random from the set of historical residuals on the model's equations. Repeating the simulations with different random shocks enables us to calculate the probability of different outcomes. This approach assumes not that the future will be like the past but that shocks in the future will be similar to those from the past.Footnote 9
Figure 2. Year-on-year growth in notes and coins in circulation
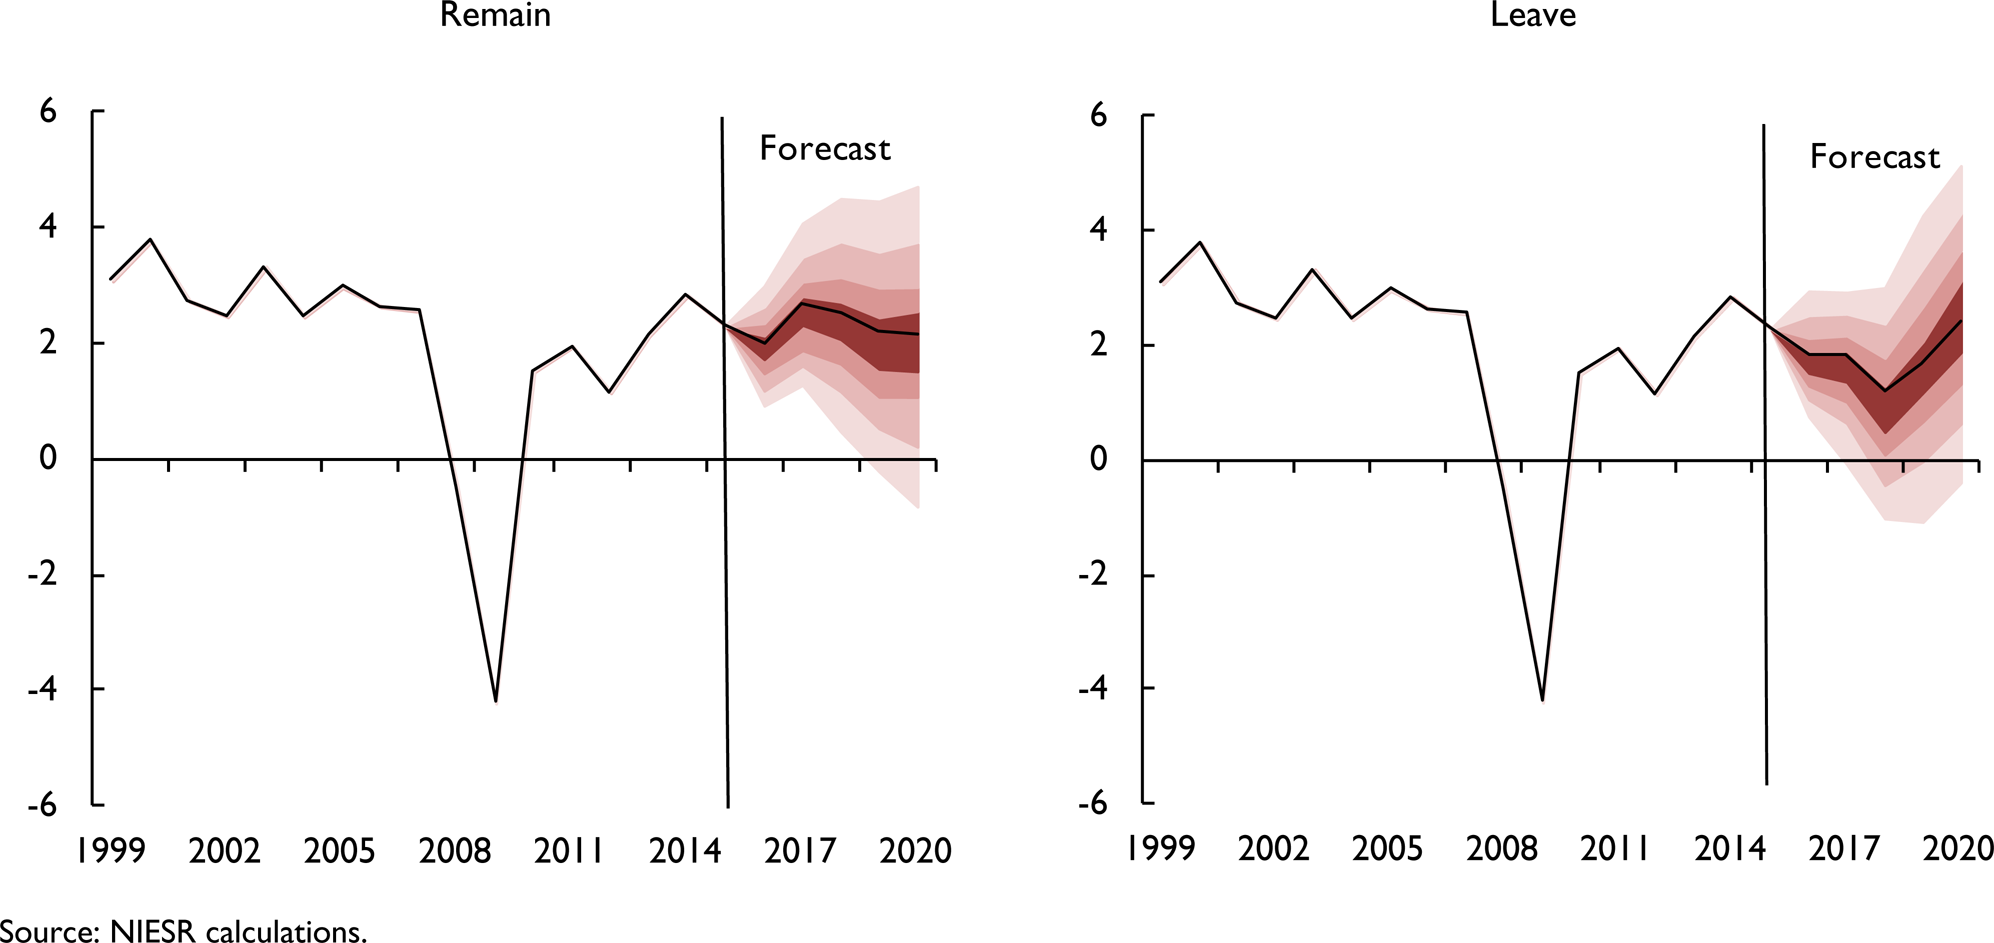
We can then show how the most likely path of output under Remain or Leave would have evolved but also, taking into account the shocks, the changing structure of trade and policy responses, and thus what the density of that forecast looks like. And we can see that on exit we may be entering a world with more variable income flows. Figure 3 suggests that the probability of a full year's decline in 2017 has increased from under 5 per cent in May under a Remain vote to at least 15 per cent following the Leave vote.Footnote 10
Figure 3. The GDP distribution under Remain or Leave
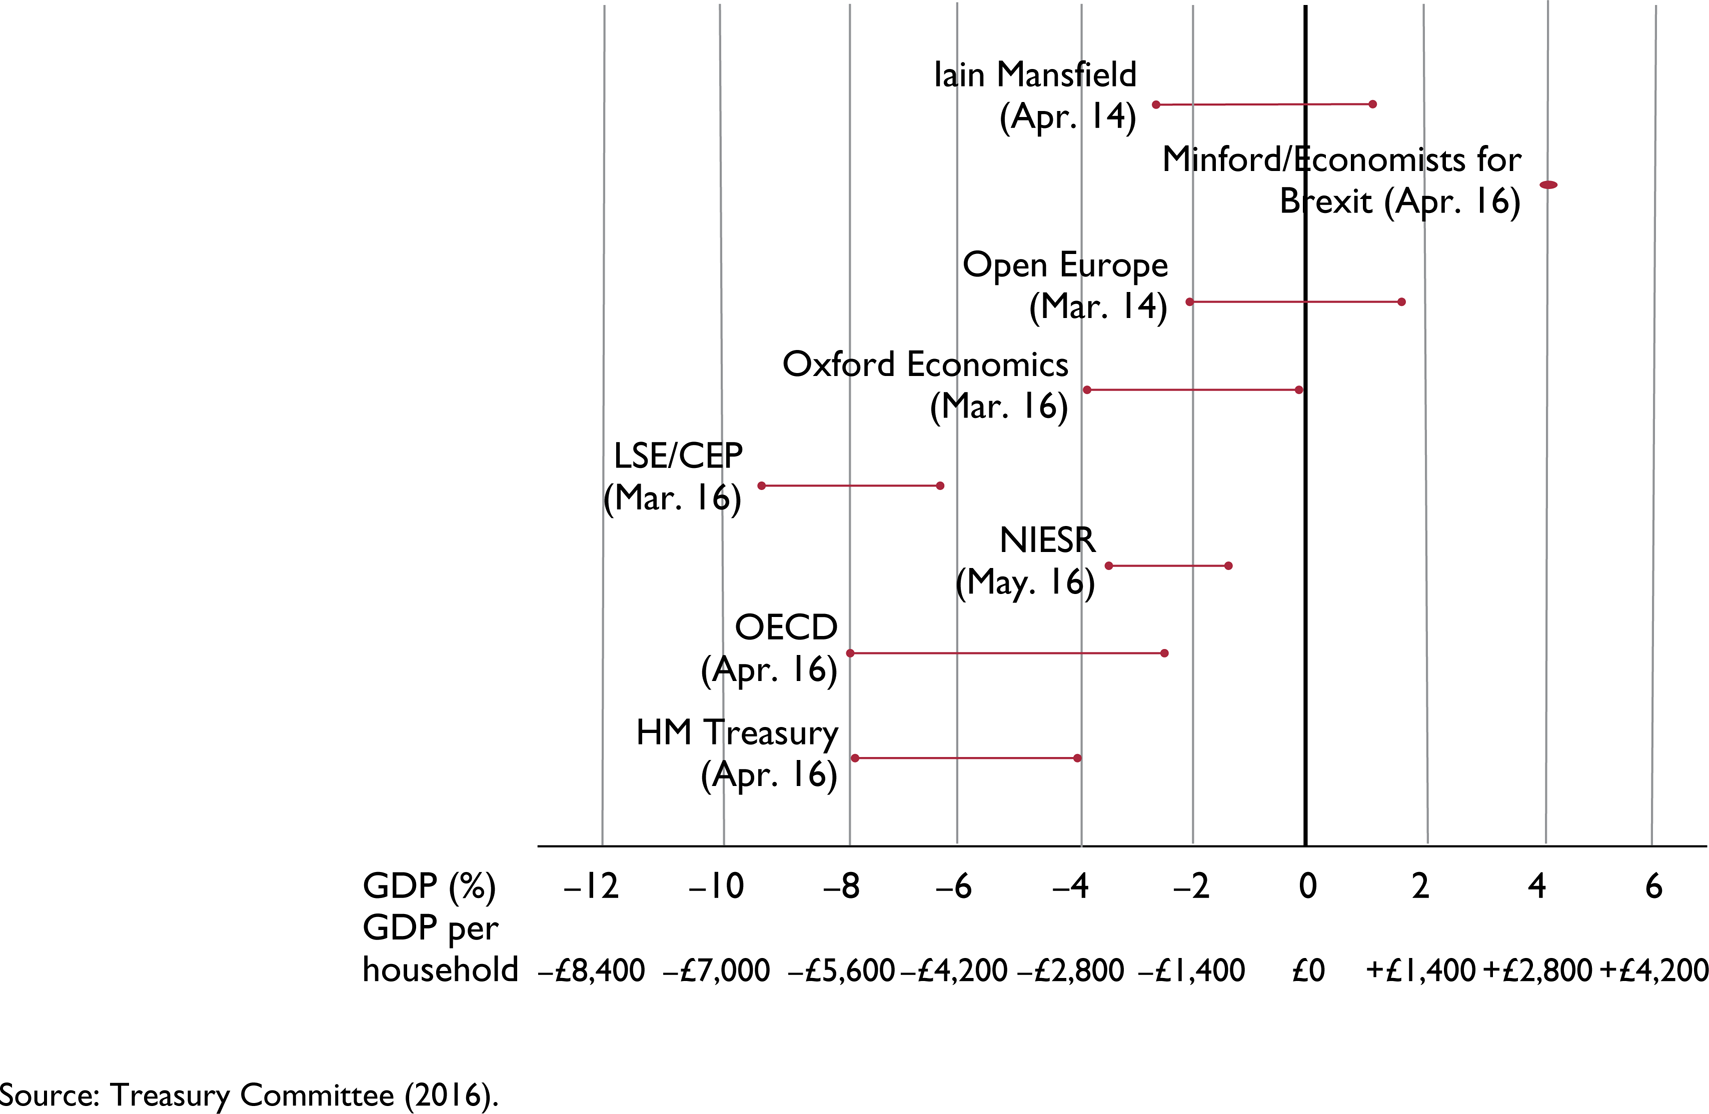
Figure 4. Recent estimates of the long-term impact of leaving the EU on UK GDP
This short-run impact on demand forms part of the adjustment to a longer-run impact on the supply side. And I reproduce a figure from the Treasury Committee's (2016) report and note that there is a broad consensus that the long-run economic costs of leaving the EU are likely to be significant.Footnote 11 Unless we think there has been some informational herding or group think, we should place a lot of weight on the central point of these estimates – particularly the median as it is unlikely to have been reached with an intention to signal rather than inform.Footnote 12 Overall we shall have to monitor carefully the economic news and judge it carefully against the expectation of an economic slowdown.
Policy levers
Given these expected paths for output, the standard levers of stabilisation policy are likely to be pulled. The government has already indicated that the fiscal charter that required a budget balance by the end of this parliament will be amended or dropped and the Bank of England has provided forward guidance about looser monetary policy. We can expect a clearer set of statements about policy responses once more data has become available and we look forward to the Autumn Statement. But given the projections in the May ReviewFootnote 13 and in this Review we can expect more public debt to be issued and Bank Rate to be nudged down, as well as possibly some more purchases of government and, possibly, corporate bonds as well as an expansion of Funding for Lending.Footnote 14 It is, though, quite possible to argue that the levers have limited room for manoeuvre; despite a growing economy since 2010, we have continued to run fiscal deficits and seven years of Bank Rate at 0.5 per cent signals anything other than normality.
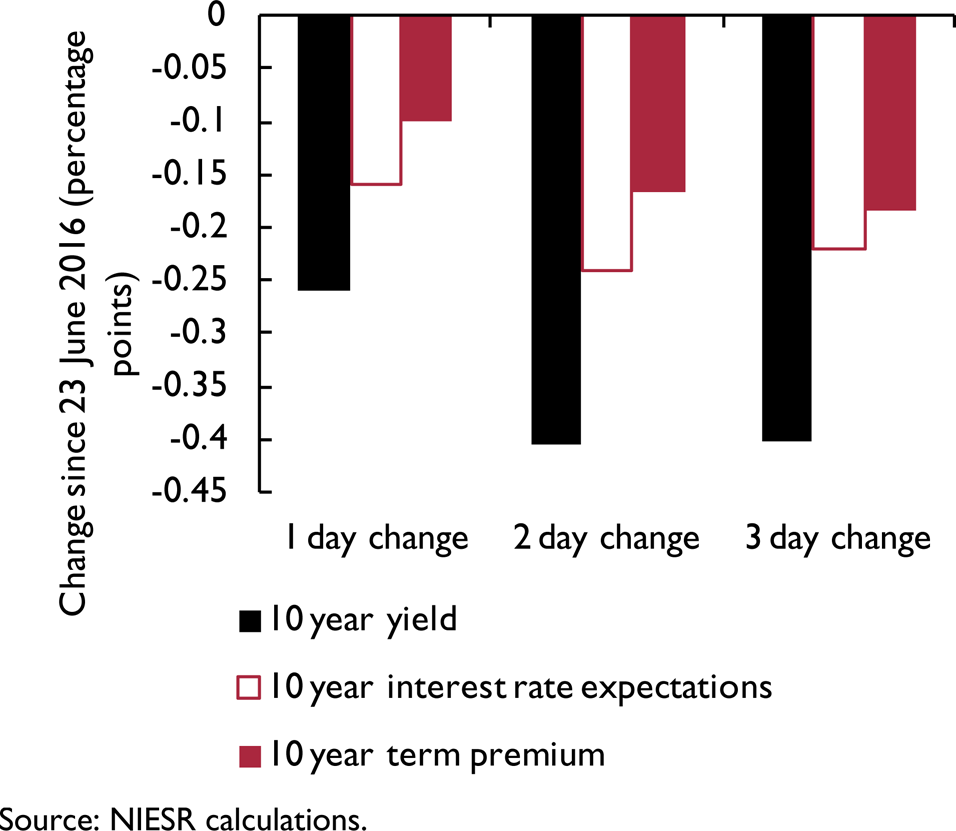
So what should we do? Financial market prices provide important clues. The exchange rate is down 9 per cent and bank share prices are down by 8 per cent while the price of UK government debt is up, which means that the present value of claims on future taxpayers has gone up. The exchange rate move has reduced the risk faced by exporters, whilst warning that our banks, qua domestic economy, look rather vulnerable, and has also given a prompt to the UK government that there is a significant world appetite for (relatively) safe assets. Figure 5 illustrates our estimates that around half the fall in government bond yields can be accounted for by expectations of a looser stance for Bank Rate and around half by a reduction in term premia. This surprising finding, if sustained, implies that despite the economic risk of an exit from the EU and the changes in credit status, financial markets continue to have an appetite for holding UK debt.Footnote 15
Figure 5. Changes in UK sovereign bond yields
A further clue is provided by the intellectual journey taken by policymakers since 2007–8, in that less attention has been placed on the average but more on dealing with the tails of the distribution. This point has been pursued by the Financial Policy Committee of the Bank of England, which has tried to set capital and liquidity requirements in such a manner that large shocks are less likely to affect the economy. It is, for example, important that any shock related to exit from the European Union is not amplified by a negative shock to the supply of loanable funds and that depleted confidence does not simultaneously reduce demand for funds. One reason is that in the event of such an amplification, lower income families might tend to be more negatively affected, particularly if low productivity and tighter credit conditions impinge on their household budget constraints.Footnote 16
Is public debt the answer?
When there is the kind of uncertainty we are currently experiencing, the issuance of public debt can reduce overall risk in the economy. Financial instruments and trade can help the sharing of risk under uncertainty and, to the extent that intra-temporal (across the current set of households) contracts may not be complete and intertemporal (with future households) risk sharing may be limited, we may need to re-think government policy on debt. Obviously, economic policy per se might also be thought of as a way of risk sharing. Increasing public debt in the form of fiscal policy may allow impoverished households today to borrow from the taxes of future generations. Lower interest rates, from monetary policy, may allow the same set of impoverished households, possibly through government debt contracts, to borrow more cheaply from their own future richer selves. In this context, even movements in the exchange rate can be thought of as risk sharing because when sterling depreciates, we invite foreigners to buy our goods and so provide some positive payoffs to UK firms. But we also know that the issuance of index-linked bonds can help the private sector manage inflation risk and the issuance of long-term debt may play a role in developing longer-term planning horizons.Footnote 17 It may therefore now also be time for the Treasury to reconsider how it manages risk through its issuance of type and quantity of public debt. Bonds of longer maturities than 50 years and also bonds that pay interest rates proportional to GDP growth may help us deal with sharp changes in our structure of trade.Footnote 18 The question is whether the government should now issue bonds and use the money to develop long-term investment projects that yield a rate of return for those parts of the country that felt the Left Behind Blues.


“So, there are 6 cardinal colours: Yellow, Red, Orange, Green, Blue, and Purple.
And there are 3,000 shades.
And if you take these 3,000 and divide them by 6, you come up with 500.
Meaning that there are at least 500 shades of The Blues.”
H20 Gate Blues, Gil Scott-Heron
When faced with a complex systems of inter-related equations, economists are used to undertaking perturbation analysis in order to understand key relationships, in which we shock the economic system and trace out the effects on certain variables. We may be interested in whether the system is stable, in plotting its return to equilibrium, or in the dynamics of how variables respond or jump from one resting point to some other. The decision first to hold a Referendum and then the decision to Leave the European Union have certainly shocked our economic and political settlement. The question is whether the Referendum shock has simply revealed something about the system or may go further and act to undermine its fundamentals. In the Economic Prospects section of this Review we present the National Institute's estimates of the consequences of the Referendum, and as indicated in our May Review,Footnote 1 we continue to expect a slowdown in overall economic activity following the Leave vote and a period of heightened uncertainty that will act to bear down further on activity in the UK and, to a lesser extent, abroad.
The shock
The first collective response to the Referendum result was a palpable emergence of the blues in many metropolitan quarters – in contrast perhaps to the delight in many other regions. The political and economic establishment had uniformly advised that leaving the EU was likely to damage the economy in the long run and have short-run consequences that may be hard to manage. And yet on a turnout of 72.2 per cent from a total electorate of 46.5 million, there were 16.1 million (48.1 per cent) votes for Remain and 17.4 million (51.9 per cent) for Leave.Footnote 2 Despite the marginal overall victory, nine of the twelve regions in the UK voted Leave. Clearly even if the average was going to be badly affected, most voters felt that the average did not apply to them or that the economic risk of leaving the EU was worth taking.Footnote 3
The Institute is trying to understand the economic factors behind the voting patterns and will return to this issue in the November Review but one reasonably clear negative association shown in figure 1 is between the fraction of the population in 380 local areas with higher education qualifications (of those aged 16–64) and the fraction of the population voting Leave. We need to interpret this negative correlation with great care – as it is a simple bivariate relationship – so in the same way that a Vote for Leave may represent many economic, political and social motivations, our measurement of the level of higher education qualifications may be telling us as much about income, opportunity and access. But to the extent that levels of education attainment may tell something about an individual's opportunities, the vote to leave may be then telling us that many do not share that same sense of opportunity.Footnote 4
Figure 1. Leave vote and higher education
The morning after the Referendum, the Prime Minister, David Cameron, announced his intention to resign once a successor had been located, probably in the autumn. As it turned out Theresa May assumed office on 13 July, rather more quickly than anticipated. But nevertheless measures of economic confidence seemed to move sharply down and measures of uncertainty sharply up.Footnote 5 In part, this may be because of lack of clarity in the preferences of the new Cabinet and the lack of an especially effective Opposition at present.
Exit, uncertainty and the economy
Indeed many of the off-model issues connected with the question of a UK exit from the European Union involve what economists term Knightian uncertainty. For example, it is hard to predict what future trading relationships will be, or what the immigration rules will be but also we do not know what economic and political reactions of other countries might be or exactly how the City will be treated,Footnote 6 or whether there may be moves by groups within other countries also to leave the EU. Indeed the process of exit may itself impart a shock and lead to a contagion or even a ‘sudden stop’.Footnote 7 That is to say there is a lump of issues about which it is quite hard to gain numerical probability measures but that we know are thrown open by a possible exit from the EU. Some of the quantitative aspects of uncertainty can be explored with economic uncertainty indices. These indices seem to have some explanatory power for business cycle fluctuations and so it seems probable that heightened and sustained uncertainty will cause delay in investment and some consumption plans. The picture that emerges is rather clear: there are measurable economic risks to an exit from the EU, the balance of those risks seem skewed to the downside and any prolonged uncertainty will tend to shift the whole distribution even further to the downside.
Accordingly, the immediate response of many survey measures of the economy has been to go into a tailspin – measures of consumer confidence, business investment plans and leading indicators of house prices have fallen sharply. Indeed, as a further sign of the blues, figure 2 suggests people are turning to holding notes and coins, with the growth rate in those holdings considerably greater than that of income.Footnote 8 As all serious economists warned: a vote to the leave the EU would increase significantly the probability of a recession. For example, when publishing economic forecasts, NIESR can represent risk arising from uncertainty by wrapping point forecasts of output within a set of confidence intervals. These confidence intervals are derived by subjecting the global econometric model, NiGEM, to a series of historical shocks drawn at random from the set of historical residuals on the model's equations. Repeating the simulations with different random shocks enables us to calculate the probability of different outcomes. This approach assumes not that the future will be like the past but that shocks in the future will be similar to those from the past.Footnote 9
Figure 2. Year-on-year growth in notes and coins in circulation
We can then show how the most likely path of output under Remain or Leave would have evolved but also, taking into account the shocks, the changing structure of trade and policy responses, and thus what the density of that forecast looks like. And we can see that on exit we may be entering a world with more variable income flows. Figure 3 suggests that the probability of a full year's decline in 2017 has increased from under 5 per cent in May under a Remain vote to at least 15 per cent following the Leave vote.Footnote 10
Figure 3. The GDP distribution under Remain or Leave
Figure 4. Recent estimates of the long-term impact of leaving the EU on UK GDP
This short-run impact on demand forms part of the adjustment to a longer-run impact on the supply side. And I reproduce a figure from the Treasury Committee's (2016) report and note that there is a broad consensus that the long-run economic costs of leaving the EU are likely to be significant.Footnote 11 Unless we think there has been some informational herding or group think, we should place a lot of weight on the central point of these estimates – particularly the median as it is unlikely to have been reached with an intention to signal rather than inform.Footnote 12 Overall we shall have to monitor carefully the economic news and judge it carefully against the expectation of an economic slowdown.
Policy levers
Given these expected paths for output, the standard levers of stabilisation policy are likely to be pulled. The government has already indicated that the fiscal charter that required a budget balance by the end of this parliament will be amended or dropped and the Bank of England has provided forward guidance about looser monetary policy. We can expect a clearer set of statements about policy responses once more data has become available and we look forward to the Autumn Statement. But given the projections in the May ReviewFootnote 13 and in this Review we can expect more public debt to be issued and Bank Rate to be nudged down, as well as possibly some more purchases of government and, possibly, corporate bonds as well as an expansion of Funding for Lending.Footnote 14 It is, though, quite possible to argue that the levers have limited room for manoeuvre; despite a growing economy since 2010, we have continued to run fiscal deficits and seven years of Bank Rate at 0.5 per cent signals anything other than normality.
So what should we do? Financial market prices provide important clues. The exchange rate is down 9 per cent and bank share prices are down by 8 per cent while the price of UK government debt is up, which means that the present value of claims on future taxpayers has gone up. The exchange rate move has reduced the risk faced by exporters, whilst warning that our banks, qua domestic economy, look rather vulnerable, and has also given a prompt to the UK government that there is a significant world appetite for (relatively) safe assets. Figure 5 illustrates our estimates that around half the fall in government bond yields can be accounted for by expectations of a looser stance for Bank Rate and around half by a reduction in term premia. This surprising finding, if sustained, implies that despite the economic risk of an exit from the EU and the changes in credit status, financial markets continue to have an appetite for holding UK debt.Footnote 15
Figure 5. Changes in UK sovereign bond yields
A further clue is provided by the intellectual journey taken by policymakers since 2007–8, in that less attention has been placed on the average but more on dealing with the tails of the distribution. This point has been pursued by the Financial Policy Committee of the Bank of England, which has tried to set capital and liquidity requirements in such a manner that large shocks are less likely to affect the economy. It is, for example, important that any shock related to exit from the European Union is not amplified by a negative shock to the supply of loanable funds and that depleted confidence does not simultaneously reduce demand for funds. One reason is that in the event of such an amplification, lower income families might tend to be more negatively affected, particularly if low productivity and tighter credit conditions impinge on their household budget constraints.Footnote 16
Is public debt the answer?
When there is the kind of uncertainty we are currently experiencing, the issuance of public debt can reduce overall risk in the economy. Financial instruments and trade can help the sharing of risk under uncertainty and, to the extent that intra-temporal (across the current set of households) contracts may not be complete and intertemporal (with future households) risk sharing may be limited, we may need to re-think government policy on debt. Obviously, economic policy per se might also be thought of as a way of risk sharing. Increasing public debt in the form of fiscal policy may allow impoverished households today to borrow from the taxes of future generations. Lower interest rates, from monetary policy, may allow the same set of impoverished households, possibly through government debt contracts, to borrow more cheaply from their own future richer selves. In this context, even movements in the exchange rate can be thought of as risk sharing because when sterling depreciates, we invite foreigners to buy our goods and so provide some positive payoffs to UK firms. But we also know that the issuance of index-linked bonds can help the private sector manage inflation risk and the issuance of long-term debt may play a role in developing longer-term planning horizons.Footnote 17 It may therefore now also be time for the Treasury to reconsider how it manages risk through its issuance of type and quantity of public debt. Bonds of longer maturities than 50 years and also bonds that pay interest rates proportional to GDP growth may help us deal with sharp changes in our structure of trade.Footnote 18 The question is whether the government should now issue bonds and use the money to develop long-term investment projects that yield a rate of return for those parts of the country that felt the Left Behind Blues.