

United States
Although US quarterly GDP growth slowed from an annualised pace of 4.2 per cent in the second quarter to 3.4 per cent in the third quarter of last year, this latter still marked a rapid pace for growth and one that we expect is not sustainable. A slowing in investment spending, particularly on structures and residential construction, was largely responsible for the drop in growth in the third quarter, with year-on-year consumer spending growth still over 3 per cent. The labour market has continued to be strong, with total nonfarm payroll employment expanding by 312,000 in December, compared to an average increase of 205,000 a month over the previous 6 months. The unemployment rate has been relatively stable, having fallen to 3.9 per cent in December from 4.1 per cent a year earlier, and the participation rate has edged up.
With the fiscal stimulus boosting growth last year, we expect economic growth to have been very close to 3 per cent. But, with the momentum from the fiscal boost fading, policy interest rates higher than a year ago, and the pace of output growth running faster than potential, we expect GDP growth this year to slow a little to 2.5 per cent, with a further reduction in pace in 2020 to 2.2 per cent. Despite this slowing, we expect that the pattern of US growth outpacing the aggregate of the other G7 economies will continue.
An important near-term uncertainty in the US is the likely effect on the economy of the shutdown of certain government functions as a result of the political impasse over the funding of the wall between the US and Mexico. Around 800,000 federal employees have been directly affected, and external contractors have been affected too. The overall effect on the economy in the first quarter of the shutdown is uncertain but estimates range up to a loss of 0.1 per cent of GDP growth per week, from effects as diverse as fewer visits to national parks and fewer small business administration loans being processed. As a result we anticipate GDP growth of less than 2 per cent in the first quarter, but there would likely be some compensating effects once employees are paid.
While the continued expansion may have contributed to a slight pick-up in inflation, the core personal consumption expenditure price deflator has remained around the 2 per cent target rate (figure 8). The concern that output growth running above potential will increase capacity utilisation, start to create labour shortages and raise inflation has not been realised to date. After the tightening of monetary policy in the past two years, with policy rates at 2.25–2.50 per cent, real interest rates are now only just positive. The reduction in oil prices is likely to help to keep inflation very close to the 2 per cent rate this year and, with economic growth slowing, the outlook for a further policy rate tightening has become more limited.

Figure 8. US: Inflation
As the final quarter of 2018 progressed, US financial markets became volatile, concerned about the pace of US policy interest rate increases (there were three 25 basis point increases in 2017 and four in 2018), and about the possibility of a sharp slowdown or even a recession. These concerns reflect risk issues discussed in previous Reviews about the relatively high level of equity prices, the flattening of the yield curve, and the uncertainty and reduced trade caused by the tariff changes. In the face of falls in equity markets, while the Federal Reserve increased its policy rate on 19 December it provided a more dovish signal for the year ahead which has soothed markets somewhat.
However, the prolonged expansion (which looks set to become the longest on record this year according to the National Bureau of Economic Research business cycle dates) and the reduced yield curve spread have started to create some nervousness about the likelihood of recession in the next few years, despite research indicting that expansions do not die of old age (Reference LenoelLenoel, 2018; Reference RudebuschRudebusch, 2016).Footnote 5
The possible effects from the tariff impositions remain a source of both uncertainty and downside risk for the US (and global) economy, as illustrated in figure 9. While job creation remains strong, and consumer confidence is running at a high level, the prolonged government shutdown will have a dampening effect on growth in the first quarter and export growth is slowing. A combination of increased tariffs and a slower than anticipated pace of growth in China could well threaten the projected gradual slowdown, especially if tariff increases lead to a large pass-through to domestic inflation.

Figure 9. US: Annual GDP growth fan chart
Canada
Canada's GDP grew by 0.5 per cent in the third quarter of 2018, down from 0.7 per cent in the second quarter. Consumer price inflation decreased sharply from a peak of 3 per cent in July 2018 to 1.7 per cent in November and 2 per cent in December, driven by a decrease in gasoline prices. Core inflation (which excludes gasoline) was at 1.9 per cent in November, very close to the Bank of Canada's objective of 2 per cent, suggesting that there is no urgent need for the Governing Council to change its policy rate, which currently stands at 1.75 per cent. We forecast GDP growth of 2 and 1.9 per cent in 2018 and 2019 respectively, after 3 per cent in 2017, as growth slows to a more sustainable pace. Inflation is projected to stay around 2 per cent over the forecast horizon.
Household consumption grew in the third quarter of 2018 at 0.3 per cent, the slowest quarterly growth rate since the first quarter of 2016, as households’ real personal disposable income was negatively affected by both a surge in consumer prices and an increase in borrowing rates. Households’ savings rate, which represents the proportion of disposable income that remains after spending, fell to 0.8 per cent in the third quarter of 2018, revisiting the lows of early 2016 and 2017 (figure 10). Following a data revision, the savings rate averaged 1.4 per cent in the first three quarters of 2018, compared to a previous estimate of 3.6 per cent.

Figure 10. Canada: Household sector savings rate
The risk of a downturn in the housing market that we discussed in the last Review has started to materialise. Statistics Canada's New House Price index in November 2018 was at the same level as in November 2017, compared to a growth rate of 3.4 per cent a year previously (figure 11). Further increases in interest rates could risk a more pronounced downturn in the housing market as the household debt-to-income ratio is high at 170 per cent.

Figure 11. Canada: Change in house prices
As a net exporter of oil, Canada's economy is expected to suffer from the decline in oil prices that occurred in the fourth quarter of 2018. Lower oil prices lead to a decrease in Canada's terms of trade, which in turn reduces domestic income and wealth. The Bank of Canada (2019) has estimated that lower oil prices could reduce GDP growth by about 0.5 per cent by 2020. To support domestic oil prices, Alberta Premier Rachel Notley announced an oil production cut of 325,000 bpd starting in January 2019 which should support the Canadian oil price, but it would negatively affect the production sector.
Euro Area
After stronger GDP growth than widely expected in late 2016 and through 2017, growth in the first half of 2018 in the Euro Area, at 0.4 per cent each quarter, showed a widespread weakening, but only to a pace that was close to the anticipated trend rate. In the third quarter that pace fell further, to 0.2 per cent, the weakest since mid-2014, and two major economies, Germany and Italy, recorded falls in GDP in the quarter. Within the third quarter total, output growth in the Netherlands fell to 0.2 per cent (from 0.7 per cent) and Portugal saw 0.3 per cent (from 0.6 per cent). While the slowdown was generalised, the drop in German GDP growth (from 0.5 per cent to a fall of 0.2 per cent) was the most dramatic contributor to the overall slowdown.
Investment spending had been particularly strong in the second quarter of 2018 (growing by 1.6 per cent) and this fell back to 0.7 per cent, giving annual growth of 3.1 per cent. Quarterly consumer spending growth weakened only a little, dropping from 0.2 per cent to 0.1 per cent, and annual growth fell from 1.4 per cent to 1.0 per cent. After 1.2 per cent growth in exports of goods and services in the second quarter, there was a fall of 0.1 per cent in the third quarter, which also contributed to the slowing in GDP. At this stage it is uncertain how far uncertainty over trade policies with the US and the specific tariffs already introduced has affected exports.
While there are some particular factors underlying the fall in GDP in Germany, the industrial production figures for the fourth quarter show continued weakness. This, given the importance of the size of the German economy in the Euro Area, and that annual growth fell to 1.6 per cent in the third quarter, suggests that Euro Area growth will have fallen from 2.5 per cent in 2017 to close to 2 per cent in 2018, with the prospect of a further slowing to 1.7 per cent in 2019. With the ECB having now ended its quantitative easing purchases of assets, monetary policy is less accommodative but still provides support for the economy, with the ECB having no stated aim of ‘normalising’ interest rates. Indeed, in June 2018 it noted that “the Governing Council expects the key ECB interest rates to remain at their present levels at least through the summer of 2019” (ECB, 2018). This approach is not, of course, irrespective of how inflation progresses.
Consumer price inflation was 1.6 per cent in the twelve months to December, slightly above the 1.4 per cent reading a year earlier but lower than the 2.1 per cent recorded in July 2018. Our expectation is that inflation will continue to remain close to its 2 per cent target but generally below it, aided in the near term by the reduction in oil prices. If domestic price pressures, particularly from faster average earnings growth, build, then there could be an over-shoot of the 2 per cent target, which, depending on the precise conditions, could lead the ECB to raise policy interest rates in response to cool inflationary pressures.
Hourly labour costs rose by 2.5 per cent in the Euro Area in the third quarter of last year, up from an annual increase of 1.8 per cent a year earlier, and the fastest annual increase since 2011. The faster pace reflects a pick-up in annual wage growth, from 1.7 per cent in the third quarter of 2017 to 2.4 per cent in the third quarter of 2018. We anticipate this process having further to run, with tighter labour market pressures, and average earnings growth to be around 3 per cent a year in the medium term.
Demographic trends and an assumption of continued relatively slow productivity growth indicate that Euro Area growth should slow further in the medium term, with growth of just under 1.5 per cent a year (figure 12). With inflation expected to remain close to the 2 per cent target, beyond 2020, a very gradual path of rate rises is anticipated into the medium term, broadly in line with market expectations.

Figure 12. Euro Area: GDP growth and inflation
Germany
Troubles in the car-producing sector served as an alarm bell for the German economy in the second half of 2018. Problems with the certification of new cars for the EU market reduced car production in the year to September by 7.9 per cent relative to the same period in the previous year. Car exports were down 7.2 per cent. Given the size of the German car and car parts industry, at around 5 per cent of total gross value added, and its strong linkages with other parts of the economy, the German government estimates that this took 0.4 percentage points off quarterly GDP growth in the third quarter of 2018. Together with difficulties in transporting industrial inputs by river because of the summer drought, the third quarter saw the first fall in GDP at a quarterly basis since 2015 (–0.2 per cent). The episode highlights how strongly the German economy relies on selected leading industries and the sensitivity to international demand. International competition for technological leadership as well as tariff tensions, risks around Brexit and the potential of a stronger than anticipated slowdown of the Chinese economy mean that growth in the German economy may be more vulnerable in 2019.
While car exports have moved up again since the summer, without making up for previous losses (figure 13), recent supply-side data indicates that the final quarter of 2018 was another difficult one for German economic activity. Industrial production in the year to November fell by nearly 5 per cent and business sentiment moved back to a downward trajectory that had started at the beginning of 2018 (figure 14), suggesting that the German economy faces a sharper slowdown than we had previously forecast. GDP grew by 1.5 per cent in 2018. For 2019, we forecast a growth rate of 1.3 per cent, close to the economy's estimated long-term rate of 1.2 per cent.

Figure 13. Germany: Car exports in 2018 by destination

Figure 14. Germany: Short-run indicators
However, continued strong domestic demand provides a buffer to potential shocks from abroad. With employment above 75 per cent of the labour force, solid real wage growth (of 1.5 per cent in 2018Q3) and stable inflation (of just above 2 per cent in 2018Q4), consumption growth has support. A more expansionary fiscal policy will further support real disposable income in 2019. Total government expenditure is set to increase by 4.3 per cent in 2019, after a 3.1 per cent rise in 2018, the strongest expansion since the aftermath of the Great Recession. Most of the additional spending takes the form of transfers, directly boosting disposable income. With a projected government surplus of 1.7 per cent of GDP, there is room for additional countercyclical measures should the probability of a recession increase.
France
While GDP growth increased in France in the third quarter of 2018 to 0.3 per cent from 0.2 per cent in the first two quarters, recent developments suggest a deceleration in annual growth in the fourth quarter of 2018. We have therefore downgraded our forecast of annual GDP growth from 1.7 per cent to 1.5 per cent in 2018 and from 1.9 to 1.6 per cent in 2019.
Consumer price inflation eased from a peak of 2.6 per cent in July and August 2018 to 1.9 per cent in December as a result of a deceleration in the inflation rates of energy, services, tobacco and a more pronounced drop in those of manufactured products. Only food price inflation accelerated. We expect inflation to ease in 2019 and to average 1.8 per cent for the year because the effect of the increase in commodity prices is now past and lower oil prices will work through the economy.
Total labour costs increased by 3.1 per cent in the third quarter of 2018 compared to a year ago, slightly up from 2.8 per cent in the second quarter. As a result, with consumer price inflation averaging 2.6 per cent in the third quarter, this meant that workers benefitted from real income gains in almost all sectors of the economy.
Recent surveys point to a marked and sudden deterioration in the business environment and consumer confidence. The business climate composite indicator, a survey of business managers compiled by INSEE, declined in December 2018 to a two-year low and the composite PMI dropped in December from 54.2 to 48.7, below the 50 mark which indicates expansion. Social protests represented by the ‘gilets jaunes’ movement caused disruptions to businesses and retail trades during the months of November and December, when retailers usually make a significant part of their yearly sales. Households have also become more pessimistic as reflected in the INSEE consumer confidence index which declined to a four-year low of 87 in December, well below its long-term average of 100 (figure 15). As low consumer confidence in France is often associated with a high savings rate, we expect household spending to be growing at a lower rate than real personal disposable income.

Figure 15. France: Consumer confidence and business climate surveys
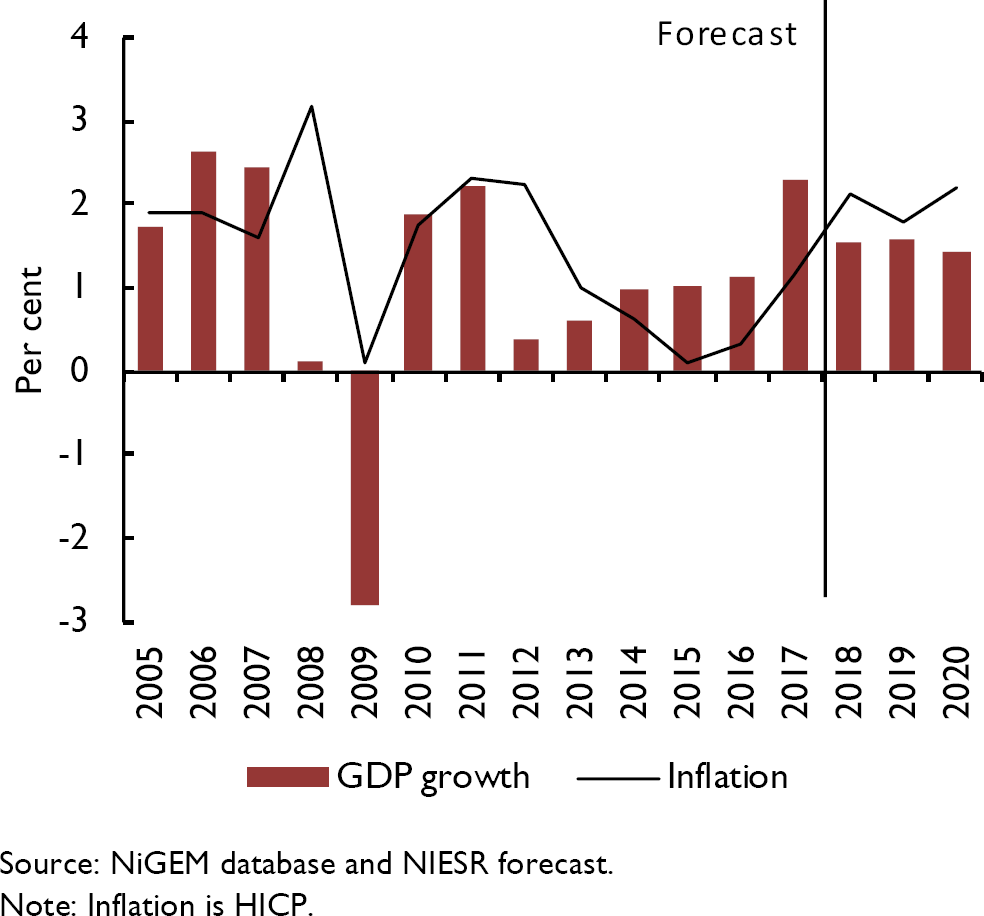
Figure 16. France: GDP growth and inflation
In response to the gilets jaunes crisis, French president Emmanuel Macron announced a fiscal loosening package on 10 December 2018 amounting to about €10 billion: cancellation of a planned tax hike on low-income pensioners and of fuel duty; a tax free allowance for income from overtime hours; an increase of the universal minimum income; an allowance for commuters; and more spending on environmentally-friendly projects. If no compensating measures to reduce public spending are taken, the budget deficit would increase from a planned 2.8 per cent of GDP in 2019 to 3.2 per cent. This would also put in jeopardy the objectives of the 2018–22 plan to reduce public spending by 3 per cent of GDP, the budget deficit by 2 per cent and debt by 5 per cent as explained in Box B of the November 2017 Review.Footnote 6
Italy
Italian GDP is set to expand at a modest rate of around 1 per cent a year over the period 2018–21. Compared to our forecast last quarter, the growth outlook has deteriorated, with GDP falling in the third quarter and a weakening in indicators of confidence in economic activity in the second half of last year.
Output growth in the third quarter of last year was negative for the first time since mid-2014 and business and consumer confidence have generally painted a negative picture of growth expectations. During the last quarter of 2018, PMI surveys fell below the 50 benchmark, indicating a risk of recession, and the Bank of Italy's coincident indicator also fell sharply, reflecting the decline in confidence and volatility in equity markets. Business confidence, usually well correlated with business investment in the months ahead, has trended downwards every month since the start of last year. Consumer confidence has been more resilient, yet retail sales have been weak, possibly due to the higher inflation arising from the oil price increases earlier last year. In the third quarter, investment was a key drag on growth, but net trade marked a positive contribution due to a sharp fall in imports coupled with a rise in export growth.
Our expectation is that consumption will rise moderately, in line with the outlook of GDP growth, with disposable incomes gradually increasing. Investment growth is projected to soften, on the back of the phasing-out of tax incentives and higher interest rates. Finally, trade should continue to contribute positively over the next two years, with exports continuing the pick-up in the second quarter after a slow first quarter and imports increasing at a less rapid pace as domestic demand decelerates.
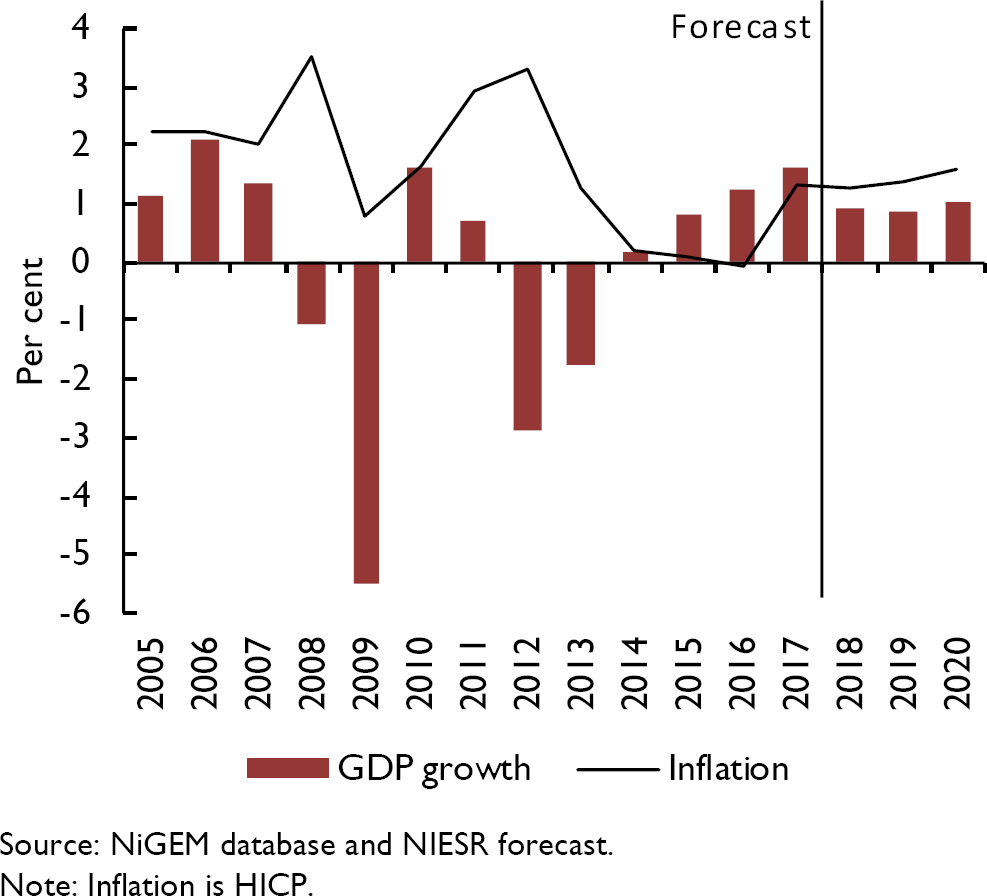
Figure 17. Italy: GDP growth and inflation
With lower energy prices in the latter part of last year, headline HICP inflation is set to increase at a softer pace than projected previously, by around 1½ per cent on average over 2018–19 and slightly above that afterwards. Core inflation remained stable at around 0.7 per cent over the second half of last year, and we expect it to rise to around 1 per cent over the forecast period, in line with relatively robust wage growth.
However, there are risks around these growth forecasts. Domestically, uncertainty about the fiscal budget still poses significant downside risk to our projections. Financial market volatility stemming from that may continue and higher sovereign yields could put pressure on investment plans. On the other hand, should the sovereign spreads return to lower levels, possibly from a successful conclusion to the budgetary discussions, there could be upside risks to our growth projections.

Figure 18. Spain: GDP growth and inflation
Spain
The Spanish economic recovery has continued but at a slowing pace. Annual GDP growth was 2.4 per cent in the third quarter of 2018, falling by 0.1 percentage points compared to the previous quarter. The slight fall in the rate of growth can be accounted for by slower growth of gross fixed capital formation and exports of goods and services, although the latter was somewhat offset by lower growth of imports of goods and services. The unemployment rate fell by 0.1 percentage points to 14.7 per cent in November, marking the 31st consecutive month in which it has decreased. Annual inflation, which had hovered above 2 per cent for the previous six months of last year, fell by 0.6 percentage points to 1.7 per cent in November and then further to 1.2 per cent in December.
Looking ahead, we expect that GDP growth will drop from 2.5 per cent in 2018 to 2.2 per cent in 2019 and 2 per cent in 2020. Inflation is expected to settle at below, but close to, 2 per cent over the coming years.
Some of the risks that the economy faces come from potential political developments. The minority socialist government will soon put a budget to parliament, involving higher spending, taxation and an improved minimum wage. In addition, a far-right party, Vox, has won seats for the first time in one of the regional parliaments. These factors are thought likely to contribute to raising the probability of a general election this year. In addition, following clashes in December, the situation in Catalonia remains a risk factor to the outlook for steady growth in the forecast.
Japan
The Japanese economy shrank by 0.6 per cent in the third quarter of 2018, the steepest quarter-on-quarter drop since 2014, as a series of natural disasters adversely affected exports and tourism. Exports fell by 1.8 per cent while business investment suffered particularly badly due to temporary supply constraints, falling by 2.8 per cent in the quarter. We expect the economy to bounce back in the final quarter of 2018 as supply chains recover. Higher investment is particularly important given the chronic labour shortage facing Japanese businesses.
We expect a brief demand surge ahead of a rise in consumption tax from 8 to 10 per cent scheduled for October 2019 before consumption is reduced by around 1¾ per cent in the medium term compared to our previous forecast (see Box B for further details). Although this tax increase has been known about since 2013, the government has twice postponed its implementation and thus we had not incorporated it into our forecast until now, following Prime Minister Abe confirming that it will go ahead as planned, except in the unlikely event that the Japanese economy suffers a severe and persistent shock. As a consequence, our forecast now shows only very small growth in Japanese GDP in 2020 as the effects of the tax increase feed through, with households strengthening spending in 2019 at the expense of 2020.
Box B. Japan consumption tax increase
Prime Minister Shinzo Abe announced in October 2018 that the government would raise consumption tax from 8 per cent to 10 per cent in October 2019 to help address Japan's government debt, which at over 200 per cent of GDP is the highest among major developed economies. The increase was originally scheduled for October 2015, but was twice postponed due to concerns that it would depress consumer spending. However, Prime Minister Abe has confirmed that the increase will go ahead in October, “unless an event with the magnitude of the Lehman Brothers shock happens”, having judged that households will be better able to withstand the tax hike during this period of economic expansion. This increase is the second stage of an overall 5 percentage point increase, with the initial 3 percentage point hike having occurred in April 2014. The Bank of Japan has promised to maintain short and long-term interest rates at their current extremely low levels until the effects of the tax rise fade out, likely in Autumn 2020.
Figures B1 and B2 show the results from a simulation of a permanent 2 percentage point increase in the rate of consumption tax using our NiGEM model. In the simulation interest rates have been maintained at baseline levels. Since there was no significant effect on employment following the 2014 tax rise, we have kept employment at baseline levels throughout the simulation. We have also assumed no changes to income tax rates and government spending in the simulation.

Figure B1. Impact on consumption compared to 2014 policy change
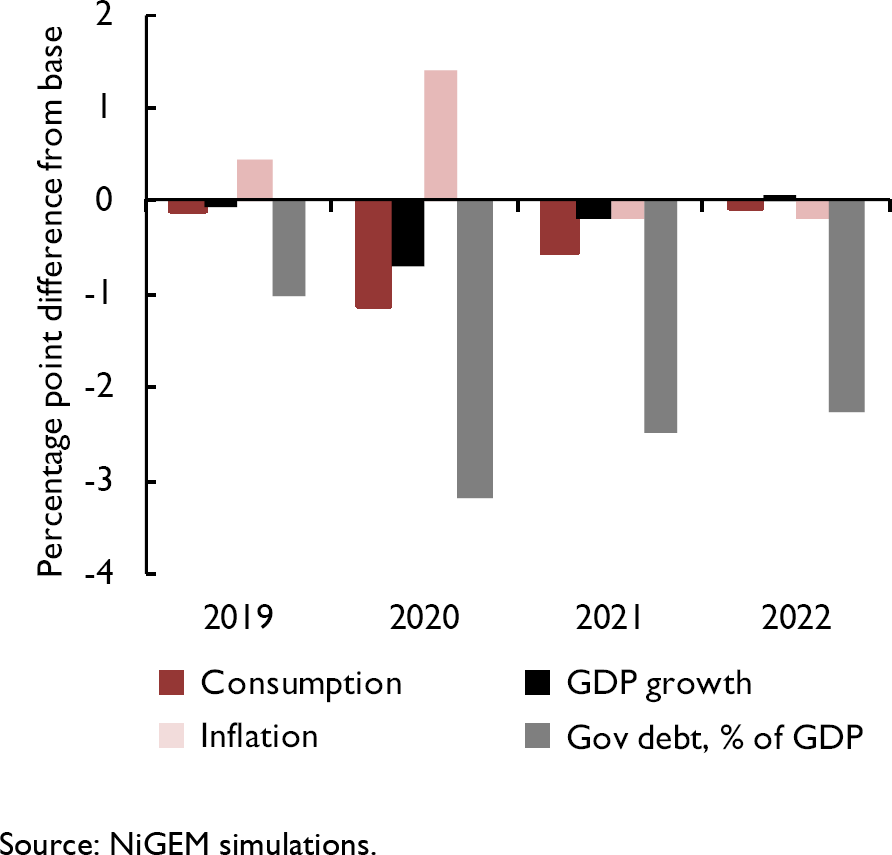
Figure B2. Impact on macroeconomic variables
All else equal, the indirect tax-induced rise in the price level erodes the value of real income and wealth and hence reduces consumption. Figure B1 shows that consumption surged following the announcement of the 2014 tax increase in October 2013, but declined following the implementation date. This intertemporal substitution effect led to a sharp fall in spending in the second quarter of 2014, before consumption settled at a permanently lower level. In 2015–18, consumption was on average around 2½ per cent lower than the level that would have pertained had average growth rates between 2010–12 (before the policy was announced) persisted. In our simulation, consumption falls to around 1¾ per cent below baseline following a 2 percentage point rise in the rate of consumption tax. The growth rate of consumption returns to baseline after 2022 (see figure B2).
The level of output follows a similar pattern to consumption, and falls by a smaller magnitude in percentage point terms. Output growth suffers a temporary fall, returning to baseline by 2022. Inflation picks up temporarily by just under 2 percentage points and the government balance improves sharply in the near term, as tax revenue increases, before deteriorating slightly. In the medium term government debt is around 2–3 percentage points lower as a result of the simulated consumption tax increase.
In the forecast, to capture the intertemporal shift whereby households substitute consumption in the period before the policy is implemented for consumption in the period immediately after implementation, additional assumptions were imposed, based on the pattern of consumption observed in 2014.
This box was prepared by Rebecca Piggott and Iana Liadze.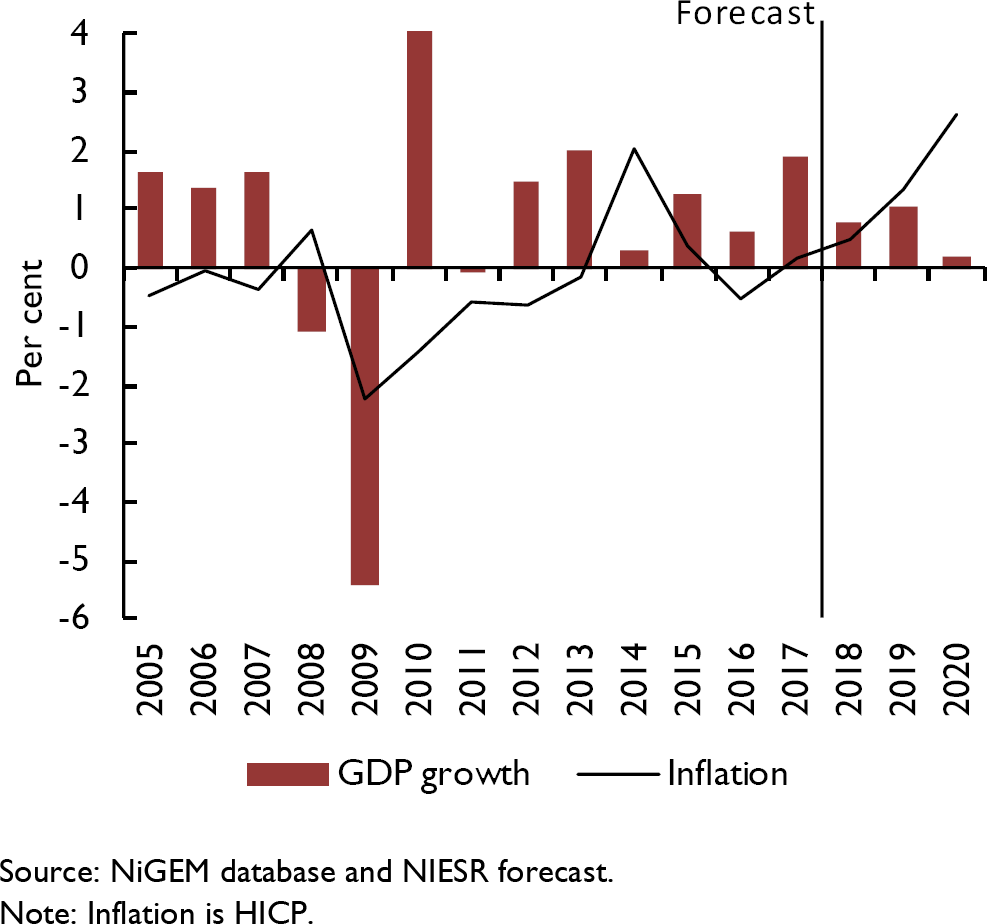
Figure 19. Japan: GDP growth and inflation
Despite the very low unemployment rate, at 2.5 per cent in November 2018, and an output gap judged to be close to zero by the IMF in its October 2018 forecast, inflation has remained stubbornly below the Bank of Japan's 2 per cent target. Headline inflation fell to a 14-month low of 0.3 per cent in December, down from 0.8 per cent in November. The Bank of Japan has indicated that it will maintain the current ultra-loose monetary policy until the effects of the tax increase fade, likely in Autumn 2020. We forecast inflation to average 1.4 per cent this year and 2.6 per cent in 2020 as the effects of the tax increase pass through to prices.
China
Output growth in 2018 remained relatively robust despite escalating trade tensions and associated uncertainty, but the persistence of trade-related pressure appears now to be weighing down on economic activity. However, the government seems to be determined to mitigate damage to the economy, so we continue to expect measured annual GDP growth to slow down in an ‘orderly’ way.
The 90-day truce in the trade dispute between the US and China, agreed in December 2018 at the G20 meeting, temporarily eased a negative impact on economic activity and more generally on sentiment. Based on currently available information, the complexity of the economic relationship between the two countries makes it highly unlikely that a comprehensive agreement involving a rollback of tariffs will be reached by the March 1 deadline. However, if such a deal is agreed, it will represent an upside to our forecast.
The initial negative impact on Chinese exports from imposed tariffs has been mitigated by a front-loading of exports as well as softening of the renminbi in terms of the US dollar. Recently increased VAT refunds introduced by the government on exported products are expected to help exports somewhat going forward. Coupled with the trade-related slowdown, domestic headwinds brought about by de-leveraging prompted the government to act and already there have been steps taken to introduce fiscal as well as monetary stimulus.
On the monetary policy front, the People's Bank of China (PBOC) announced a 1 percentage point cut in the reserve requirement ratio (RRR) in January, from which all financial institutions should benefit. This followed earlier targeted liquidity measures aimed at supporting financing for small enterprises. Also notable is the change in wording in the official monetary policy description at the December Central Economic Work Conference, from “prudent and neutral” to “prudent with appropriate looseness and tightness”, which might be indicative of move of monetary stance towards easing.
Recent announcements by government officials suggest further fiscal stimulus measures could be rolled out to support both household consumption and investment in general, given that domestic demand has been the main driver of economic expansion (see figure 20) and recent high frequency indicators (including retail sales, fixed asset investment, industrial production) are increasingly pointing to a weakening in the economy. For example, one likely policy under consideration seems to be directed at stimulating auto sales, as the auto market has weakened and auto sales have been declining for several consecutive months (see figure 21). It is likely that measures aimed at supporting private consumption and boosting confidence would gain traction the more signs of softening of economy activity emerge. As a result, with GDP growth of 6.6 per cent announced for 2018 (the slowest since 1990) and marking a slowing from 6.9 per cent in 2017, we expect a further slowing to 6.2 per cent in 2019 and continue to expect a further easing in pace into the medium term.

Figure 20. China: Contribution to GDP growth

Figure 21. China: Passenger car sales
India
GDP growth slowed to 7.1 per cent year-on-year in the third quarter of 2018, down from 8.2 per cent in the previous quarter, as high oil prices and a weak rupee weighed on consumer spending. Government spending made a strong contribution to growth, rising by 12.7 per cent on a year earlier. Despite the slowing, growth remains strong and we forecast this to continue ahead of the upcoming general election due this Spring. Overall, we expect the economy to grow by almost 7.5 per cent in both 2019 and 2020.
Both the incumbent Bharatiya Janata party (BJP) and opposition Congress party have embarked on spending programmes in advance of the election. Congress-led state governments in Madhya Pradesh, Chhattisgarh and Rajasthan announced farm loan waivers, and BJP-led Assam wrote off $85m worth of farm loans while Gujarat waived $92m worth of outstanding electricity bills owed by rural consumers. Such measures mean that India is unlikely to meet its fiscal deficit target of 3.3 per cent of GDP for the year ending March 2019. The Reserve Bank of India's governor, Urjit Patel, resigned in December following tensions with the government over the bank's independence and the direction of the financial sector. The government had been pressing for greater efforts to boost growth in the run-up to the election and the central bank has been under pressure to ease liquidity to the non-bank financial sector. Some commentators have expressed concerns over government influence possibly weakening the Bank's commitment to its inflation-targeting regime.

Figure 22. India: GDP growth and inflation
Interest rates were raised in June last year and then again in August amid inflationary pressure due to rising oil prices. Inflation has since slowed, registering 2.19 per cent in December, the lowest rate since June 2017 and well below the inflation target. While there are some expectations of a softening monetary policy stance in the near term, our expectation is that the inflation rate will fluctuate around 4 per cent over the next two years.
Brazil
GDP growth is expected to increase during 2019 and 2020 as private consumption, supported by improvements in the labour market, increases. Output growth of over 2 per cent a year is expected, stronger than in the past three years.
Output growth in the third quarter of 2018 was firm at 0.8 per cent, in part reflecting a very low second quarter base, where a nationwide truck strike caused supply disruptions during May and June. Following the October election, business and consumer confidence rose sharply. As a result, a recovery in credit flows and greater policy certainty strengthened the growth outlook. In the second half of last year, consumer spending remained supported by low inflation and interest rates.
Our forecasts for annual GDP growth in 2019 and 2020 are for just below 2.5 per cent growth each year. In the medium term, output growth should be supported by a recovery of private consumption on the back of declining inflation in 2017 and 2018 and labour market trends. Employment and real wages dynamics have been encouraging for recovery from the recession in the middle of this decade although the composition of new jobs remains an issue as formal salaried jobs have contracted. Investment is likely to grow firmly, in line with improved confidence, including in financial markets. Finally, regional as well as global developments have driven a sustained increase in demand for Brazilian exports, aiding the trade position, although we expect recent strength in exports to soften gradually going forward.
Recent inflation prints have surprised to the downside, with inflation expectations remaining well anchored. That should support consumption in the near term. In this scenario, inflation should remain within the Central Bank's target of 3–6 per cent in the near term. Lower prices pressures will continue to provide space for accommodative monetary policy, as the policy rate has been stable at 6.5 per cent.
The risks to these forecasts are tilted to the downside. On the political front, uncertainty around the implementation of reforms remains significant, in particular with regard to pension reform. Additionally, the sustainability of public debt and compliance with existing fiscal rules will require structural changes in public expenditures.

Figure 23. Brazil: GDP growth and inflation
Russia
Higher global oil prices since the low point in early 2016 have helped the Russian economy to return to growth and, after growth of 1.5 per cent in 2017, the economy is estimated to have grown by 1.8 per cent in 2018. Annual GDP growth of 1.5 per cent in the third quarter of last year has been followed by indicators of stronger growth in the final quarter of the year, largely from agriculture and oil production. Our expectation is that growth will continue in 2019 and 2020 at a pace similar to that in 2018. However, the fall in oil prices in late 2018 and the increase in VAT to 20 per cent (from 18 per cent) early this year are likely to put downward pressure on growth this year, so that a slight undershoot of the 2018 experience looks likely. However, the budgeted increase in public sector investment spending is likely to feed through as the year passes, and so give a boost to output growth in 2020 relative to this year.
Consumer price inflation has been below the 4 per cent target level during 2018 but increased to 4.3 per cent in December and the effect of the VAT increase will be to raise it further. The recent fall in oil prices should, however, moderate the overshoot of the target. As a consequence, inflation is forecast to be around 4 per cent this year and next. With this anticipated path, substantial further tightening in monetary policy is not anticipated – policy rates increased from 7.25 per cent to 7.50 per cent in September last year and again in December to 7.75 per cent.
For the Russian economy fluctuations in oil prices are very important and our forecast, which follows futures markets, has a lower future path than expected three or six months ago. The other key factor for the economy is how economic sanctions develop. Further measures in response to the Salisbury poisonings may be implemented by the US and other measures, relating to security and election influencing, are under discussion, with any effects most likely to be seen on asset holdings and in banking.

Figure 24. Russia: GDP growth and inflation
Australia
In terms of GDP growth performance over a prolonged period, the Australian economy stands out among the advanced economies. It is still in a very long expansion period, with annual GDP growth remaining positive since the early 1990s. During the Great Recession the economy was supported by its commodity products (such as iron ore) benefitting from their exports to the strongly growing Chinese economy, the financial system remained robust and government finances being in a relatively favourable position. In the third quarter of 2018, annual growth slowed to 2.8 per cent, down from 3.1 per cent in the second quarter, reflecting weaker investment spending and a softening in the housing sector.
After anticipated growth of 3 per cent in 2018, our forecast is for output growth to moderate slightly in 2019 and into the medium term to closer to 2.5 per cent. Inflation turned down below 2 per cent at the end of last year and lower oil prices are likely to contribute to maintaining inflation close to 2 per cent in 2019. Policy interest rates have been held at 1.5 per cent since August 2016, and with strong growth in 2018 and the labour market showing strengthening wage growth and falling unemployment, the policy debate will balance this against the expectation of lower inflation.

Figure 25. Australia: GDP growth and inflation
The housing market will also be an important factor in policy decisions in 2019 and 2020. As Box A discusses, Australia is an economy in which real house prices have risen substantially. The latest figures show the pace of the rise in the household debt to income ratio has slowed, with borrowing growth slowing, and that house prices and house loan approvals have started to fall in what has, so far, been an orderly correction process.


