


Introduction
In the last 20 years, plasmonic devices have been extensively investigated both from an experimental and theoretical point of view due to their fascinating and unique optical properties.[Reference Viktor1–Reference Yan, Li, Chandra, Tulevski, Wu, Freitag, Zhu, Avouris and Xia3] Several plasmonic-controlled photonic components have been realized including super-high-resolution lenses,[Reference Zhang and Liu4, Reference Pendry5] subwavelength gratings,[Reference Khorasaninejad and Capasso6] and beam deflectors.[Reference Neu and Rahm7] Plasmonic nanoparticles (NPs) have played a key role in this explosion of interest due to their capability of confining electromagnetic radiation at the nanoscale by exploiting a phenomenon called localized plasmonic resonance (LPR).[Reference Hutter and Fendler8] Irradiation (with suitable frequency) of a plasmonic NP induces the oscillation of free electrons localized at the metal–dielectric interface, which gives rise to a LPR. The frequency (wavelength) of the LPR can be controlled by varying both the size, shape, and the dielectric constant of the surrounding medium.[Reference Liz-Marzán9] Plasmonic NPs can also behave as nano-sized sources of heat when pumped sufficiently with resonant radiation due to the Joule effect generated by the photo-induced electrical current.[Reference Govorov and Richardson10, Reference De Sio, Placido, Comparelli, Lucia Curri, Striccoli, Tabiryan and Bunning11] The photo-thermal properties of NPs have been historically considered a drawback because they have contributed to the intrinsic losses of plasmonic-based devices. Numerous efforts for mitigating the losses by exploiting both organics and semiconductors gain media have occurred.[Reference Noginov, Zhu, Belgrave, Bakker, Shalaev, Narimanov, Stout, Herz, Suteewong and Wiesner12–Reference Holmström, Thylén and Bratkovsky14] Researchers recently have realized that this effect opens the possibility of enabling “drug-free” nano-thermal therapies including “plasmonic photo-thermal therapy”.[Reference Huang and El-Sayed15] From a fundamental point of view, it is very important to study the heat dissipation from the photo-heated NPs to the surrounding environment. Thermotropic liquid crystals (LCs) are an excellent candidate medium as they are extremely responsive to external perturbations such as electric fields, optical fields, and temperature.[Reference de Gennes16] LCs have been exploited as active media for controlling the LPR frequency or for detecting photo-induced temperature variations in several plasmonic architectures.[Reference De Sio, Caputo, Cataldi and Umeton17–Reference Kurochkin, Murugesan, Bennett, D'Alessandro, Reznikov, Tang, Mehl and Kaczmarek19] The work here shows the possibility of combining a large area (1 inch2) of randomly distributed gold NPs (GNPs) immobilized on a glass substrate and covered with a cholesteric LC (CLC) as an active overlayer for controlling simultaneously both the photonic and plasmonic properties of the hybrid system.
Materials and method
The GNPs synthesis followed a slightly modified Turkevich method reported elsewhere.[Reference Cunningham, Mühlig, Rockstuhl and Bürgi20, Reference Cataldi, Caputo, Kurylyak, Klein, Chekini, Umeton and Burgi21] A monolayer of GNPs is electrostatically immobilized on a BK7 glass substrate, which had been dipped in a Piranha solution (a 3:1 mixture of concentrated sulfuric acid and hydrogen peroxide) for 30 min. This first process leaves the substrate negatively charged. After washing and drying, the surface was functionalized by dipping it in a 5% (v/v) solution of N-[3-(trimethoxysilyl) propyl] ethylenediamine in ethanol for 30 min in order to obtain a positive surface. Following rinsing and drying, the template was put in an oven at 120°C for 30 min. The glass substrate at room temperature was successively dipped in a colloidal solution of spherical GNPs for 1 h and 30 min. Subsequently, the same substrate was submitted to a nanochemistry procedure to increase the sizes of nanostructures (one cycle of growth).[Reference Cataldi, Caputo, Kurylyak, Klein, Chekini, Umeton and Burgi21]
A CLC phase can be obtained by adding to a NLC a small amount of chiral dopant, giving chiral properties to the NLC. High concentrations of chiral dopant can be used to increase the twisting power and to reduce the CLC pitch. In our case, a CLC mixture was prepared by mixing a nematic LC (5CB, 4-cyano-4′-pentylbiphenyl, by Merck, Darmstadt, Germany) with 20 wt.% left- handed chiral dopant [ZLI-811, 4-(1-methylheptyloxy)carbonylphenyl-4-(hexyloxy)benzoate, by Merck, Darmstadt, Germany] obtaining a helix pitch length of about 440 nm. The 20 wt.% of chiral dopant was necessary in order to finely tune (red shift) the CLC reflection band, thus minimizing the overlap between the CLC reflection band and the GNPs absorption peak centered at 600 and 515 nm, respectively (see below). 5CB was utilized due to its low transition temperature (T nematic−iso ≈ 38°C). The transition temperature of the obtained CLC is almost the same as the base 5CB. The photo-alignment layer (PAL, PAAD 72 by BEAMCo, Orlando, Florida)[22] is a commercial available azo dye dissolved (1 wt.%) in dimethylformamide and possesses a broad absorption spectrum extending into the visible range of the spectrum (λ max = 430 nm). The thermographic analysis was performed by using a FLIR (A655sc) thermal imaging camera that produces thermal images of 640 × 480 pixels with an accuracy of ±2°C. The camera works seamlessly with a proprietary software (FLIR ResearchIR Max) that enables recording and processing of the thermal data acquired by the camera.
Experimental section
The GNPs substrate exhibits a pinkish tint [Fig. 1(a)] with an absorption peak [Fig. 1(e), red curve] at 515 nm (measured with unpolarized light at normal incidence) due to excitation of the LPR. The substrate was coated with the PAL for inducing planar alignment of the CLC. The PAL was spin-coated onto the NP-coated substrate (3000 rpm for 30 s) inducing a noticeable color change [Fig. 1(c)]. The PAL deposited onto the GNPs monolayer produces a variation of the refractive index surrounding the GNPs [from air (n = 1) to PAL (n = 1.4)] as evidenced by the red shift (18 nm) of the LPR peak reported in Fig. 1(e) (blue curve) from 515 nm (red curve) to 533 nm (blue curve). The reported red shift of the LPR frequency can be explained in the framework of Mie theory,[Reference Mie23] which is suited to calculate the optical cross-section for a small and isolated spherical NP. Accordingly, there is a correlation between the LPR frequency and the refractive index of the medium surrounding the GNPs. In particular, the LPR frequency reveals a red or blue shift for increasing or decreasing value of the refractive index surrounding the NPs. In order to confirm that the approximation of small and isolated NPs is valid, the GNPs monolayer was examined by means of an atomic force microscopy (AFM) operating in tapping mode using an Olympus OML-AC240TS (radius 9 ± 2 nm) cantilever. Figure 1(b) shows that the GNPs are monodisperse with an average diameter of about 20 nm and a thickness of the GNP array of about 30 nm. The same study performed after the PAL deposition [Fig. 1(d)] shows that the modulation depth is reduced a few nm due to the planarization effect induced by the PAL deposition (the PAL thickness is about 27 nm). The CLC is “sandwiched” between one substrate possessing the treated GNPs/PAL and a second substrate coated with a thin polyimide layer rubbed to induce planar alignment of the CLC molecules (CLC helix axis oriented perpendicular to the glass surfaces, see below). The two substrates are spaced by 10 µm glass microspheres and the CLC is introduced by capillary flow at room temperature. These microspheres are located at the four corners of the cell and they do not affect the optical proprieties of the sample. Figure 1(f) shows the CLC sample highlighting a reddish color due to its selective reflection. For unpolarized light, the spectral response of the sample [Fig. 1(e), magenta curve] shows a broad dip in the transmission curve due to the overlap of the LPR absorption and CLC reflection centered at 600 nm.
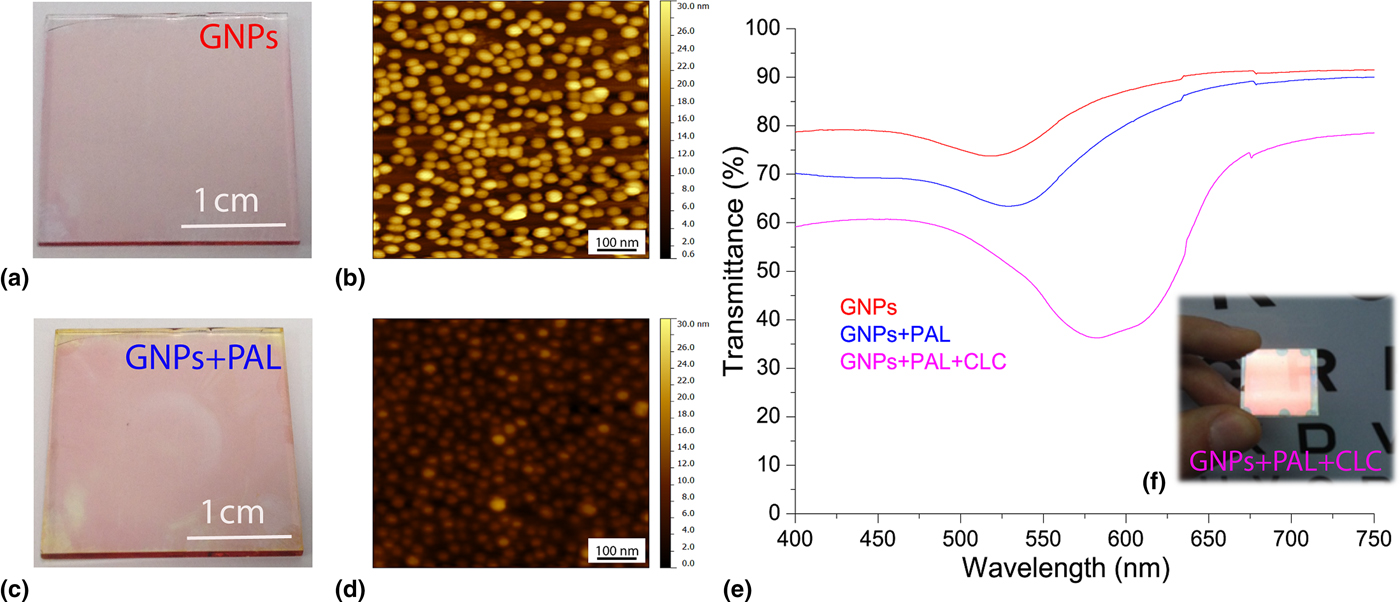
Figure 1. Photo of the NP array immobilized on a glass substrate surrounded by air (a) and PAL (c) along with the corresponding AFM topography (b, d). Spectral response of the sample (e) for unpolarized visible light surrounded by air (red curve), PAL (blue curve), and PAL + CLC (magenta curve) along with the photo of the fabricated sample (f).
Results and discussion
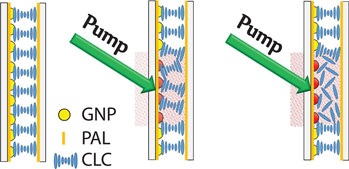
In order to study independently the photonic and plasmonic properties of our hybrid system (due to the partial overlapping between the LPR absorption and CLC reflection band), polarized spectral characterization of the samples was done. It is widely known that for a CLC layer in a planar configuration, circularly polarized light of the same handedness (right circularly polarized, in the actual case) as the helix and having wavelengths between n oP and n eP (n o and n e being the ordinary and extraordinary refractive indices of the material, respectively, and P being the pitch) is reflected by the CLC layer [Fig. 2(a), red curve]. This is confirmed by visualizing the far-field back-reflected component [see reddish spot in Fig. 2(c)]. Light of the opposite handedness [Fig. 2(a), blue curve] propagates through the CLC film without being affected (the whitish back-reflected spot shown in Fig. 2(b) is due to the Fresnel reflection of the glass substrates). Both spectra reported in Fig. 2(a) (red and blue curves) have been acquired at normal incidence, while the two far-field back-reflected spots [Figs. 2(b) and 2(c)] have been acquired by slightly tilting the CLC sample. It is worth noting that in the blue curve [Fig. 2(a)], the LPR absorption is visible with a remarkable red shift compared with PAL [Fig. 1(e), blue curve]. On the other hand, the LPR absorption is slightly visible in Fig. 2(a), red curve (see dashed circle) due to the partial overlap between the LPR absorption and CLC reflection band. Indeed, due to the increasing value of the refractive index surrounding the NPs [from the PAL layer to the CLC film (n average~1.61)], the LPR frequency is further red-shifted by ~28 nm [Fig. 2(a), blue curve]. [Note: the refractive index of the CLC in the cholesteric phase has been calculated as follows: n average (cholesteric) = (n e + n o)/2, where n e ≈ 1.68 and n o ≈ 1.52 are the extraordinary and ordinary refractive indices of the LC, respectively.] To visualize the overall red shift of the sample, the spectral response of the GNP array [Fig. 2(d), red curve], GNP array covered with PAL [Fig. 2(d), blue curve], and GNP array coated with PAL and CLC [Fig. 2(d), magenta curve] is shown. The last one has been acquired for left circularly polarized light in order to remove the presence of the CLC reflection band. There is a total red shift of the LPR frequency of about 40 nm. The pitch of a CLC film is sensitive to temperature variations allowing a simple probe of average temperature variations induced by LPR-induced heating. An all-optical setup reported in Fig. 2(e) was used to probe time/temperature/exposure relationships. This setup utilizes a collimated white source (400 nm < λ < 750 nm) for monitoring the spectral transmission properties of the CLC configuration and a CW pump laser emitting at λ = 532 nm (P pump = 60 mW/cm2) in the high-absorption range of the GNPs surrounded with PAL and CLC [Fig. 2(d), magenta curve]. When the pump beam is off, the CLC is planar aligned as sketched in Fig. 2(f) (left image). In this geometry, for right circularly polarized light, the CLC exhibits a well-defined reflection band [Fig. 3(a), 0s]. By gradually photo-exciting the sample (from 0 to 15 s) from the GNPs substrate side, there is an electric-driven Joule heating of the GNPs and dissipation of that heat into the surrounding CLC medium (the PAL layer does not change its optical properties with temperature). The local heating induces a deformation/distortion of the CLC alignment [Fig. 2(f), middle image] resulting in attenuation (≈80%) and broadening (≈5 nm) of the reflection band [Fig. 3(a)]. The attenuation is due to a large increase in scattered transmitted light, while the broadening is due to a slight chirping of the CLC pitch profile through the thickness of the cell (hot to cold). Continued illumination from 15 to 19 s results in the CLC undergoing a phase transition [Fig. 2(f), right image] restoring [Fig. 3(b)] the broadband transmitted light intensity (the isotropic CLC does not scatter the impinging radiation). Noteworthy, when the CLC is in the isotropic phase, the reflection band is completely erased, while the LPR absorption is clearly visible [Fig. 3(b), black curve]. In order to check the reversibility and the repeatability of the reported effect, we have performed reflection dynamic experiments by using a low-power red probe light (λ = 633 nm, in the middle of the reflection band). By utilizing a photo-detector, we have monitored the reflection component while turning on and off the pump laser beam (λ = 532 nm, P pump = 60 mW/cm2). In the time interval 0–15 s, the CLC configuration is partially deformed [see configuration reported in Fig. 2(f), middle image] due to induced photo-thermal heating (pump beam on). When the pump beam is turned off, the CLC restores to its initial geometry [Fig. 2(f), left image] in <1 s. Conversely, in the time interval 15–19 s, since the CLC undergoes a phase transition (and is eliminated) [Fig. 2(f), right image], when the pump beam is turned off, the CLC takes several minutes to relax back to its initial configuration [Fig. 2(f), left image]. We have repeated the same experiments by photo-heating the samples from the glass side observing the same behavior with a longer time interval (the CLC went to the isotropic phase after 26 s). It is important to remark that we have chosen spherical GNPs because they are more stable than other shapes (e.g., nanorods) and easier to prepare. Moreover, we remind that the photo-thermal efficiency (μ) of GNPs can be expressed through the following equation μ = σ abs/(σ abs + σ sca), where σ abs and σ sca are the absorption and scattering cross-sections, respectively. It has been shown by Jain et al.[Reference Jain, Lee, El-Sayed and El-Sayed24] that if the particle size is about 10–20 nm, σ sca is negligible, thus μ ≈ 1. On the other hand, the synthetic path for realizing very small GNPs (e.g., <10 nm) is experimentally challenging and time consuming. For this reason, we chose a particle size (20 nm) to maximize the photo-thermal efficiency while ensuring a simple and reliable synthetic protocol. In order to quantify the influence of the CLC refractive index variation on the spectral position of the LPR peak, the transmission curves of the sample when the CLC is in the cholesteric [Fig. 2(d), magenta curve] and isotropic [Fig. 3(b), black curve] phases can be compared. Figure 4(a) shows a blue-shifted (≈15 nm) LPR peak due to the decreasing of the refractive index surrounding the GNPs [from cholesteric (n average~1.61) to isotropic (n average~1.57)], again in agreement with the Mie theory.[Reference Mie23] Note: the refractive index of the CLC in the isotropic phase has been calculated as follows: n average (isotropic) = (2n o + n e)/3. The photo-induced temperature variations between the two CLC configurations (cholesteric and isotropic phases) was monitored with a high-resolution thermographic camera. Figure 4(b) shows a uniform temperature distribution (T ≈ 20°C) at t = 0 s, while Fig. 4(c) shows a noticeable temperature increases (T ≈ 40°C, under the photo-illuminated area) at t = 20 s due to photo-induced thermal effect. The control experiment (same experimental conditions) performed on a regular CLC sample did not show any significant temperature variations. This result is an incontrovertible evidence that the photo-induced heat generation can only be associated to the LPR mechanism (plasmonic-assisted photo-thermal heating). Noteworthy, the reported blue shift [Fig. 4(a)] shows the possibility to realize a LC-based plasmonic device having a light controllable plasmonic resonance.
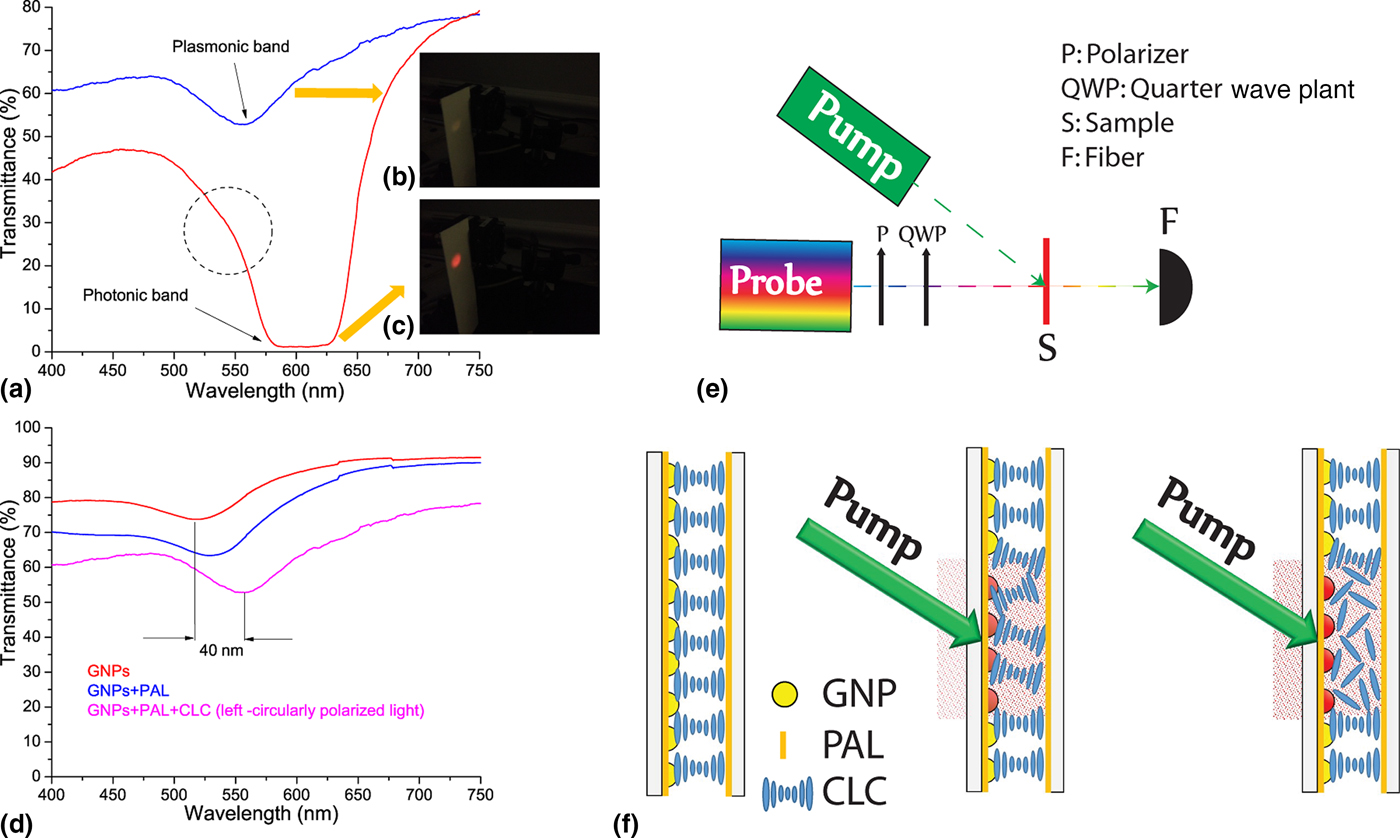
Figure 2. Spectral response of the sample (a) for left (blue curve) and right (red curve) circularly polarized light along with the corresponding photos (b, c) of the back-reflected component. Spectral response of the NP arrays (d) surrounded by different media, air (red curve), PAL (blue curve), PAL + CLC (magenta curve). The magenta curve in (d) has been acquired for the light left circularly polarized. All-optical setup (e) for sample characterization. Schematic of the sample (f) with the pump beam turned off (left) and on (middle and right) at different power level.
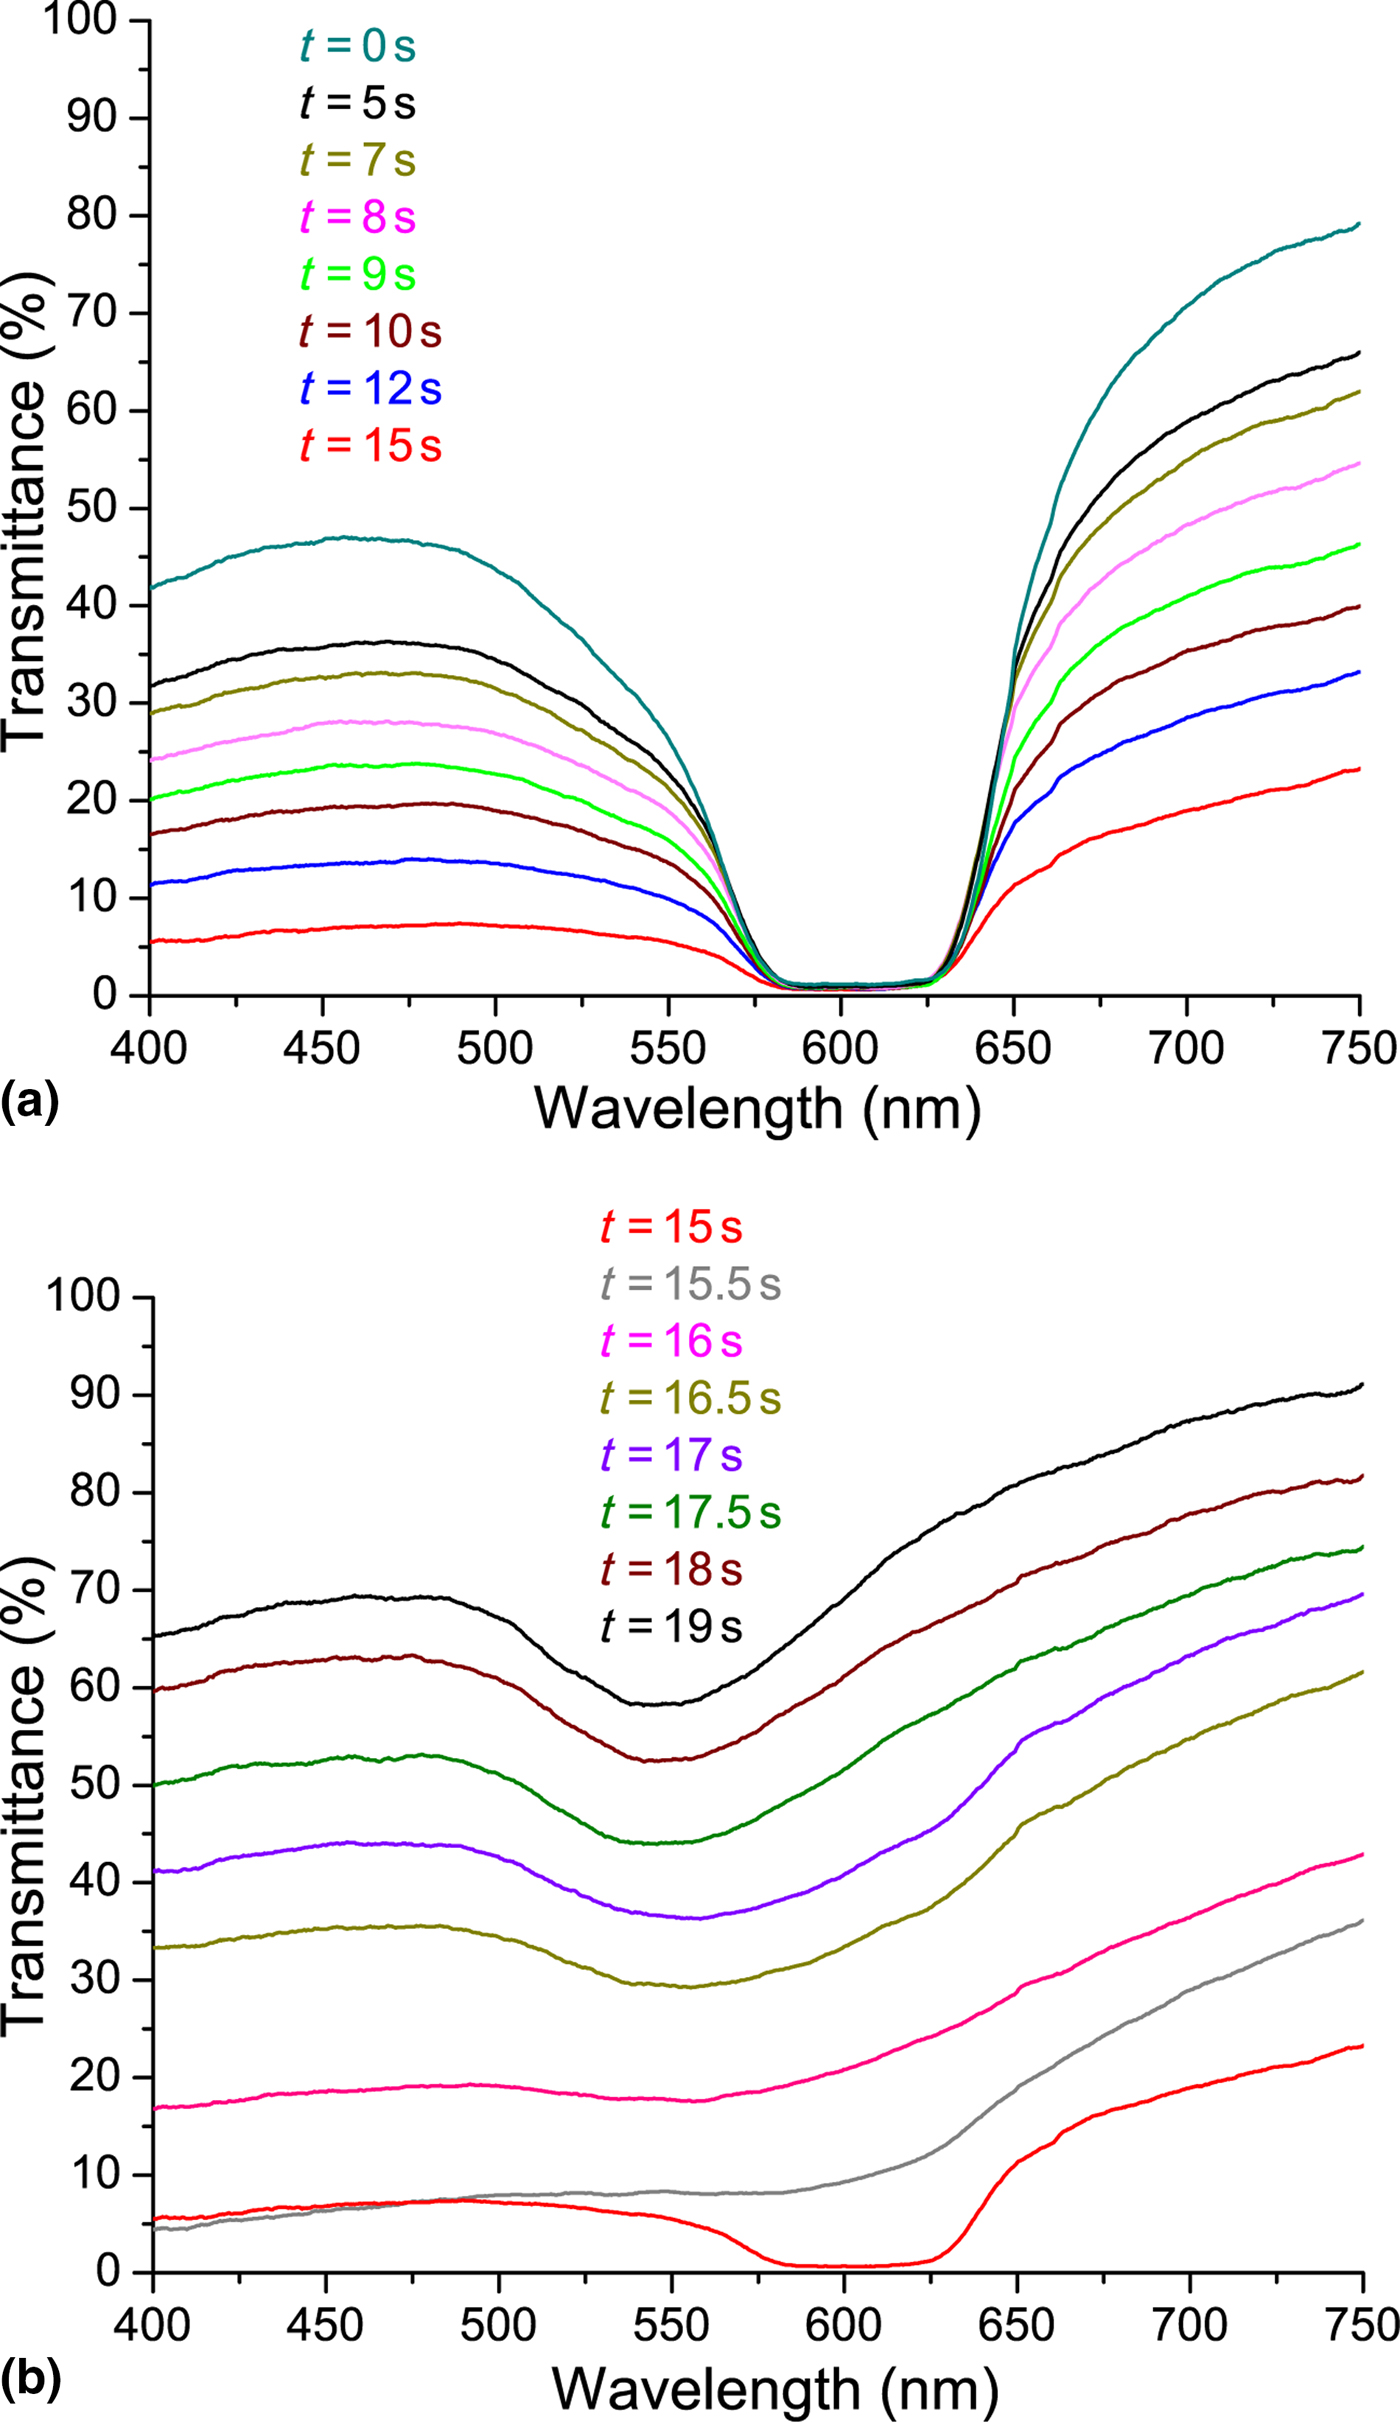
Figure 3. Spectral response of the sample (probe light right circularly polarized) for different values of the illumination time. For the sake of clarity, the spectrum is divided in two different spectra having fast (a) and slow (b) back relaxation.
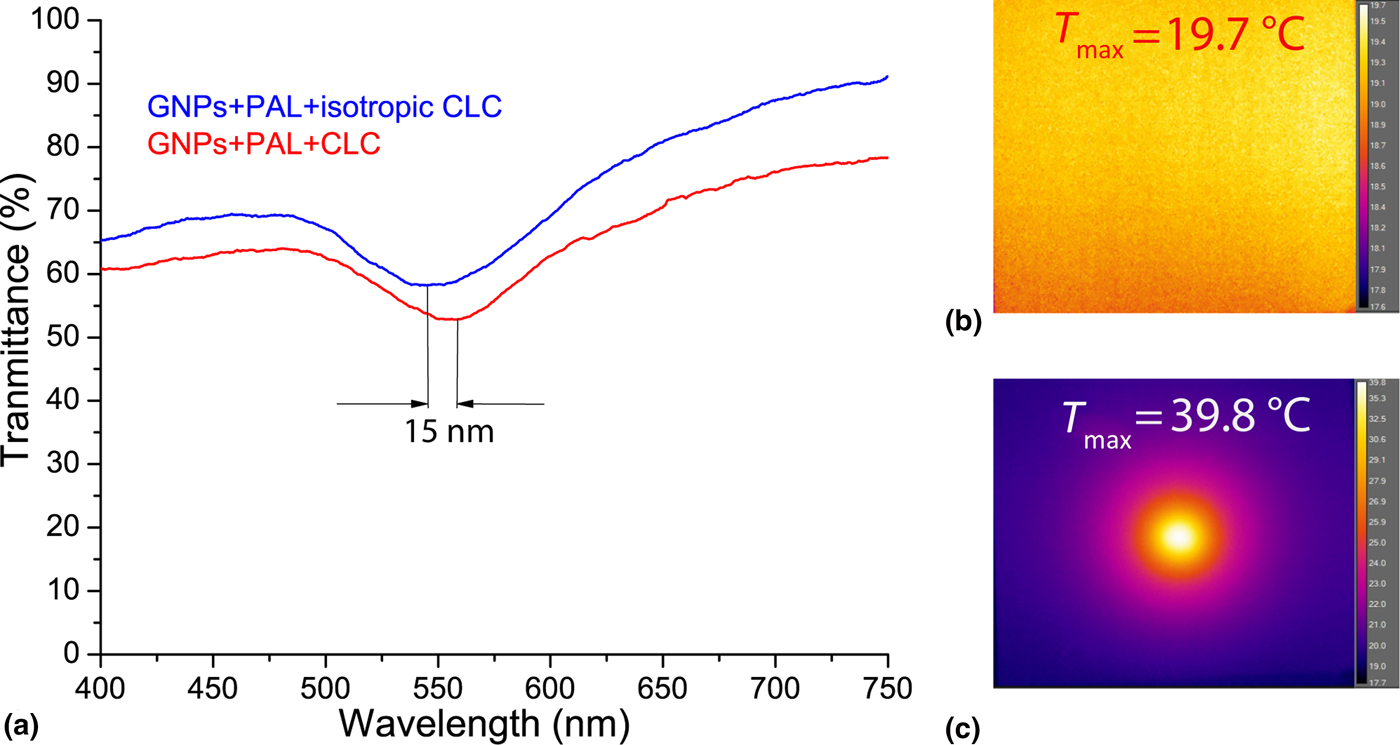
Figure 4. Spectral response (a) of the sample for left (red curve) and right (blue curve) circularly polarized light having the CLC is the cholesteric and isotropic phases, respectively. Thermographic images of the sample (pump laser beam on) acquired at t = 0 s (b) and t = 20 s (c).
Conclusion and outlook
To summarize, the photo-thermal properties of a GNP array immobilized on a glass substrate and layered with a low-transition temperature CLC was examined. A significant red shift (40 nm) of the LPR frequency due to a local increase of the refractive index (from air to PAL to CLC) was observed. Upon exposure to resonant radiation, local heating of the CLC medium induces changes to the optical properties. The local phase can be transitioned from liquid crystalline to isotropic wherein the expected blue shift (15 nm) of the LPR was observed. The system demonstrates that suitable optical radiation can be utilized to affect both the plasmonic and photonic properties of the system. Ongoing efforts are devoted to improve the photo-induced CLC broadening by using thicker glass cells and materials with higher transition temperature. NPs with different shapes and properties (e.g., gold nanorods) are also under investigation. In the light of plasmonic-based applications, our finding can be used for realizing a large area, all-optical, plasmonic architectures with adjustable LPR frequency. Moreover, the same system can be integrated in modern photonic devices such as controllable light filters and smart mirrors.
Acknowledgments
The authors thank Rankess Dominguez for the discussions and assistance. This research was partially supported by the Air Force Office of Scientific Research (AFOSR), Air Force Research Laboratory (AFRL), US Air Force, under grant FA9550-18-1-0038 (P. I. L. De Sio, EOARD 2017-2020) and the Materials and Manufacturing Directorate, AFRL.
Author contributions
The manuscript was written through contributions of all authors. All authors have given approval to the final version of the manuscript.


