


Introduction
Sulfate minerals play a central role in governing the release and transport of acidity and potential environmentally critical elements following pyrite oxidation (e.g. Jerz and Rimstidt, Reference Jerz and Rimstidt2003; Hammarstrom et al., Reference Hammarstrom, Seal II, Meier and Jackson2003, Reference Hammarstrom, Seal II, Meier and Kornfeld2005). Recently, the finding of high thallium contents in pyrite ore deposits from the southern Apuan Alps, northern Tuscany, Italy (D'Orazio et al., Reference D'Orazio, Biagioni, Dini and Vezzoni2017) promoted the characterisation of secondary mineral assemblages allowing the collection of mineralogical and geochemical data.
The presence of sulfate assemblages related to the weathering of pyrite ores has been known since the second half of the 19th Century (e.g. D'Achiardi, Reference D'Achiardi1872). However, modern mineralogical data have only been collected in the last decade, with the identification of well-crystallised sulfates in the Fornovolasco and Monte Arsiccio mines. In the former locality, the new mineral species volaschioite, Fe4(SO4)O2(OH)6⋅2H2O, as well as Tl-bearing varieties of alum-(K) and voltaite, were found (Biagioni et al., Reference Biagioni, Bonaccorsi and Orlandi2011, Reference Biagioni, Mauro, Pasero, Bonaccorsi, Lepore, Zaccarini and Skogby2020). Moreover, Monte Arsiccio proved to be an extraordinary laboratory for the study of sulfate minerals, providing the mineral systematics with three new K–Fe sulfates (giacovazzoite, scordariite and magnanelliite – Biagioni et al., Reference Biagioni, Bindi, Mauro and Pasero2019a; Reference Biagioni, Bindi, Mauro and Hålenius2019b; Reference Biagioni, Bindi and Kampf2019c), and several other species, among which were world-class specimens of coquimbite (Mauro et al., Reference Mauro, Biagioni, Pasero, Skogby and Zaccarini2020).
A peculiar feature of the Fornovolasco and Monte Arsiccio sulfate assemblages is represented by the rare occurrence of fluo-sulfates. Mauro et al. (Reference Mauro, Biagioni, Pasero and Skogby2019) described wilcoxite from the Fornovolasco mine, reporting new crystal-structure data and improving the knowledge of its H-bond system. Recently, another fluo-sulfate, khademite, was identified at the Monte Arsiccio mine. The current definition of khademite is the result of a long and debated history summarised by Košek et al. (Reference Košek, Žáček, Škoda, Laufek and Jehlička2019). As a matter of fact, a modern and full characterisation of khademite is still lacking, as Bachet et al. (Reference Bachet, Cesbron and Chevalier1981) gave no chemical analysis and no further crystal-structure refinements were reported. The finding at the Monte Arsiccio mine has permitted the collection of a new set of good-quality data, integrating electron microprobe, spectroscopic, and single-crystal X-ray diffraction analyses, along with a thoughtful discussion of previous available data.
Experimental
Studied specimen
Khademite from the Monte Arsiccio mine occurs as colourless to whitish tabular crystals, up to 5 mm across (Fig. 1), associated with krausite, halotrichite and coquimbite. These samples were carefully investigated during the present study.
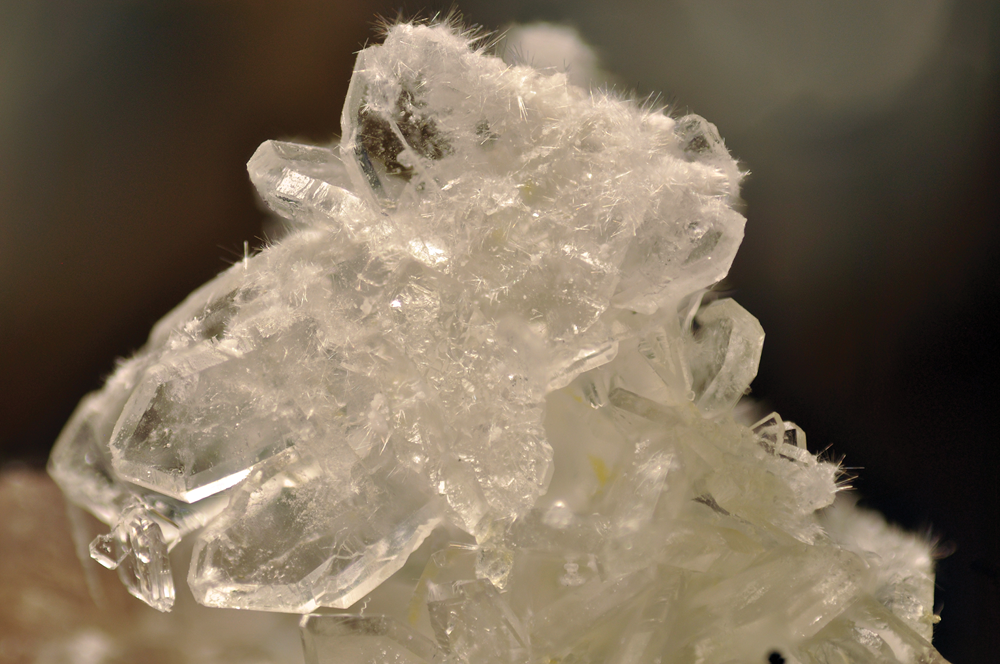
Fig. 1. Colourless tabular crystals of khademite, up to 5 mm in size, associated with halotrichite (hairy). Monte Arsiccio mine, Apuan Alps, Italy.
Chemical analysis
Quantitative chemical data were collected on the same tabular crystal used for single-crystal X-ray diffraction study using a Superprobe JEOL JXA 8200 electron microprobe at the Eugen F. Stumpfl laboratory, Leoben University, Austria. The analytical conditions were: wavelength dispersive spectroscopy mode, accelerating voltage 15 kV, beam current 10 nA and beam diameter 20 μm. Standards (element, emission line) were: pyrite (SKα), kaersutite (AlKα) and fluorite (FKα). Iron was sought but was below the detection limit. The ZAF routine was applied for the correction of recorded raw data. Counting times were 20 s for peak and 10 s for left and right background. Quantitative chemical data are given in Table 1.
Table 1. Electron microprobe data of khademite.
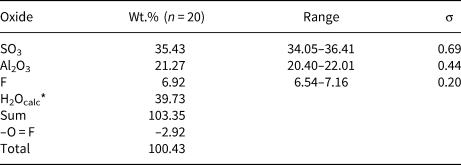
*Calculated in agreement with structural data. σ = estimated standard deviation.
Micro-Raman spectroscopy
Micro-Raman spectra of khademite were collected on the same polished sample used for the quantitative chemical analysis using a Horiba Jobin-Yvon XploRA Plus apparatus, with a 50× objective lens and the 532 nm line of a solid-state laser attenuated to 25% (i.e. 6.25 mW). The spectra were collected in the range between 100 to 4000 cm–1, through multiple acquisitions (three) with single counting times of 60 s. Back-scattered radiation was analysed with a 1200 gr/mm grating monochromator. The collected Raman spectrum is shown in Fig. 2, whereas Table 2 gives the observed Raman bands and their interpretation. Band fitting of the O–H stretching region was performed using Fityk (Wojdyr, Reference Wojdyr2010).
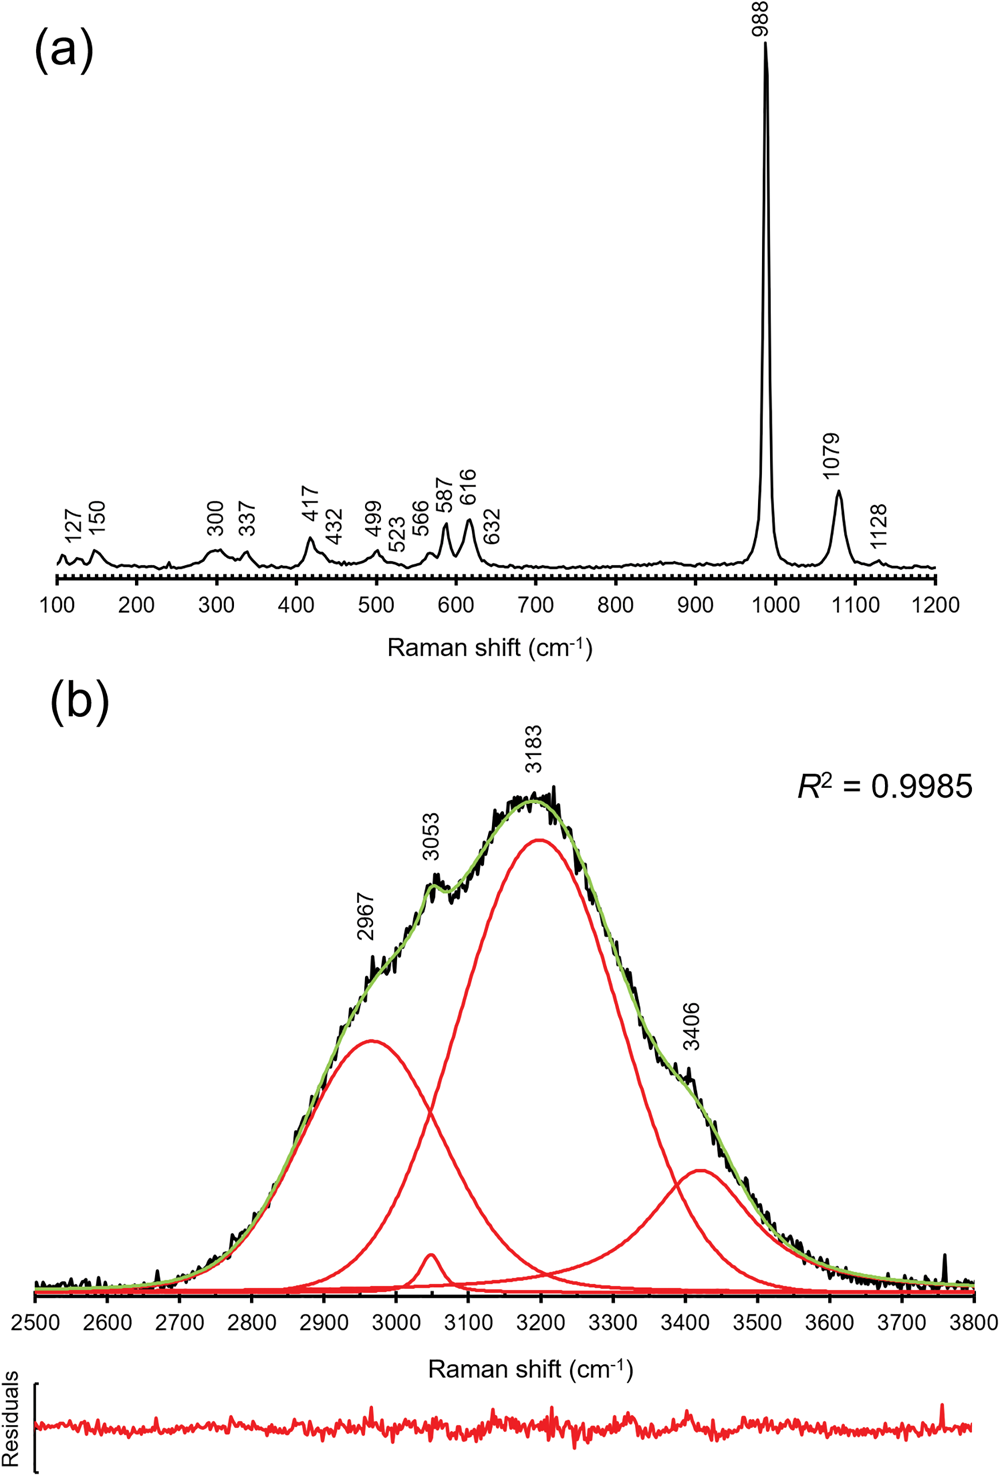
Fig. 2. Raman spectrum of khademite and band positions in the regions 100–1200 cm–1 (a) and 2500–3800 cm–1 (b); in (b) the cumulative curve is shown in green whereas fitted bands are red. The plot of residuals and the R 2 value are also shown.
Table 2. Raman bands (cm−1) of khademite and their assignments. For the sake of comparison, spectra of khademite and its (OH)-analogue rostite previously published have been reported.
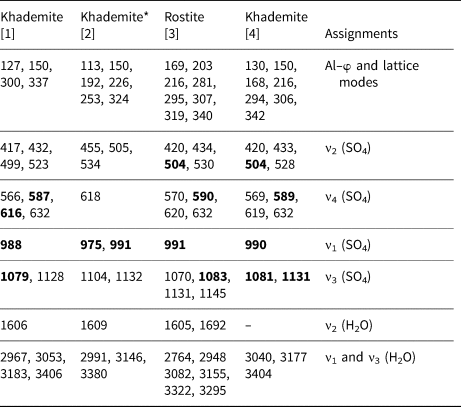
[1] This study; [2] Frost et al. (2013b); [3] Frost et al. (2015); [4] Košek et al. (2019)
* Questionable. The strongest Raman bands are shown in bold.
X-ray crystallography
X-ray intensity data were collected using a Bruker Smart Breeze diffractometer (50 kV and 30 mA) equipped with a Photon II CCD detector. Graphite-monochromatised MoKα radiation was used. The detector-to-crystal working distance was 50 mm. Intensity data were integrated and corrected for Lorentz-polarisation, background effects and absorption, using Apex3 software (Bruker AXS Inc., 2016), resulting in a set of 17,350 reflections. The refined unit-cell parameters are a = 11.1713(2), b = 13.0432(3), c = 10.8815(2) Å, V = 1585.54(5) Å3 and Z = 8. Space group Pcab was suggested by the statistical tests on |E| values (|E 2–1| = 0.953) and by the examination of systematic absences. The crystal structure of khademite was refined using Shelxl-2018 (Sheldrick, Reference Sheldrick2015), starting from the atomic coordinates given by Bachet et al. (Reference Bachet, Cesbron and Chevalier1981). Taking into account the results of the electron microprobe analysis, the site scattering at the Al, S, F, O and H sites was modelled using neutral site-scattering curves taken from the International Tables for Crystallography (Wilson, Reference Wilson1992). Although the coordinates of H atoms were given by Bachet et al. (Reference Bachet, Cesbron and Chevalier1981), their positions for the sample from Monte Arsiccio have been sought in the difference-Fourier maps. Soft restraints were applied to O–H bonds, in order to avoid unrealistically short distances. The crystal-structure refinement of khademite, after several cycles of anisotropic refinement (with the exception of H atoms, which were refined isotropically), converged to R 1 = 0.0293 for 2359 unique reflections with F o > 4σ(F o) and 152 refined parameters. Details of data collection and refinement are given in Table 3. Fractional atomic coordinates and isotropic or equivalent isotropic displacement parameters are reported in Table 4, whereas selected bond distances are shown in Table 5. Finally, the geometrical features of the hydrogen bonds are given in Table 6. Table 7 reports the bond-valence sum (BVS) calculations, performed using the bond parameters of Brese and O'Keeffe (Reference Brese and O'Keeffe1991) for Al–O, Al–F, and S–O bonds; simplified bond-valences, agreeing with Brown and Altermatt (1985), are reported for H bonds. The crystallographic information file has been deposited with the Principal Editor of Mineralogical Magazine and is available as Supplementary material (see below).
Table 3. Summary of crystal data and parameters describing data collection and refinement for khademite.
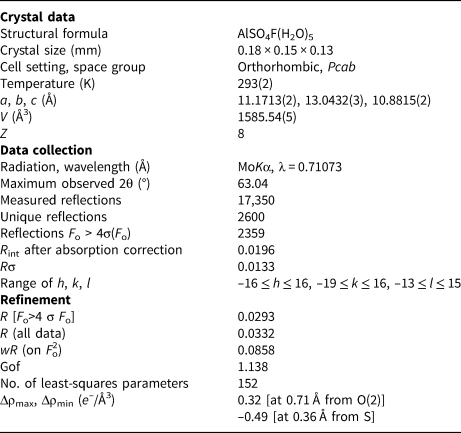
Table 4. Sites, fractional atom coordinates and isotropic (*) or equivalent isotropic displacement parameters in khademite.
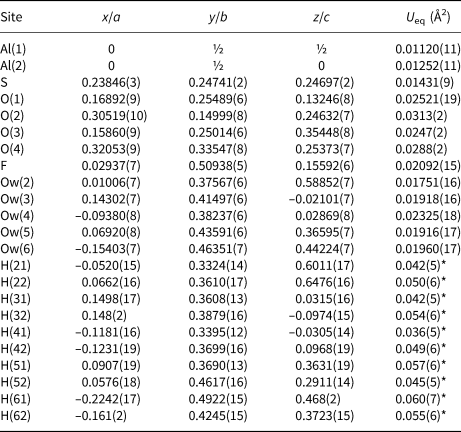
Table 5. Selected bond distances (Å) in khademite.
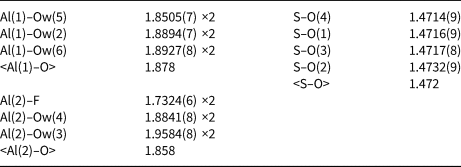
Table 6. Hydrogen-bond lengths (Å) and angles (°) for khademite.
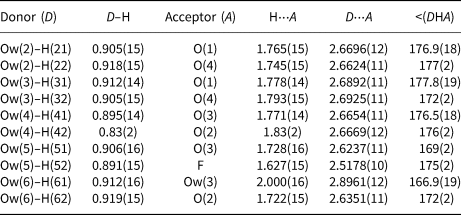
Table 7. Bond-valence sums (in valence units) for khademite.
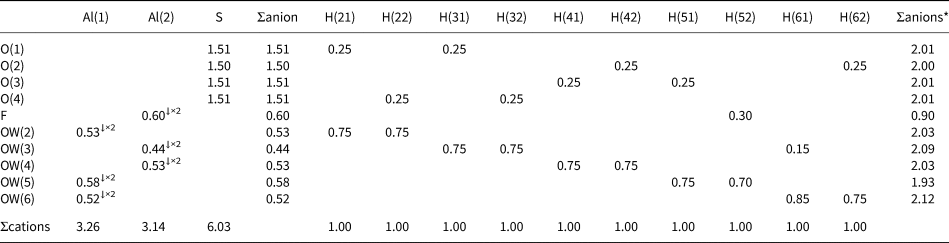
Note: right superscripts indicate the number of equivalent bonds involving anions. The BVS at H sites have been simplified. The symbol * indicates the BVS at anion sites after correction for H bonds. The bond parameters of Brese and O'Keeffe (Reference Brese and O'Keeffe1991) were used for Al–O, Al–F and S–O bonds; simplified bond-valences, agreeing with Brown and Altermatt (1985), are reported for H bonds
Results and discussions
Chemical data
The occurrence of fluorine in the crystal structure of khademite has been debated for a long time. Indeed, the detection and quantification of this light element is not an easy task (e.g. Stormer et al., Reference Stormer, Pierson and Tacker1993; Raudsepp, Reference Raudsepp1995; Ottolini et al., Reference Ottolini, Cámara and Bigi2000). Quantitative chemical data of khademite, including F, have been reported by Žáček and Povondra (Reference Žáček and Povondra1988), Williams and Cesbron (Reference Williams and Cesbron1983) and Košek et al. (Reference Košek, Žáček, Škoda, Laufek and Jehlička2019).
Data given in Table 1, recalculated on the basis of 10 anions per formula unit (pfu), assuming the occurrence of 5 H2O and 1 (F+OH) pfu, in agreement with our structural data, gives the following chemical formula for khademite from the Monte Arsiccio mine: Al0.96S1.02O4[F0.84(OH)0.16]Σ1.00⋅5H2O. It agrees with the ideal formula Al(SO4)F⋅5H2O. The sample studied was chemically homogeneous and no significant F variations were observed among the twenty spot analyses, suggesting rather constant F/OH ratios.
Micro-Raman spectroscopy
The Raman spectrum of khademite (Fig. 2) is characterised by the occurrence of the four fundamental modes of the SO4 group and by the O–H stretching vibration modes due to the H2O groups hosted in its crystal structure. Two spectral regions can be recognised, i.e. between 100–1200 cm–1 and between 2500–3800 cm–1. The former region (Fig. 2a) is characterised by bending and stretching modes of the SO4 group, located between 400 and 1130 cm–1, and by the vibration modes of Al–φ (φ = O or F) bonds and/or to lattice vibration modes, below 400 cm–1. The symmetric bending modes (ν2) of the SO4 group are characterised by bands at 417, 432, 499 and 523 cm–1 whereas the bands due to the antisymmetric bending modes (ν4) occur at 566, 587, 616 and 632 cm–1. The strongest band at 998 cm–1 is due to the symmetrical stretching mode (ν1) of the SO4 group. The weaker bands at 1079 and 1128 cm–1 are attributed to the antisymmetrical stretching mode (ν3) of the SO4 group. In the region between 2500 and 3800 cm–1 a broad multi-component band related to the O–H stretching modes of H2O groups occurs. This band can be compared with that observed by Košek et al. (Reference Košek, Žáček, Škoda, Laufek and Jehlička2019) who established the peak position through a basic peak-finding routine, reporting the presence of three bands at 3040, 3177 and 3404 cm–1; these values agree with those measured (using a similar peak-finding routine) in the sample of khademite from Monte Arsiccio, i.e. 3053, 3183 and 3406 cm–1. In addition, a shoulder at 2967 cm–1 was observed. In addition, a fitting of the spectrum using theoretical peak shapes (i.e. Voigt function) was performed from the sample from Monte Arsiccio, revealing the occurrence of at least four main bands, at 2966, 3047, 3197 and 3420 cm–1 (Fig. 2b). These components are probably related to the occurrence of relatively strong H bonds in khademite, as shown in Table 6 and discussed below. For instance, six out of the ten O⋅⋅⋅O distances reported in Table 6 range between 2.662 and 2.692 Å, corresponding to frequencies of 3053 and 3166 cm–1 according to the relationship of Libowitzky (Reference Libowitzky1999). The maxima of the broad Raman bands are in agreement with such an interpretation. Košek et al. (Reference Košek, Žáček, Škoda, Laufek and Jehlička2019) interpreted the Raman band at 3404 cm–1 as due to the hydroxyl stretching mode. However, this is not proved by structural data and disagrees with previous data reported for sulfate minerals. Indeed, the occurrence of the O–H stretching modes due to the hydroxyl group should be observed at higher wavenumbers (e.g. Kong et al., Reference Kong, Wang, Freeman and Sobron2011; Ventruti et al., Reference Ventruti, Della Ventura, Bellatreccia, Lacalamita and Schingaro2016). In addition, two bands at 3524 and 3584 cm–1 were observed for OH units occurring in the crystal structure of creedite, Ca3Al2(SO4)(OH)2F8⋅2H2O, by Frost et al. (Reference Frost, Xi, Scholz, Lòpez and Granja2013a). Finally, as is discussed below, the possible occurrence of an OH group in khademite may be related to relatively long O⋅⋅⋅O distances, giving rise to a band at wavenumbers higher than 3500 cm–1.
Bending modes due to the H–O–H bonds were observed at 1606 cm–1. On the contrary, Košek et al. (Reference Košek, Žáček, Škoda, Laufek and Jehlička2019) observed no bending modes in their Czech sample, whereas Frost et al. (Reference Frost, Scholz, Lima and Lòpez2015) reported two bending modes at 1605 and 1692 cm–1 in rostite. Table 2 compares our results with available micro-Raman spectroscopic data collected on both khademite and its (OH)-analogue rostite. Data for the Monte Arsiccio sample are in good agreement, within experimental uncertainties, with those given by Frost et al. (Reference Frost, Scholz, Lima and Lòpez2015) and Košek et al. (Reference Košek, Žáček, Škoda, Laufek and Jehlička2019). On the contrary, the sample of khademite studied by Frost et al. (Reference Frost, Scholz, Lòpez and Xi2013b) shows a completely different Raman spectrum; this disagreement is probably due to the fact that these authors studied a specimen that had not been fully-characterised. It is very likely that their spectrum does not belong to khademite.
Single-crystal X-ray diffraction
Description of the crystal structure: cation coordinations and general features
Three cation sites, namely Al(1), Al(2) and S, along with ten anion positions occur in the crystal structure of khademite, along with ten H sites.
Aluminium is hosted at the Al(1) and Al(2) sites. Both positions show an octahedral coordination; in the former site, Al atoms are coordinated by H2O groups only, whereas in the Al(2) site, four H2O groups and two F anions are bonded to Al. Bond distances at the Al(1) polyhedra range between 1.85 and 1.89 Å, in agreement with those previously reported by Bachet et al. (Reference Bachet, Cesbron and Chevalier1981), i.e. 1.85 and 1.89 Å. The Al(2)-centred polyhedron is more distorted than the Al(1)-centred polyhedron with bond distances ranging from 1.73 and 1.95 Å. According to Bachet et al. (Reference Bachet, Cesbron and Chevalier1981), the shortest distance can be attributed to the Al–F bond. The longest distance is the Al(2)–Ow(3). It is worth noting that this distance is longer than all the other Al–Ow distances observed in the crystal structure of khademite and it is related to the fact that the H2O group at Ow(3) is the only H2O group receiving an H bond; in fact, the elongation of the Al–Ow distance favours a reduction of the BVS and the possibility that it can accept the additional H bond from Ow(6) (Table 7). The average <Al–φ> distances are 1.878 and 1.858 Å for Al(1) and Al(2) sites, respectively. The BVS for the Al(1) and Al(2) sites (Table 7) are 3.26 and 3.14 valence units (vu), respectively. The isolated SO4 group has an average <S–O> distance of 1.472 Å, in agreement with those reported in sulfate minerals by Hawthorne et al. (Reference Hawthorne, Krivovichev, Burns, Alpers, Jambor and Nordstrom2000), i.e. 1.473 Å. The corresponding BVS at the S site is 6.03 vu (Table 7).
The crystal structure of khademite (Fig. 3) can be described as a layered structure. Indeed, it is characterised by the alternation of two different kinds of {010} layers. The first one (hereafter indicated as A) is formed by two independent isolated Al-centred octahedra, having chemical composition Al(H2O)6 and Al(H2O)4F2, respectively. These octahedra are connected through H bonds, forming rows running along [001]. Every A layer has the chemical composition [Al4(H2O)20F4]8+. The other layer (B layer) is formed only by isolated SO4 groups; in each layer, four independent SO4 groups occur. The connection between adjacent A and B layers occurs through the oxygen atoms of SO4 groups that act as acceptor of H bonds from H2O coordinating Al atoms. In each unit cell, two A and B layers occur. Consequently, the unit-cell content is 2 × [Al4(H2O)20F4]8+ + 2 × [(SO4)4]8– = Al8(SO4)8F8(H2O)40 (Z = 1), corresponding to the end-member formula of khademite, Al(SO4)F(H2O)5 (Z = 8).
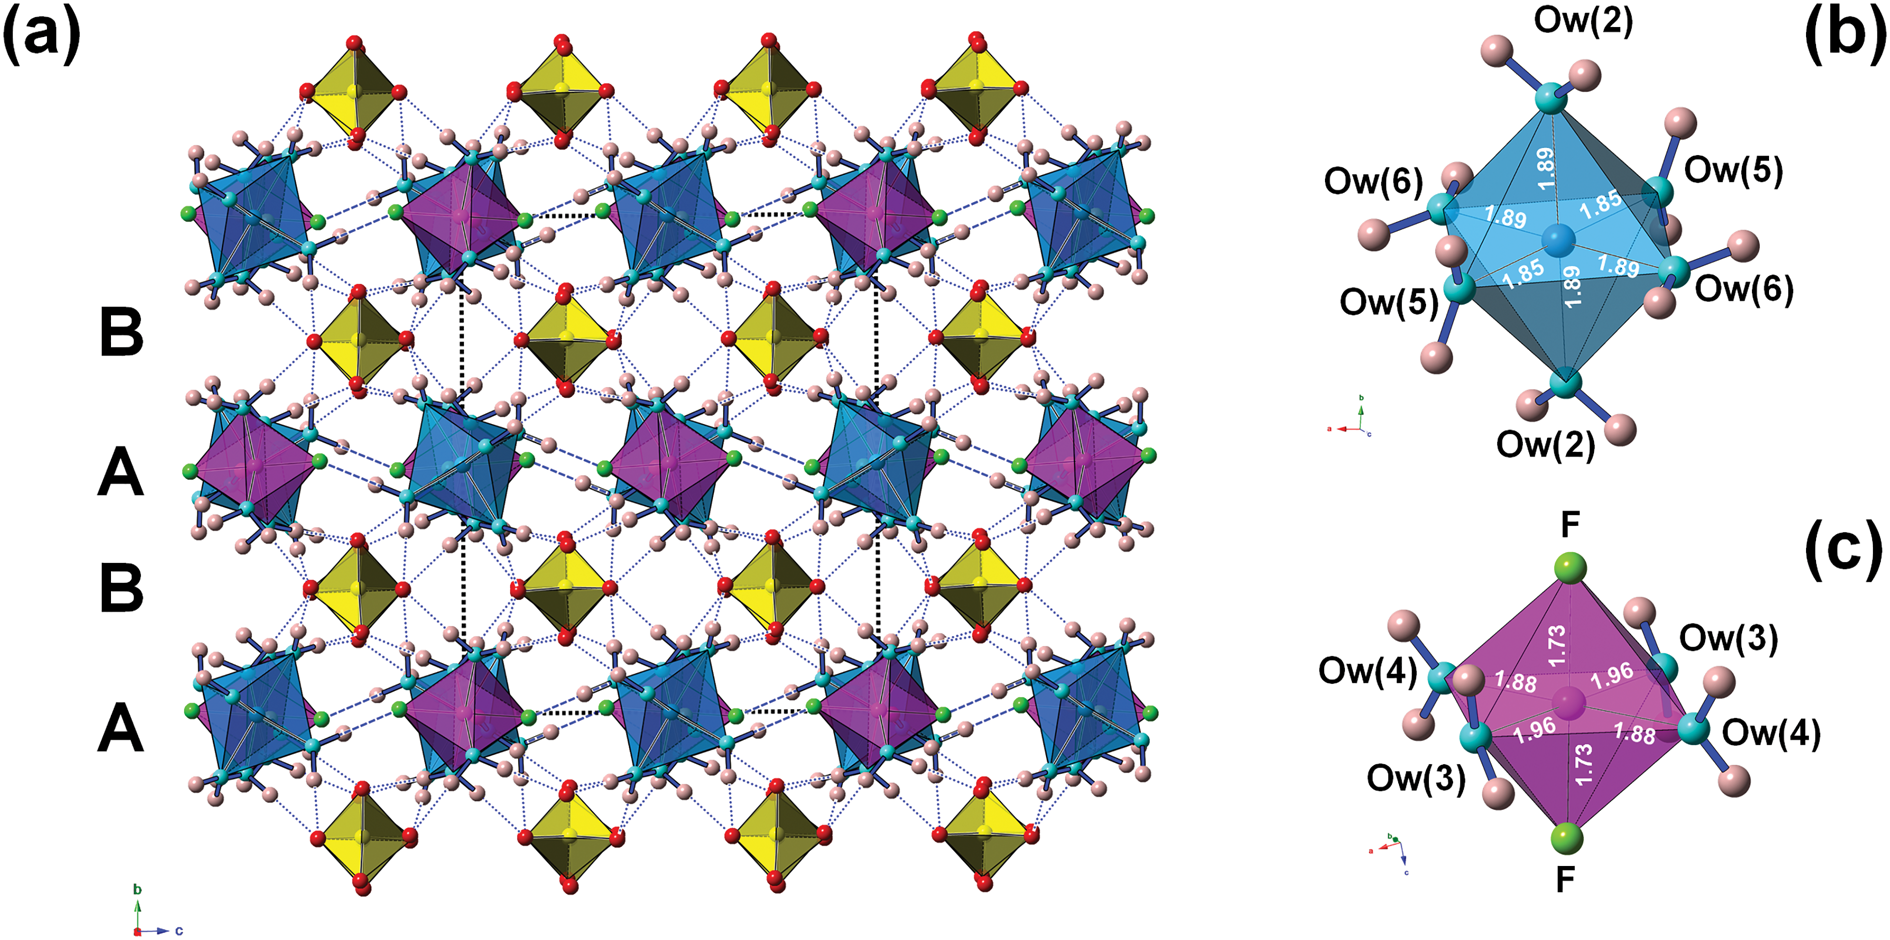
Fig. 3. The crystal structure of khademite (a), as seen down a; letters A and B indicate the two different {010} layers. Dashed and dotted blue lines represent F⋅⋅⋅O distances and H⋅⋅⋅O distances shorter than 1.95 Å, respectively. The unit cell is shown as dashed black lines. Polyhedra: light blue = Al(1)-centred octahedra; violet = Al(2)-centred octahedra (c); yellow = S-centred tetrahedra. Circles: red = O atoms of the SO4 group; light blue = O atoms of the H2O groups; pink = H atoms; and green = F atoms. Details of the coordination of Al(1) and Al(2) are shown in (b) and (c), respectively; bond distances (in Å) are shown.
Hydrogen bonding
Table 7 highlights that all the atoms hosted at the ten independent anion positions occurring in the crystal structure of khademite are underbonded. Two groups of anions can be distinguished: a first group has BVS of ~ 1.5 vu, whereas a second group has BVS ranging between 0.4 and 0.6 vu. This observation suggests that H bonds play a key role in the stabilisation of the crystal structure of khademite. The geometrical features of H bonds given in Table 6 match those found by Bachet et al. (Reference Bachet, Cesbron and Chevalier1981). On the basis of the O⋅⋅⋅O distances, d, the ten H bonds can be grouped into three types: (1) very strong [d = 2.52 Å – one H bond], (2) strong [2.6 < d < 2.7 Å – eight H bonds], and (3) weak [d ≈ 2.9 Å – one H bond]. All O atoms bonded to S have BVS ≈1.5 vu and each of these O atoms receives two similar strong H bonds. The valence-sum rule therefore suggests each of these bonds is 0.25 vu in strength; this value is in agreement with Fig. 2 of Brown and Altermatt (Reference Brown and Altermatt1985) as well as the relationship of Ferraris and Ivaldi (Reference Ferraris and Ivaldi1988), giving BVS for these strong H bonds ranging between 0.23 and 0.27 vu. Consequently, in Table 7 all strong H bonds can be assigned a bond strength of 0.25 vu. On similar ground, the very strong H bond can be assigned a value of 0.30 vu, considering that the acceptor is F (see figure 1 in Brown and Altermatt, Reference Brown and Altermatt1985), whereas 0.15 vu are attributed to the weak H bond.
In detail, the H2O groups coordinating the Al(1) and Al(2) sites, namely Ow(2)–Ow(5) act as donors of strong H bonds to the O atoms belonging to the SO4 group. The Ow(6) atom is the donor of a strong H bond to an oxygen atom belonging to the SO4 group, i.e. O(2), and of a weak bond to Ow(3), as discussed above. The F atom is the acceptor of a very strong H bond from Ow(5). The role of F as an acceptor of H bonds agrees with the previous structural model proposed by Bachet et al. (Reference Bachet, Cesbron and Chevalier1981) and was observed in other rare sulfate minerals (e.g. wilcoxite, MgAl(SO4)2F⋅17H2O; Mauro et al., Reference Mauro, Biagioni, Pasero and Skogby2019).
Can rostite be a valid mineral species?
Khademite and its (OH)-analogue rostite have a troubled history, as summarised by Košek et al. (Reference Košek, Žáček, Škoda, Laufek and Jehlička2019). These authors stated that the crystal structure study of khademite performed by Bachet et al. (Reference Bachet, Cesbron and Chevalier1981) “found that the atomic positions in the structure were so small that they require the presence of fluorine, and that the presence of OH in the structure was not possible.” It is not clear what Košek et al. (Reference Košek, Žáček, Škoda, Laufek and Jehlička2019) mean when they state that “the atomic positions […] were so small”. A critical reading of the original paper by Bachet et al. (Reference Bachet, Cesbron and Chevalier1981) reveals the actual reason leading the authors to hypothesise the occurrence of F, without the support of any chemical data. Indeed, Bachet et al. (Reference Bachet, Cesbron and Chevalier1981) were not able to locate the H atom related to the OH group and they observed a slight electron density residual on that O atom, supporting the occurrence of a slightly heavier atom. In this hypothesis, Bachet et al. (Reference Bachet, Cesbron and Chevalier1981) were supported by the association of khademite with another fluo-sulfate, wilcoxite. Finally, the examination of the H-bond system around F suggested the impossibility of locating an OH group at this position.
The impossibility of locating an OH group in the crystal structure of khademite could have some implications for the actual existence of its (OH)-analogue, rostite, ideally Al(SO4)(OH)(H2O)5. Indeed, to the best of our knowledge, only a sample of rostite from the Cetine di Cotorniano mine, Tuscany, Italy, has been reported in the literature, with OH slightly dominant over F (Sabelli, Reference Sabelli1984). However, in agreement with Košek et al. (Reference Košek, Žáček, Škoda, Laufek and Jehlička2019), we find the correctness of the chemical data of Sabelli (Reference Sabelli1984) questionable.
Bachet et al. (Reference Bachet, Cesbron and Chevalier1981) described the coordination environment of F atoms, highlighting that they are acceptors of H bonds from Ow(5). If F is replaced by OH, then OH would be donor to Ow(2), with a bond distance of ~3.19 Å but with a too small Ow(5)–OH–Ow(2) angle of ~55°. For this reason, Bachet et al. (Reference Bachet, Cesbron and Chevalier1981) wrote that it was impossible to replace F with OH groups in khademite. Taking into account the result of the refinement performed on the sample from Monte Arsiccio, the structural features described by Bachet et al. (Reference Bachet, Cesbron and Chevalier1981) are confirmed (Fig. 4a). As regards the possible existence of the (OH)-analogue, we argue that the replacement of F by OH might favour an increase in the Al–φ distance, e.g. up to 1.84 Å, in order to supply a similar BVS (0.60 vu). The strong contribution from H(52) could be retained; taking into account a similar H⋅⋅⋅O distance as observed in khademite, a bond strength of ~0.35 vu can be proposed on the basis of Brown and Altermatt (Reference Brown and Altermatt1985). In order to have a BVS of ~2 vu at the O atom occurring at the OH position, a strong donor contribution (e.g. ~0.95 vu) is required. This would necessitate a distant O acting as acceptor, that would receive a weak H bond (e.g. ~0.05 vu). In the crystal structure of khademite there are two possible O anions, Ow(2) (as proposed by Bachet et al., Reference Bachet, Cesbron and Chevalier1981) and O(4). Whereas Ow(2) was excluded by Bachet et al. (Reference Bachet, Cesbron and Chevalier1981) in order to avoid too small an Ow(5)–OH–Ow(2) angle (i.e., ~55°), a reasonable angle of ~95° can be formed with O(4). A hypothetical H-bond scheme involving these atoms is shown in Fig. 4b. The BVS at O(4) would be 2.06 vu; if one considers the distance measured in the crystal structure of khademite (~3.25 Å), a bond strength of 0.10 vu can be calculated using the relationship of Ferraris and Ivaldi (Reference Ferraris and Ivaldi1988), whereas a value close to 0 vu can be hypothesised following Brown and Altermatt (Reference Brown and Altermatt1985). Minor structural changes could probably be associated with the F–OH replacement, improving the structural fitting with respect to this chemical substitution.
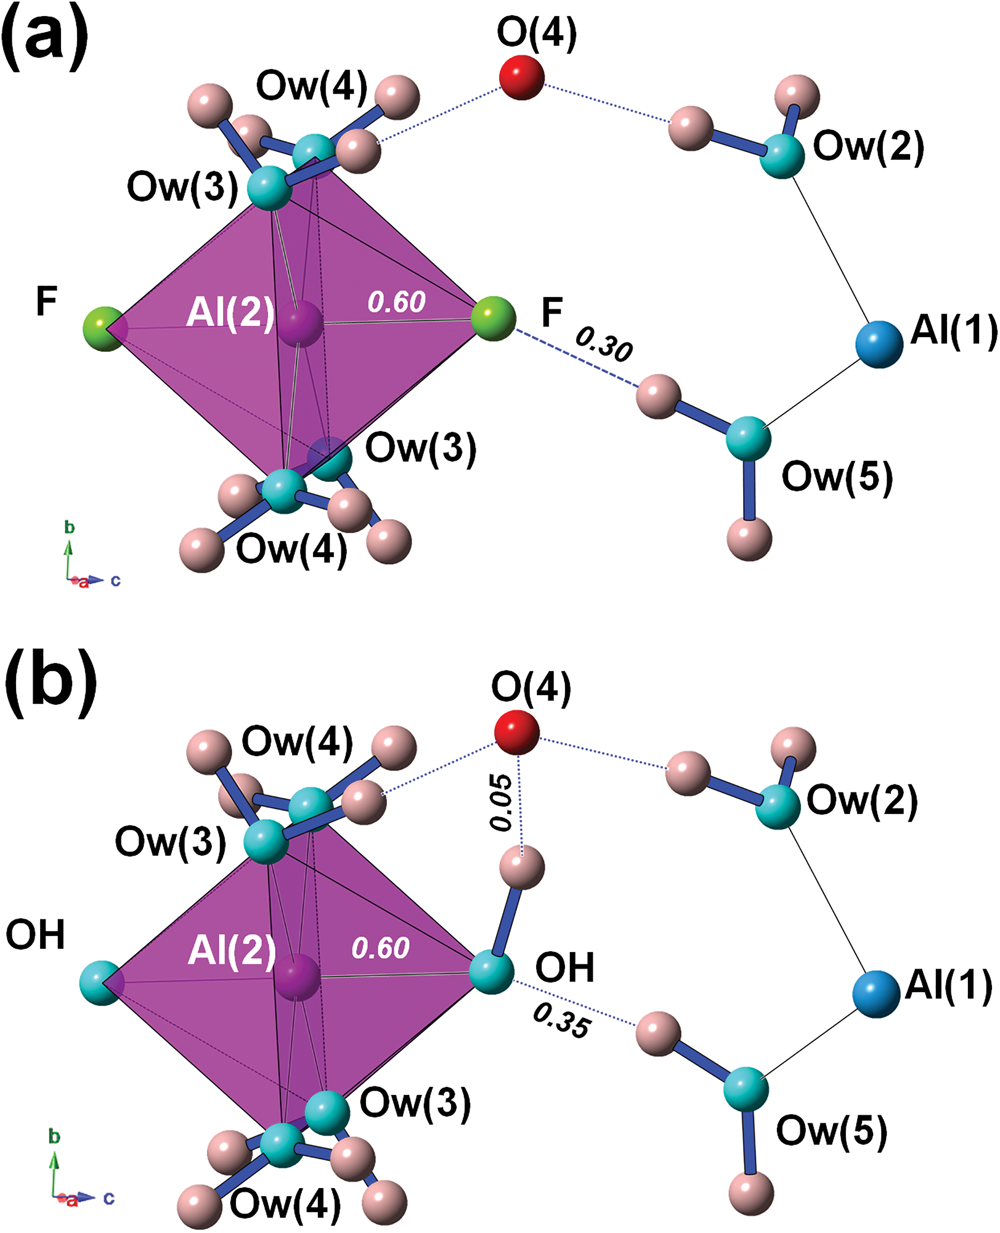
Fig. 4. The H-bond system around the F atom in khademite (a) and a hypothetical configuration with F replaced by OH (b). Same symbols as in Fig. 3. Bond strengths around the monovalent anion are shown in italics (in vu).
This discussion does not aim to prove that rostite actually exists. Indeed, as written above, the only available data are those of Sabelli (Reference Sabelli1984) and they are questionable. On the contrary, we aim to demonstrate that there are no apparent impediments to the occupation of a univalent anion site by OH within the khademite structure, in disagreement with the hypothesis of Bachet et al. (Reference Bachet, Cesbron and Chevalier1981). Rostite may be a valid mineral species, but more sound chemical data are required to confirm its existence.
Conclusions
The occurrence of khademite at the Monte Arsiccio mine allowed the collection of high-quality single-crystal X-ray diffraction data and electron microprobe analyses, improving the crystal-chemical knowledge of this rare fluo-sulfate and confirming previous results reported by Bachet et al. (Reference Bachet, Cesbron and Chevalier1981). Taking into account that all H2O groups are bonded to Al atoms, the chemical formula of khademite could be written as Al(SO4)F(H2O)5.
In addition, the critical examination of available Raman spectroscopic data highlighted some discrepancies in the published spectra. Indeed, whereas the data reported by Frost et al. (Reference Frost, Scholz, Lima and Lòpez2015) for rostite from Le Cetine di Cotorniano, Italy and Košek et al. (Reference Košek, Žáček, Škoda, Laufek and Jehlička2019) for khademite from Libušín, Czech Republic agree, within experimental uncertainties, with those collected on the Monte Arsiccio sample, the Raman spectrum of khademite reported by Frost et al. (Reference Frost, Scholz, Lòpez and Xi2013b) does not fit with previous and current results. These observations have a two-fold implication. On the one hand, the strong similarity between the Raman spectra of rostite and khademite confirms the uncertain distinction between these two phases, although current structural data show no impediment to the existence of the (OH)-analogue of khademite. On the other hand, the discrepancy observed between the spectra of khademite and the data published by Frost et al. (Reference Frost, Scholz, Lòpez and Xi2013b) highlights the importance of using samples that have been crystal-chemically well-characterised during Raman studies.
Supplementary material
To view supplementary material for this article, please visit https://doi.org/10.1180/mgm.2020.51
Acknowledgements
Mario Bianchini is thanked for providing us with the specimen of khademite from the Monte Arsiccio mine. CB acknowledges financial support from the University of Pisa through the project P.R.A. 2018-2019 “Georisorse e Ambiente” (Grant No. PRA_2018_41). The authors are grateful to the University Centrum for Applied Geosciences (UCAG) for the access to the E. F. Stumpfl electron microprobe laboratory. The authors wish to thank Mark Cooper for his critical revision, which greatly improved the discussion of the H bonds in khademite and suggested a comparison with rostite. The comments of the other two anonymous reviewers were also appreciated.


 Open access