


Introduction
Oral cancer is a major health problem worldwide owing to its high incidence and low survival rate (Nigudkar et al., Reference Nigudkar, Chaudhary, Gawande, Patil, Hande and Kanthale2016). In India, the development of oral precancerous lesions is very common, and one of the major contributors for the high incidence of oral cancer. The altered epithelium possesses a higher propensity for malignant transformation if it remains undetected and untreated (Yardimci et al., Reference Yardimci, Kutlubay, Engin and Tuzun2014). Therefore, the current challenge is to develop strategies for early detection of subcellular changes taking place in the epithelium which may lead to malignant transformation of the cell over a period of time.
Oral carcinogenesis is a multistep process which goes step-wise transformation from normal to pre-malignant to invasive carcinoma (MacFarlane & R Murphy, Reference MacFarlane and R Murphy2010). Currently, light microscopy is commonly used for histopathological diagnosis. However, it is possible that the changes at an early stage and not yet fully developed may remain undetected due to the limited resolving power of light microscope. Electron microscope (EM) is a promising tool producing high-resolution images providing subcellular information about structure, texture, size, and shape of the cellular organelles. Previous reports suggest that the transmission electron microscope (TEM) can detect fine the ultrastructural changes which take place during malignant transformation of epithelial cells and the progression of oral squamous cell carcinoma (OSCC), as an adjunct to histopathology (Kannan et al., Reference Kannan, Balaram, Chandran, Pillai, Pillai, Nalinakumari, Nair and Kartha1996; Cheng & Hudson, Reference Cheng and Hudson2002).
Tissue adhesion is essential to maintain the architecture, integrity and function of epithelium and it is based on the interactions between cell–cell and cell–stroma (Kowalczyk & Green, Reference Kowalczyk and Green2013). Desmosomes are cadherin-based intercellular adherens junctions that confer strong homotypic cell—cell adhesion by tethering to intermediate filaments (IF) and thereby to plasma membranes (Garrod & Chidgey, Reference Garrod and Chidgey2008). Desmosomes are specialized for strong adhesion and their failure can result in various skin disorders including cancer (Papagerakis et al., Reference Papagerakis, Shabana, Pollock, Papagerakis, Depondt and Berdal2009). At the ultrastructural level, desmosomes appear as electron dense discs approximately 0.2–0.5 µm in diameter, which assemble into a mirror image arrangement on neighboring cell membranes (Kowalczyk & Green, Reference Kowalczyk and Green2013). A central core region of desmosomes spans the intercellular space (ICS) between adjacent cell membranes and separates two identical cytoplasmic plaques. The width of ICS has been reported between 20 and 35 nano meters (nm) in human normal epidermis (Garrod & Chidgey, Reference Garrod and Chidgey2008).
Desmoplakin is one of the major components of the desmosome and the most abundantly expressed protein from the plakin family (Kowalczyk & Green, Reference Kowalczyk and Green2013). Previous studies have reported that alterations in the expression and localization of desmosomal proteins resulted into poor prognosis in patients with OSCC (Papagerakis et al., Reference Papagerakis, Shabana, Pollock, Papagerakis, Depondt and Berdal2009; Dusek & Attardi, Reference Dusek and Attardi2011). In these studies, the authors have focused on tumor tissues only. However, oral carcinogenesis is a multistep process, and hence, it is important to explore the changes taking place in cell adhesion at various sequential stages of the carcinogenesis process. Although, alterations in cell adhesion are associated with tumor progression, we hypothesize here that although the changes might be more detectable in an advanced stage of the disease they may initiate in the early stage of the disease. Electron microscopy can detect subcellular early changes to the epithelium that are not yet detectable using light microscopy.
However, it is difficult to get a complete series from the normal tissue throughout the progress of the disease from the same patients since tumorigenesis is an elaborate process and it needs a long term vigorous clinical follow-up. Nevertheless, animal models have been reported previously which can mimic the human system, and hence can be used for such studies (Herzig & Christofori, Reference Herzig and Christofori2002). It is known that oral carcinogenesis developed by chronic exposure to 4-Nitroquinoline-1-Oxide (4NQO) simulates the changes in the human system (Kandarkar et al., Reference Kandarkar, Sawant and Reade1998; Kanojia et al., Reference Kanojia, Sawant, Borges, Ingle and Vaidya2012). The tongue is the most common site for the development of OSCC, owing to the use of various forms of tobacco and alcohol consumption (Rao et al., Reference Rao, Mejia, Roberts-Thomson and Logan2013; Thandavamoorthy et al., Reference Thandavamoorthy, Balan, Subramaniyan, Arumugam, John, Krishnan, Ramasamy, Mani, Rajendran and Thiruvengadam2014). For our studies, our group has developed rat tongue carcinogenesis model using 4NQO as a carcinogenic agent (Kanojia et al., Reference Kanojia, Sawant, Borges, Ingle and Vaidya2012), which successfully produced major experimental stages of tongue carcinogenesis. Further, histopathology confirmed the development of dysplasia, papilloma and carcinoma in rats treated with 4NQO at 80/120 days, 160 days and 200 days, respectively (Kanojia et al., Reference Kanojia, Sawant, Borges, Ingle and Vaidya2012).
In the present study we have made efforts to establish morphological markers for early detection of altered epithelium using electron microscopy. We performed qualitative as well as quantitative ultrastructural analysis and immunogold labeling (IGL) on rat tongue tissues to evaluate the ultrastructural changes in cellular adhesion. For this, we quantified the ultrastructural parameters such as a number of desmosomes, ICS and length of desmosomes using iTEM software. Our results using light microscopy presented no histomorphological alterations in 40 days 4NQO treated tissues. However, the corresponding tissues imaged via EM showed increased number of desmosomes, detachment from cell membranes and clustering in the cytoplasm, thick and dense stratum corneum, increased keratohyaline granules and increased tonofilament bundles and all of these observations have the potential to be used for early diagnosis of the altered epithelium. Moreover, we found, as the disease progressed, the number of desmosomes significantly decreased and the ICS significantly increased.
Materials and Methods
A detailed protocol for the development of the 4NQO induced rat tongue carcinogenesis model has been described previously (Kanojia et al., Reference Kanojia, Sawant, Borges, Ingle and Vaidya2012). Briefly, a total of 168 Sprague Dawley rats were randomly and equally divided into three groups—a 4NQO treated group, a vehicle control group, and an untreated control group. Eight animals in each of these groups were given 0.001% 4NQO (Sigma Aldrich, USA) in drinking water three times a week for 10, 20, 40, 80, 120, 160, and 200 days, respectively. After each time point of treatment and prior to sacrifice, the animals were given normal drinking water for another 15 days, allowing for any possible regression of the lesions. At the end of each time points, animals were sacrificed using CO2 inhalation and the dissected dorsal tongue tissues were used in the present study.
Histopathology
At the pre-scheduled time points, animals were sacrificed and part of the dorsal tongue tissue of the controls and treatment groups of animals (n = 8 in each group) was processed for histopathology and electron microscopy. For histopathology, tissues were fixed in 10% buffered formalin and processed for paraffin embedding. Five micrometer thick sections were cut and stained with hematoxylin and eosin (H&E). Histopathological grading was done by experienced pathologists using light microscopy.
Transmission Electron Microscopy
Tissues were fixed in 3% glutaraldehyde (Ted Pella Inc, Redding, CA, USA) followed by 1% osmium tetroxide (EMS, Hatfield, PA, USA) at low temperature. After dehydration, tissues were embedded in Araldite CY212 (Ted pella Inc, USA) and polymerized at 60°C for 72 h (Sawant et al., Reference Sawant, Dongre, Singh, Joshi, Costea, Mahadik, Ahire, Makani, Dange and Sharma2016). From polymerized tissues, first, we cut semi-thin (1 µm) sections, stained with toluidine blue stain (Ted pella Inc, USA) and selected the region of interest (ROI) for ultrathin sectioning using the light microscope (Sawant et al., Reference Sawant, Dongre, Ahire, Sharma, Jamghare, Kansara, Rane, Kanojia, Patil and Chaukar2018). Next, 60 nm ultrathin sections were cut on an ultramicrotome (Leica ultracut UC7, Nussloch, Baden-Wuerttemberg, Germany) from the selected ROI and placed on copper/nickel grids. Sections were prepared for enhanced electron contrast with uranyl acetate and lead citrate (both reagents from Ted Pella Inc, USA) and imaged in a JEOL1400 plus TEM (JEOL, Ltd, Akashima, Japan) at 120 KV. Micrographs were captured using an Olympus Soft Imaging Solutions (SIS) CCD bottom-mount on-axis 5.3 megapixel camera (Model Tengra, Münster, Germany).
Integrated iTEM Software
We performed quantitative analysis of the number of desmosomes and ICS and the length of desmosomes using the integrated iTEM imaging platform (SIS, GmbH, Germany) as described previously (Sawant et al., Reference Sawant, Dongre, Ahire, Sharma, Jamghare, Kansara, Rane, Kanojia, Patil and Chaukar2018). Briefly, we acquired a minimum of 10 digital micrographs from widely spaced sections with uniform magnification for each sample and for each respective parameter. The number of desmosomes was counted by using the “touch count” tool of the iTEM software. For calculation of ICS, ten perpendicular lines were drawn in between the two adjacent cell membranes and recorded using the “arbitrary line” tool. The length of desmosomes was calculated using “Polyline” tool of iTEM. The mean values for each parameter, in each group of samples were determined in iTEM platform and then used for further statistical analysis.
Immunogold Labeling
Ultrathin sections from 3% glutaraldehyde and 1% osmium tetroxide-fixed tissues were collected on nickel grids and the grids were micro-waved in heat-induced antigen retrieval buffer (20mMTris-HCl, pH 9.0) for unmasking antigen-epitopes as described elsewhere (Yamashita & Okada, Reference Yamashita and Okada2014). We modified the original protocol in which the sections were first heated in microwave at 720 watts until the antigen retrieval buffer started boiling. Sections were kept for 30 s in the boiling buffer. The Petri-plate wells were replenished with additional buffer so as to keep the grids immersed and further sections were boiled for 10 s. Next, non-specific binding was blocked by incubating sections with 5% bovine serum albumin (BSA, Amresco, Solon, OH, USA). This was followed by incubating the sections with anti-desmoplakin I/II antibody (AbD Serotec, Kidlington, Oxford, UK) at dilution 1:30 in 1% BSA for 1 h at RT. Following washes with phosphate buffer saline (PBS), grids were incubated with secondary anti-rabbit antibody conjugated with 10 nm gold particles (Sigma Aldrich, St Louis, MO, USA) at 1:10 dilution for 1 h at RT. The secondary antibody was diluted in 1% BSA containing 0.1% fish skin gelatin (Sigma, MO, USA). After PBS washes, the sections were stained with uranyl acetate and lead citrate and micrographs were acquired using a JEOL 1,400 plus TEM (JEOL, Ltd, Akashima, Japan) at 120 KV. We measured the number of gold particles from a minimum of 10 micrographs per sample (n = 8) at fixed magnification using “touch count” tool of iTEM platform and mean values were used for comparative analysis. The specificity of the anti-desmoplakin antibody has been tested by Western blotting in our previous study (Kanojia et al., Reference Kanojia, Sawant, Borges, Ingle and Vaidya2012). Serum from the non-immunized rabbit in place of primary antibody was used as a negative staining control.
Statistical Analysis
The statistical analysis was performed to compare the mean values, derived by using iTEM analysis, for a number of desmosomes, the ICS and length of desmosomes. The comparative analysis was performed between control and treated tissues (hyperplasia, dysplasia, papilloma and carcinoma) by applying an unpaired-t test (Prism 5 GraphPad Software, La Jolla, CA, USA). Immunogold labeling, detecting expression of desmoplakin protein was compared between control and 4NQO treated tissues by applying an unpaired-t test. Differences with a probability value of <0.05 were considered statistically significant.
Results
Light Microscopy Revealed No Histopathological Alterations Till 40 Days of 4NQO Treatment
Light microscopic analysis on H&E stained sections revealed no morphological alterations till 40 days of 4NQO treatment, while, dysplasia, papilloma and carcinoma were detected at 80/120 days, 160 days and 200 days of 4NQO treatment (Figs. 1a–1e).
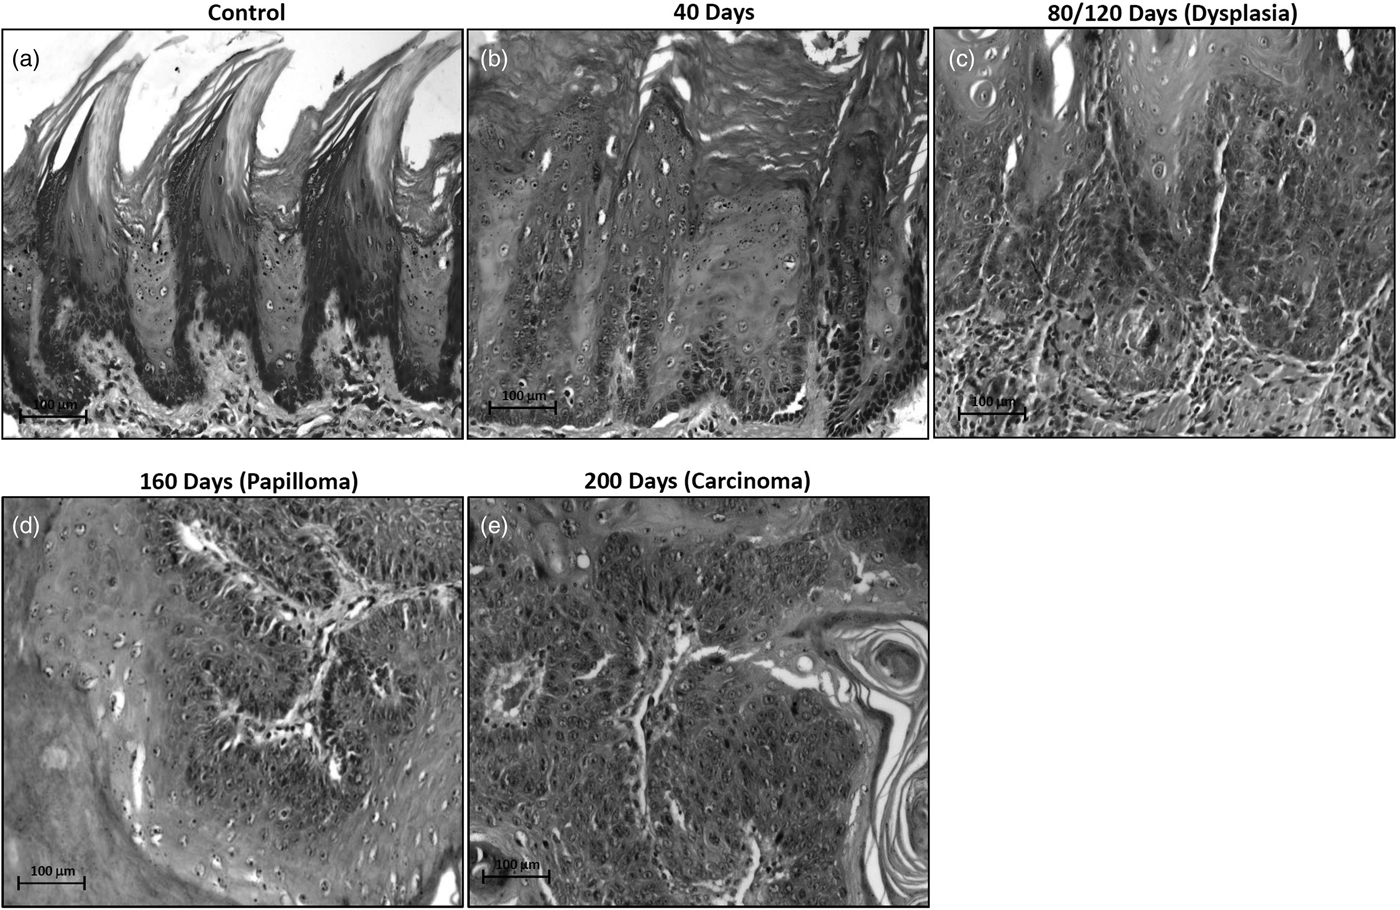
Fig. 1. Light microscopic photographs of hematoxylin and eosin stained sections showing the histomorphology of rat control and 4NQO treated tongue tissues. a: control- vehicle-treated tongue, (b) treated for 40 days displaying hyperkeratotic morphology, (c) treated for 80/120 days showing dysplastic changes, (d) treated for 160 days showing papillomatous structure, (e) treated for 200 days demonstrating well-differentiated squamous cell carcinoma.
Prior to ultrathin sectioning, we selected ROIs at the cutting frame by analyzing semi-thin sections (Fig. 2a). Further, we confirmed the ultrastructure of desmosomes in rat tissues by comparing it with previously reported data (Garrod & Chidgey, Reference Garrod and Chidgey2008; Delva et al., Reference Delva, Tucker and Kowalczyk2009). We found desmosomes with two dense plaques separated with a central core region and insertion of cytoplasmic IFs towards the cell membrane (Fig. 2b).
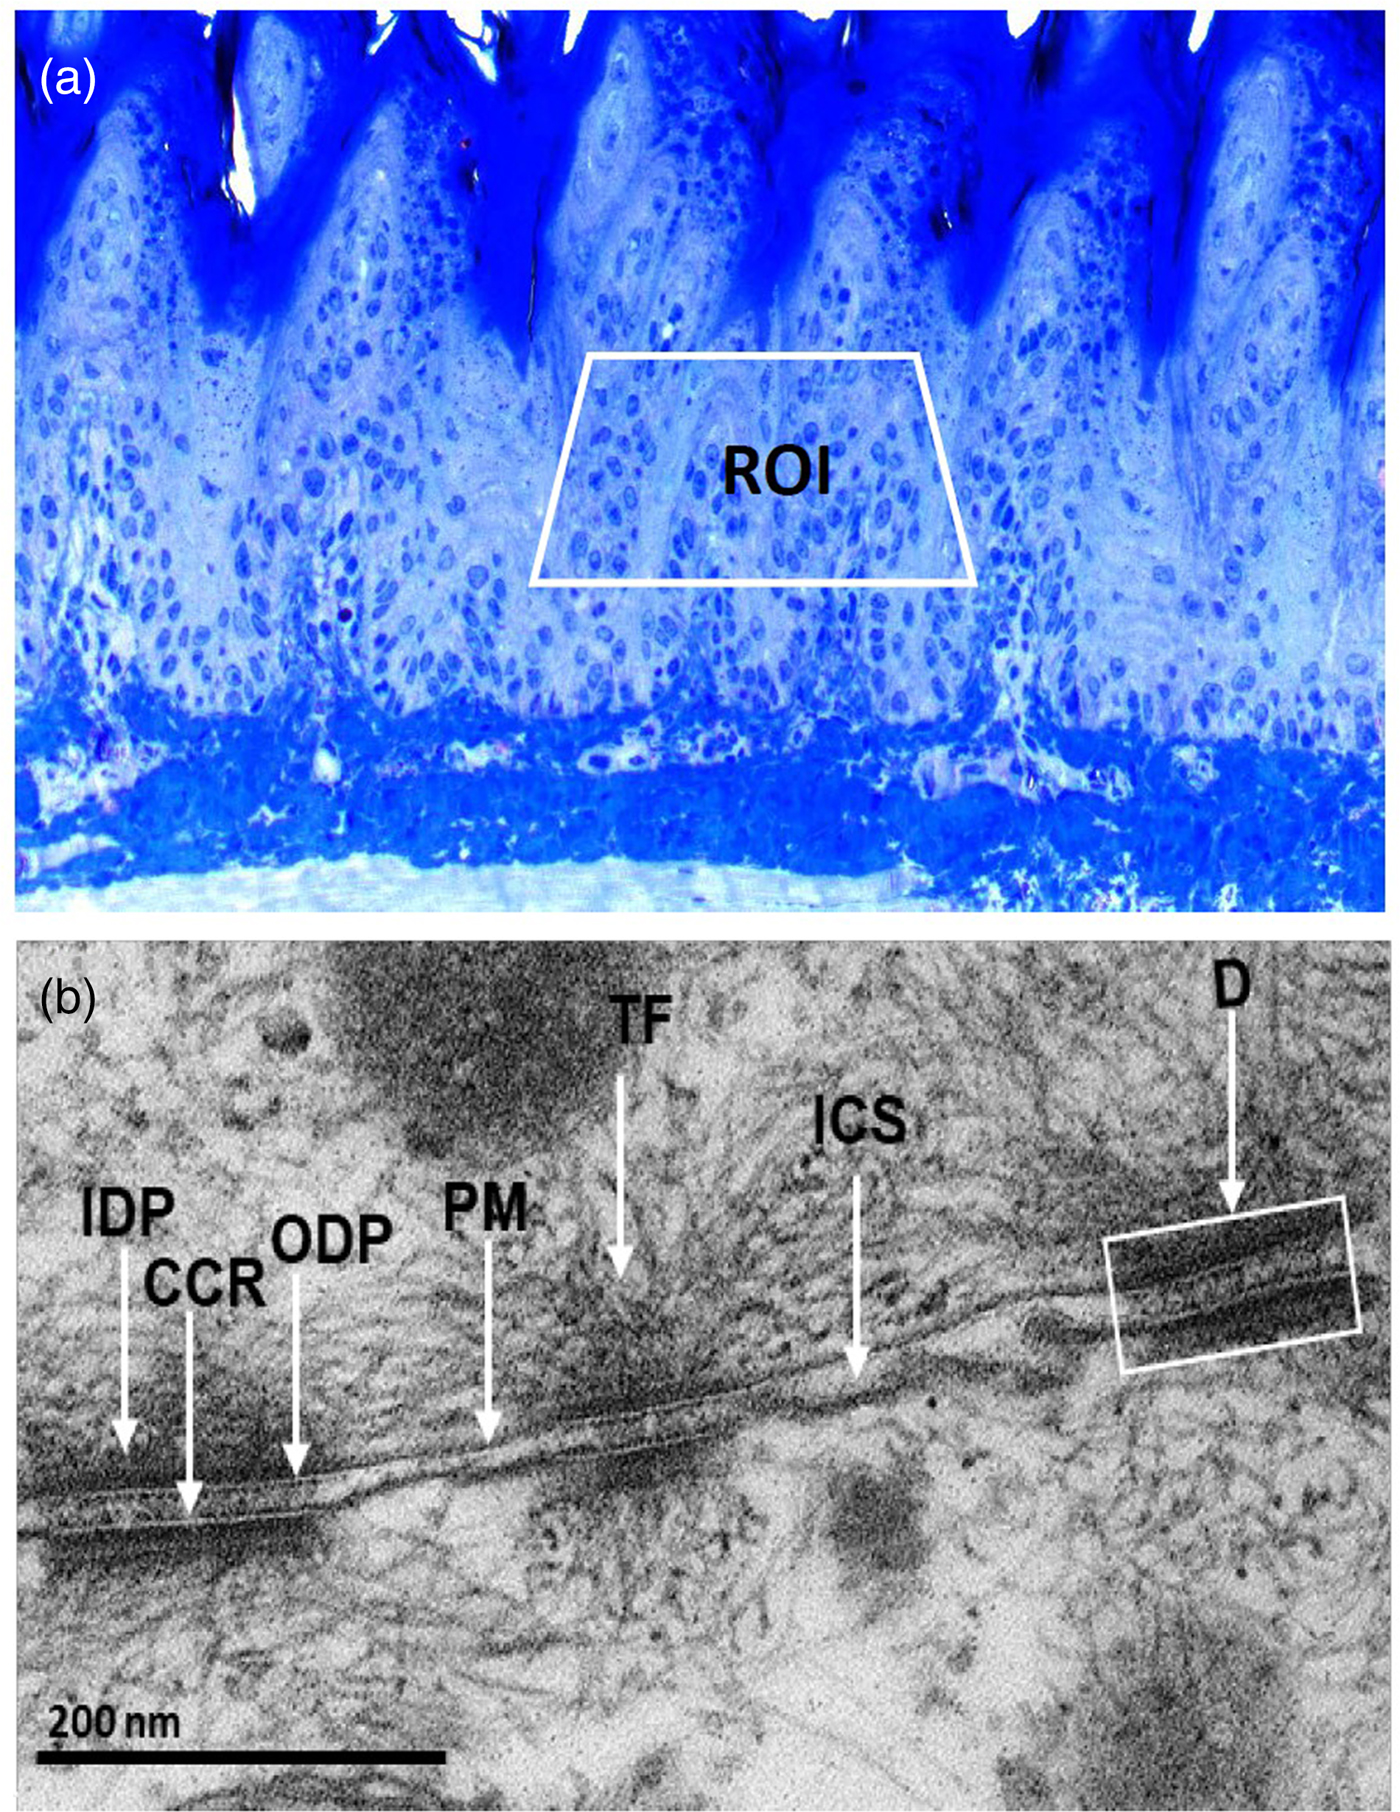
Fig. 2. a: Toluidine blue stained, semi-thin section showing the region of interest (ROI) in the spinous cells for ultrathin sectioning. b: Ultrastructural appearance of desmosomes (D) showing outer dense plaque (ODP) and inner dense plaque (IDP) separating with central core region (CCR), insertion of cytoplasmic tonofilaments (TF) and the intercellular space (ICS) between opposite plasma membranes (PM).
Ultrastructural Alterations in Desmosomal Adhesion Detected at Early Stage of rat Oral Carcinogenesis
Control
First, we analyzed the ultrastructure of control tissues. The epithelial cells of all strata were structurally well preserved with defined stratified layers. The upper stratum corneum was normal with occasional cells having pyknotic nuclei (Fig. 3a). The granular cells were seen with nuclei containing well-developed nucleoli, pleomorphic keratohyaline granules, and cytoplasmic tonofilament bundles. Intact desmosomes studded on the cell membranes and anchoring to their neighboring cell membranes were frequently seen (Fig. 3b). The desmosomes were found to be plentiful and had tonofilament insertions (Fig. 3b). A greater number of desmosomes with tight cell–cell adhesion were seen mostly in the upper spinous epithelium as compared to the granular epithelium (Fig. 3c). The basal lamina was found to be well defined, intact, and continuous, studded with numerous hemidesmosomes and underlined stroma appeared with normal morphology (Fig. 3d).
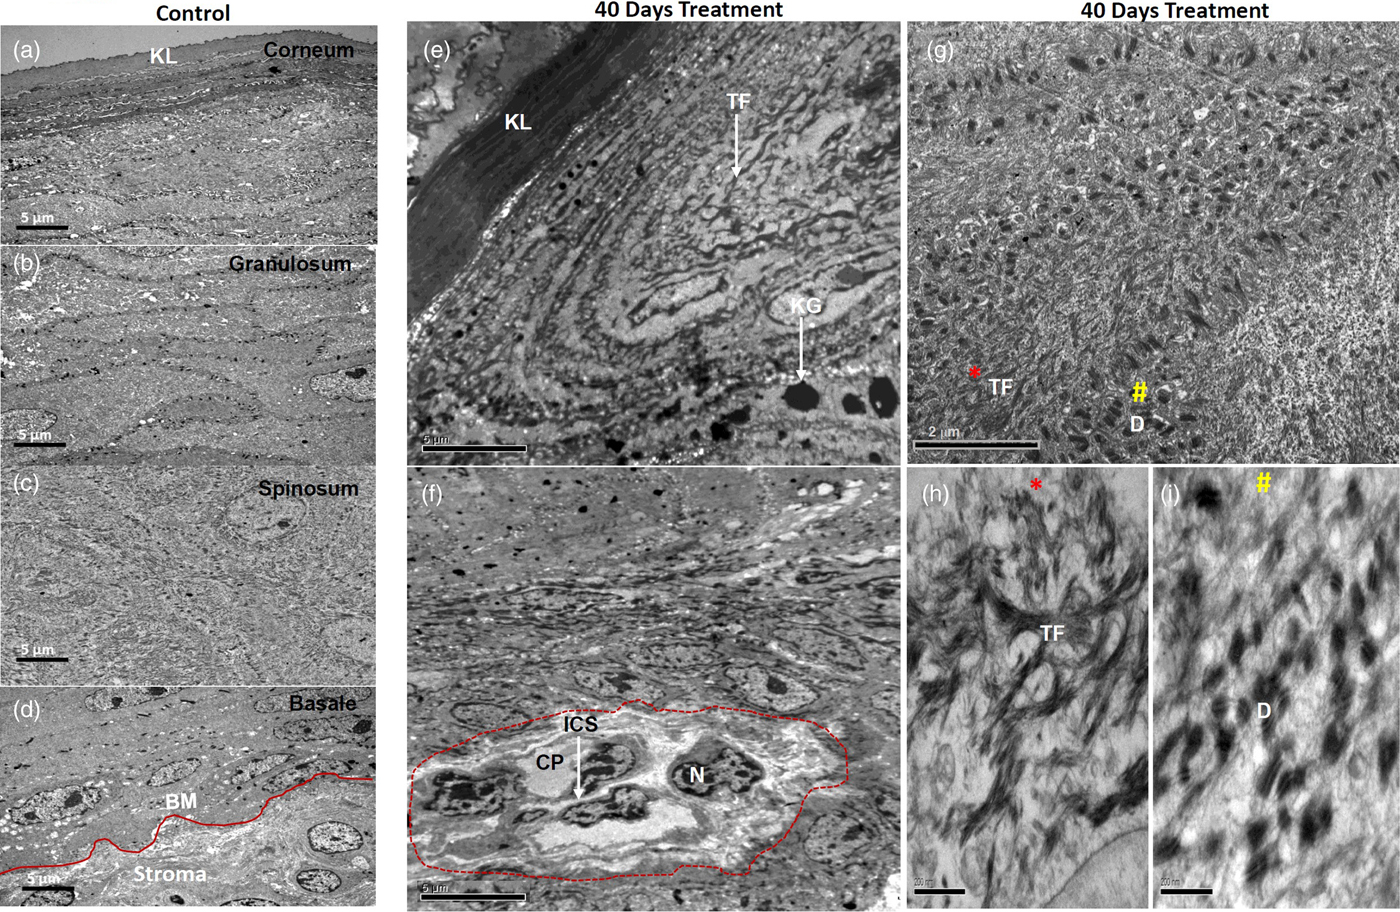
Fig. 3. Electron micrographs showing ultrastructure of control tissues (a–d) and 40 days 4NQO treated tissues (e–i). Micrographs of control tissues showing well-preserved ultrastructure of cellular organelles in all defined stratified layers as shown (a) stratum corneum, (b) stratum spinosum, (c) stratum granulosum and (d) well defined, intact stratum basale. e: Micrograph of 40 days 4NQO treatment showing a thick and dense upper corneal layer, while granular cells consist of thick TF bundles with pleomorphic and amorphous keratohyalin granules. f: Spinous cells of 40 days 4NQO treatment epithelium showing a group of cells (marked) with condensed chromatin, dilated cytoplasm, and loss of cell–cell adhesion with increased ICF. g: Micrograph showing bundles of TF (*) and clusters of desmosomes (#) in the cytoplasm of spinous cells of which magnified images are shown in (h and i) and are indicated as * and # respectively. KL, keratinized layer; BM, basement membrane; TF, tonofilaments; KG, keratohyalin granules; N, nucleus; ICS, intercellular space; CP, cytoplasm; D, desmosome.
Experimental
40 days: The most notable changes in the morphology of 40 days 4NQO treated tissues in comparison with control tissues are listed here. The upper fully keratinized corneal layer was found to be thick and dense. Granular cells were seen with increased keratohyalin granules and tonofilament bundles (Fig. 3e). Importantly, in the spinous epithelium, a group of cells with condensed nuclear chromatin, loss of cytoplasmic organelles and weak cell–cell contacts, owing to the increased ICS, were seen (Fig. 3f). In addition, the spinous cells were also exhibited with plenty of tonofilament bundles as well as desmosomes (Fig. 3g). Clusters of tonofilament bundles (Fig. 3h) and desmosomes (Fig. 3i) are shown in magnified images. Notably, desmosomes were found to be detached from cell membranes and clustered in the cytoplasm (Fig. 3i). Collectively, all these morphological alterations were apparent with hyperkeratosis and hyperplasia.
The most distinguished changes we observed were an altered number of desmosomes, ICS, and length of desmosomes. Hence, we quantitatively measured these parameters in 40 days 4NQO treated samples with hyperplasia tissues and compared with control tissues (Figs. 4a, 4b).
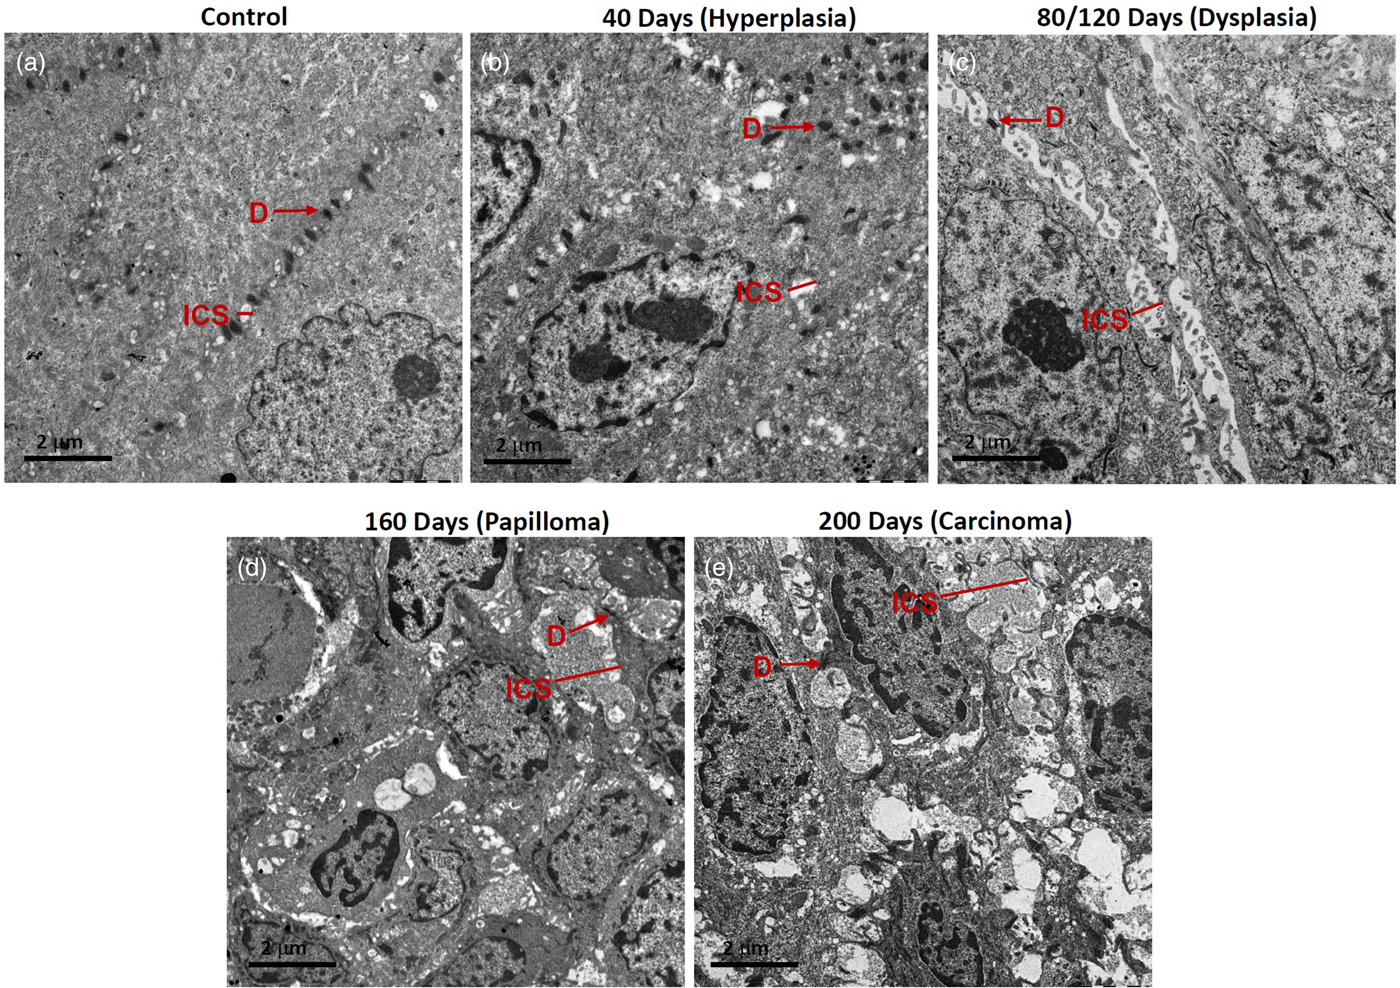
Fig. 4. Representative micrographs showing desmosomes (D) and intercellular spaces (ICS) in rat tongue tissues. a: Control, (b) hyperplasia, (c) dysplasia, (d) papilloma, and (e) carcinoma.
80/120 days: In these tissues, massive dysplastic changes were seen, mainly there was lack of ordered stratification. An altered nuclear-cytoplasmic ratio, increased chromatin condensation, and short desmosomes were seen. Fewer desmosomes and widened ICS, frequently containing microvilli, were seen especially in the spinous epithelium (Fig. 4c). Dense aggregates of tonofilaments were observed surrounding the nuclear periphery. The appearance of cells was more elongated and with loose cell–cell contacts (Fig. 4c).
160 days: These tissues exhibited papillomatous growth having severe dysplastic changes, largely distorted stratification, altered nuclear-cytoplasmic ratio, chromatin condensation, reduction in cytoplasmic organelles including tonofilament bundles. Importantly, in the spinous cells, there were a lower number of desmosomes and their appearance was shrunken. Cell–cell contacts were weak, resulting in the widened ICS, leading to poor cellular adhesion (Fig. 4d).
200 days: These tissues were developed tumors which were histopathologically identified as well-differentiated SCC. Tumor tissues exhibited severe dysplastic changes, distortion of stratification, chromatin condensation, shrinkage of cells with dilated cytoplasm, and with several short and long membranous protrusions (Fig. 4e). The tumor cells were found to be disorientated with randomly scattered tonofilaments, and shortened desmosomes were occasionally seen on cell membranes (Fig. 4e). There were large widened ICS, often containing microvilli (Fig. 4e).
Severity of Ultrastructural Alterations in Cell Adhesion Increased as the Disease Progressed
For comparative analysis, a quantitative measurement is required. Therefore, we quantified the number of desmosomes and measured ICS and the length of desmosomes in the tissues of control, hyperplasia, dysplasia, papilloma, and carcinoma and calculated the mean ±SEM as described in the protocol (Table 1). Further, we compared the mean values of a number of desmosomes (Fig. 5a), ICS (Fig. 5b), and length of desmosomes (Fig. 5c) in the control versus hyperplasia, dysplasia, papilloma, and carcinomas. In this comparative analysis, we found a significant difference in a number of desmosomes and ICS, however the length of desmosomes did not differ significantly (Figs. 5a–5c).
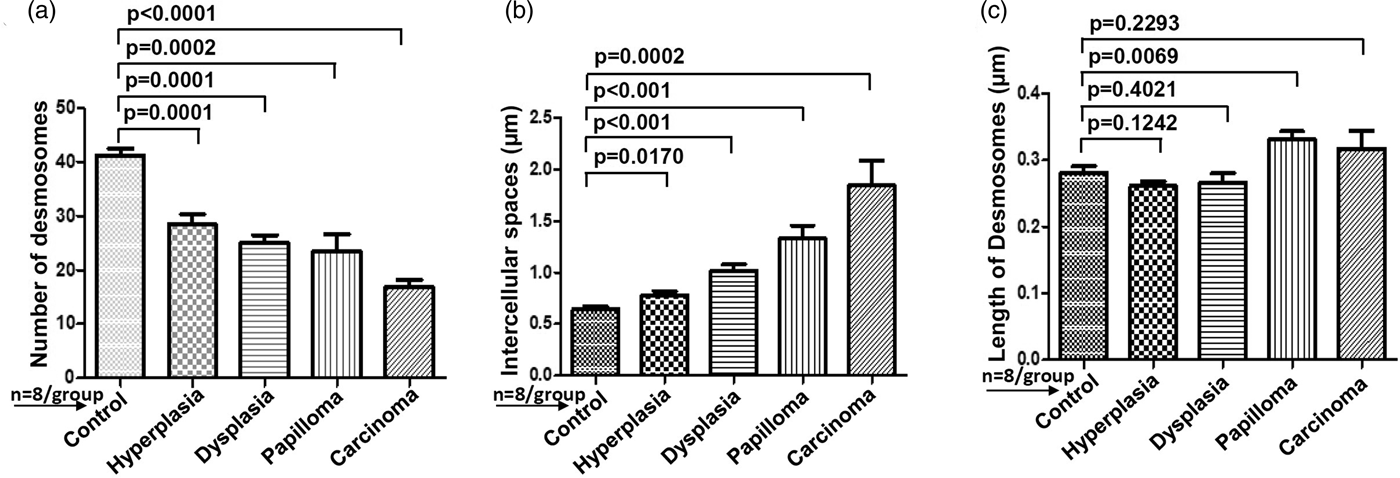
Fig. 5. Bar diagrams showing the comparative measurement and significant difference between mean values of (a) Number of desmosomes, (b) Intercellular spaces (ICS), and (c) length of desmosomes in 4NQO treated rat tongue tissues in comparison to control tissues. In each group n = 8.
Table 1. Average Mean Values of Number of Desmosomes, Intercellular Spaces and Length of Desmosomes Calculated Using iTEM Software and Compared Between Rat Tongue Tissues of Control versus Hyperplasia, Dysplasia, Papilloma and Carcinoma.
Data analyzed using unpaired t-test and represented Mean ± SEM. Bold values signify p-value <0.05.
Reduction in the Expression of Desmoplakin Protein and Loss of Desmosomes in the Corresponding Tissues Indicate That Desmoplakin is an Essential Component for Desmosome Formation
It is suggested that the alterations in protein expression result in structural changes. Hence, we analyzed the expression levels of major desmosomal protein-desmoplakin using the IGL technique. For comparative analysis, desmoplakin expression quantified as described in the protocol. Interestingly, we found an increased number of gold particles in the hyperplastic tissues as compared to control tissues (Figs. 6a, 6b, b’), while, in the subsequent grades of the tissues exhibiting dysplasia, papilloma, and carcinoma, the number of particles was reduced (Figs. 6c–6e). The negative staining control did not find gold labeling (Fig. 6a’) indicating the specificity of the antibody. Quantitative analysis exhibited a significant difference in IGL between 4NQO untreated (control) and treated tissues (Fig. 6f).
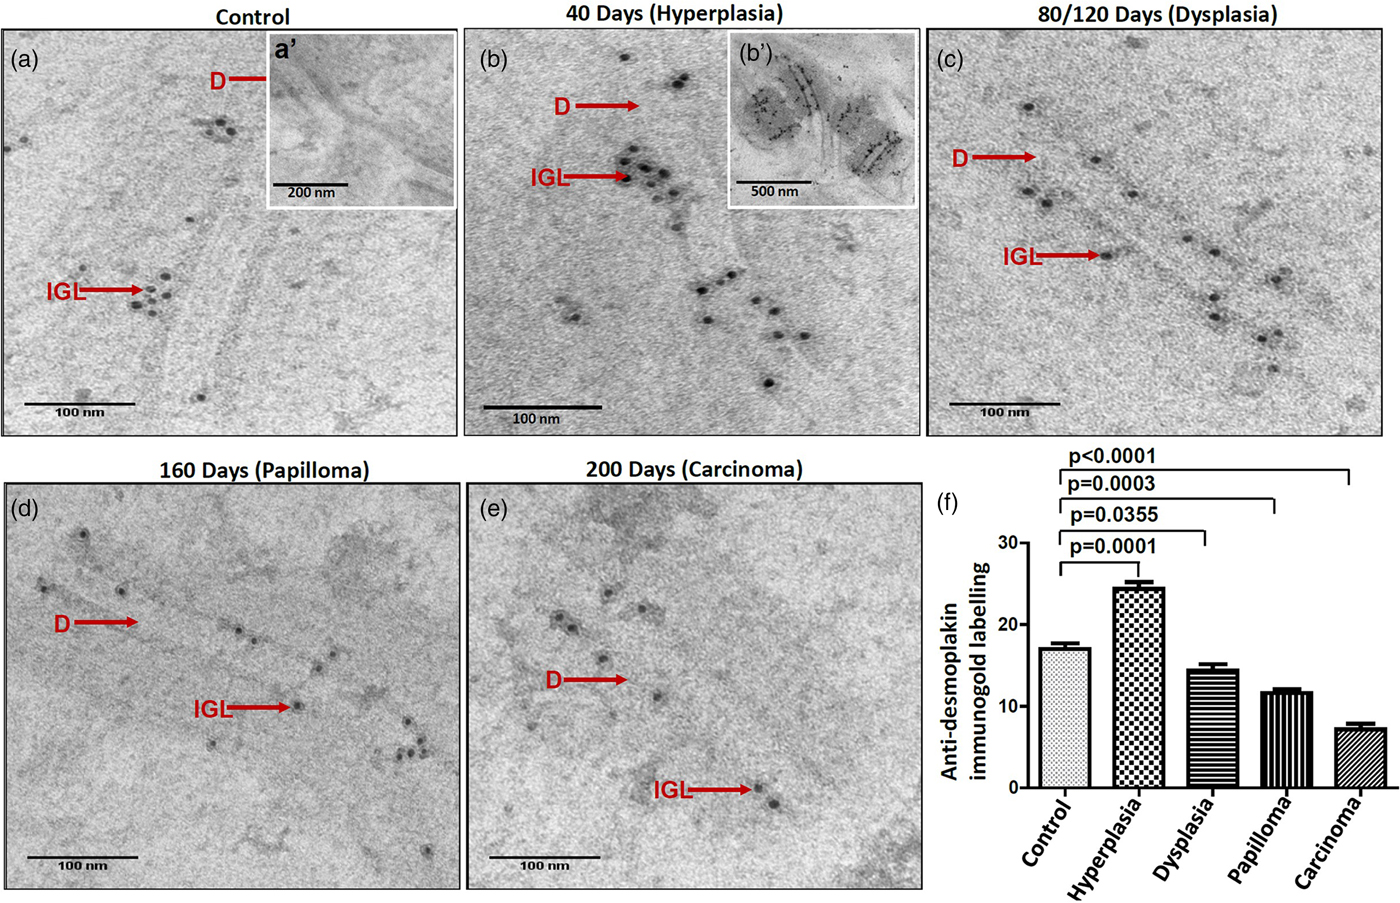
Fig. 6. Immunogold labeling using an antibody against desmoplakin protein shows the localization of gold particles on cytoplasmic side of desmosomes in (a) control tissue. (a′) shows the absence of gold labeling in negative control where primary antibody was replaced with preimmune serum. b: Hyperplastic tissue shows an increase in number of gold particles in the ICS. (b′) Low magnification representative image showing the increased expression of desmoplakin in hyperplastic tissue. Subsequent tissues of (c) dysplasia, (d) papilloma and (e) carcinoma show gold particles in the ICS with a gradual reduction in the number of particles as the disease progressed. f: Bar diagram shows the quantitative analysis of gold particles with a significant increase in hyperplasia and a significant decrease in dysplasia, papilloma, and carcinoma as compared to control tissues. D, desmosome; IGL, immunogold labeling.
Discussion
Disrupted epithelial adhesion is a hallmark of disease progression and if it remains undetected and untreated, there is a possibility of malignant transformation over a period of time. Histopathological diagnosis is still considered to be the gold standard in determining the presence and nature of a disease (Monea et al., Reference Monea, Pop, Grozescu, Stoica, Mocanu and Moldovan2018). However, in some cases, particularly in oral precursor lesions in which pathological changes have not yet fully developed and therefore are not visible under light microscope, EM can detect such subcellular changes owing to its high resolution.
Early diagnosis of oral potentially malignant legions as well as detection of invasive features in primary oral tumors is of paramount clinical importance, given the high mortality rate in late stages of the disease. IHC examination has the potential to be a useful tool for diagnosing malignancy and is currently being used for the diagnosis of breast lesions and bone tumor-like lesions (AbdulMajeed & Farah, Reference AbdulMajeed and Farah2013). In this direction, many attempts have been made to establish molecular markers for early diagnosis and prognosis of oral cancer (Shin et al., Reference Shin, Ro, Hong and Hittelman1994; Srinivasan & Jewell, Reference Srinivasan and Jewell2001; Shah et al., Reference Shah, Trivedi, Tankshali, Goswami, Shah, Jetly, Kobawala, Patel, Shukla and Shah2007; AbdulMajeed & Farah, Reference AbdulMajeed and Farah2013; Chen et al., Reference Chen, Huang, Cheng, Yang and Lin2013; Sawant et al., Reference Sawant, Vaidya, Chaukar, Alam, Dmello, Gangadaran, Kannan, Kane, Dange and Dey2014a, Reference Sawant, Vaidya, Chaukar, Gangadaran, Singh, Rajadhyax, Kannan, Kane, Pagare and Kannan2014b). However, none of those markers have reached clinics due to their inadequate sensitivity/specificity as well as lack of clinical validation on large sample size. Hence, in the present study, we have made an attempt to identify morphological markers using high-resolution electron microscopy, detecting the subcellular changes earlier than other light microscopy-based examinations.
In this study, histopathological analysis using light microscopy revealed that till 40 days of 4NQO treatment, there were no morphological alterations. However, electron microscopic examination demonstrated the changes apparent with hyperkeratosis and hyperplasia in the corresponding tissues. EM may be useful for the diagnosis of at least some of the cases, where the early morphological changes are not detectable using light microscopy. Earlier, EM protocol was considered to be expensive and time-consuming. The initial set-up for EM is expensive, but the continuing cost of using EM is reasonable. For example, in our Institute-Tata Memorial Centre, EM is being used for selected cases where the diagnosis is doubtful. Moreover, the current upgraded EM protocol, comprising of microwave-assisted tissue processing, in combination with digital image acquisition, made it possible to get the results on the same day (Rayat, Reference Rayat2014).
In this study, ultrastructurally we observed detachment of desmosomes from the cell membranes and their clustering in the cytoplasm of 40 days 4NQO treated epithelium. The mechanism of internalization of desmosomes is still largely unknown, however, a previous study has reported the internalization of desmosomes by detaching from cell membranes in epidermal tissues during wound healing (McHarg et al., Reference McHarg, Hopkins, Lim and Garrod2014). This indicates that loss of desmosomes from cell membranes renders the cell more motile. The same group has further reported the internalization of half-desmosomes in cultured cells in response to calcium chelation. Microtubules transport these internalized half desmosomes to the region of the centrosome by a kinesin-dependent mechanism where the degradation of desmosomes takes place by the combined action of lysosomes and proteasomes (McHarg et al., Reference McHarg, Hopkins, Lim and Garrod2014). These results suggest that internalization of desmosomes is a part of their routine recycling and degradation phenomenon. However, in the present study, internalization of desmosomes and further their clustering in the cytoplasm was seen. This observation point towards the possibility that the defect in desmosome recycling and degradation processes might result in their accumulation in the cytoplasm.
Generally in the stratified epithelium, cell adhesion is tight, as a result ICS are apparently narrow. Widened ICS allowing the detachment of a cell from its adjacent cell is prerequisite for tumor cell invasion and metastasis. Previous studies have reported widening of the ICS in dysplastic erosive leukoplakia lesions (Bánóczy et al., Reference Bánóczy, Juhász and Albrecht1980) and oral carcinoma, resulting in loss of intercellular adherens leading to disease progression (Shklar, Reference Shklar1985). Experimental rat oral carcinogenesis studies have also shown a prominent increase in ICS in long time carcinogen treated tissues as compared to short time carcinogen treatment (Kandarkar et al., Reference Kandarkar, Sawant and Reade1998). In this study, the quantitative analysis of ICS showed less distance between two adjacent cell membranes of control tissues. However, as the disease progressed the ICS gradually and significantly increased. These observations allow us to suggest a completely new concept that the alterations in the cell–cell adhesion initiate at an early stage of the disease, although these features are characteristic of advance disease. Furthermore, the severity of the alterations increased as the disease progressed. The usefulness of ICS quantitative measurement has been suggested in the diagnosis of patients with oesophageal non-erosive reflux disease where authors have reported the increased ICS values in diseased tissues as compared to control tissues (Ribolsi et al., Reference Ribolsi, Perrone, Caviglia, Gentile, Emerenziani, Guarino, Petitti and Cicala2009).
It is important to note that, unlike to previous descriptive studies, in this work we have performed quantitative analysis of ultrastructural features using software which reduces the subjectivity. A previous report suggested that the quantification of ultrastructural components and assessment of the percentage of subcellular changes could only be accomplished through an EM study (Rayat, Reference Rayat2014). Moreover, we have made an attempt to standardize the IGL protocol on glutaraldehyde and osmium tetroxide fixed tissues. Although, cryoelectron microscopy is an appropriate method for IGL, our modified protocol can be useful on TEM fixed tissues, for those who do not have access for cryoelectron microscopy. The findings of IGL showed an increased number of gold particles for desmoplakin protein in hyperplastic tissues as compared to control tissues, while, in the subsequent tissues of dysplasia, papilloma and carcinoma, the number was gradually but significantly reduced. We also detected cellular localization of gold particles in the ICS of 4NQO treated tissues, while, in the control tissues it was located towards the cytoplasmic side of desmosomes. This could be the result of the altered cellular localization of desmoplakin protein during the progression of oral cancer. Previously, using immunohistochemistry, we have reported altered cellular localization and increased expression of desmoplakin, plakoglobin and desmoglein proteins in human oral hyperplastic epithelium and as the disease progressed, the expression of these proteins was significantly reduced (Sawant et al., Reference Sawant, Dongre, Ahire, Sharma, Jamghare, Kansara, Rane, Kanojia, Patil and Chaukar2018). Another group has also reported the association between altered cellular expression/localization of desmosomal/hemidesmosomal proteins and aggressive clinicopathological features of OSCC (Xin et al., Reference Xin, Yamaguchi and Sakamoto2014).
In this study, we observed increased expression of desmoplakin protein in hyperplastic tissues, but, in the subsequent progressive grades, it was significantly reduced. This goes along with our previous observations (Sawant et al., Reference Sawant, Dongre, Ahire, Sharma, Jamghare, Kansara, Rane, Kanojia, Patil and Chaukar2018). However, the mechanism for this change is unknown. We hypothesize that, initially cells might try to defend against further damage and maintain cellular homeostasis. As a result, the cell might increase the expression of desmosomal components. But, as a consequence of subsequent events, there might be a loss of desmosomal components, which turn out to be a weak cellular adhesion, promoting the disease. Down-regulation of expression of desmoplakin and plakophilin-1 in human oral dysplastic and carcinoma tissues as compared to normal oral epithelium has been reported (Narayana et al., Reference Narayana, Gist, Smith, Tylka, Trogdon and Wahl2010). Down-regulation of desmoplakin and its association with the invasive and metastatic ability of human oropharyngeal cancers has also been shown (Papagerakis et al., Reference Papagerakis, Shabana, Pollock, Papagerakis, Depondt and Berdal2009). The ultrastructural changes seen in this study at different histopathological grades of rat tongue carcinogenesis match the changes seen in human oral tumorigenesis (Sawant et al., Reference Sawant, Dongre, Ahire, Sharma, Jamghare, Kansara, Rane, Kanojia, Patil and Chaukar2018). These observations clearly illustrate the fact that experimental animal models can be useful to increase human knowledge and contribute to finding answers to various biological and biomedical questions.
It is important to note that we found increase/decrease in desmoplakin protein and increase/decrease in the number of desmosomes respectively in corresponding tissues. There are reports showing the association between the expression of desmosomal plaque proteins and formation of desmosome structures (Gosavi et al., Reference Gosavi, Kundu, Khapare, Sehgal, Karkhanis and Dalal2011). We have also previously reported the requirement of desmoplakin protein for the formation of desmosomes as desmoplakin knocked down human dermal cells failed to form normal desmosomes (Sawant et al., Reference Sawant, Dongre, Ahire, Sharma, Jamghare, Kansara, Rane, Kanojia, Patil and Chaukar2018). Down-regulation of the expression of desmosomal proteins during cancer progression has been implicated in the acquisition of the metastatic phenotype (Dusek & Attardi, Reference Dusek and Attardi2011; Sawant et al., Reference Sawant, Dongre, Ahire, Sharma, Jamghare, Kansara, Rane, Kanojia, Patil and Chaukar2018). Loss of desmosomes has been shown before that of adherens junctions to drive tumor development and early invasion (Dusek & Attardi, Reference Dusek and Attardi2011). These findings raise the possibility that desmosomes play tumor suppressive roles during cancer progression as the loss of adhesion promotes the disease (KowalczykK & Green, Reference Kowalczyk and Green2013).
Summary
Electron microscopic observations showed subcellular changes, apparent with hyperkeratosis/hyperplasia in the initial stage of the altered epithelium. These changes remained undetected at light microscopic level due to its limited resolution. This recommends the role of electron microscopy in early detection of altered epithelium which could add value to the precision of current histopathological diagnosis. In addition, ultrastructural features such as a number of desmosomes and ICS could prove to be morphological markers for the prediction of disease progression. Together, the results of this study highlight the importance of electron microscopy in the early detection of subcellular changes in the altered epithelium.
Acknowledgments
The authors gratefully acknowledge the Laboratory Animal Facility and Electron Microscopy Facility from Advanced Centre for Treatment, Research and Education in Cancer, Tata Memorial Centre, Kharghar, Navi Mumbai, 410 210, India.


