


Introduction
The artificial lake of Giverny represents one of the most frequent subjects of the entire production signed by Monet. The Pink Water Lilies, dated between 1897 and 1899, is one of the many water lilies paintings created by the artist. It is presently being housed at the National Gallery of Modern and Contemporary Art (GNAM) in Rome. In 1962, the GNAM bought it from the Marlborough Gallery of London, which in turn purchased the painting from the Katia Granoff Gallery of Paris.
“Water Lilies” is not a name of a single painting but of a series of works. Indeed, during his lifetime, Monet comes back to this subject matter several times, and painted more than 250 “Water Lilies” paintings. Twenty-five canvases belonging to the first sequence of “Water Lilies,” was exhibited at the Galerie Durand-Ruel in 1900. This was followed by a second series of 48 canvases in 1909. In 1914, Monet comes back to his water lily paintings under the commission of the Prime Minister Clemenceau. Monet's approach changed both in the notably reduced scale of the canvases and the choice of his palette. The “Water Lilies” series in the Orangerie in Paris was the last series that Monet worked on before he died.
The Pink Water Lilies painting, together with eight other paintings created by Monet, represents the preliminary studies for the Décorations de Nymphéas, on which the artist worked from 1897 on, belonging to the first Water Lilies series.
So far as we know, just two other “Water Lilies” paintings have been subjected to an extensive investigation: the Water Lilies (cat. 44) dated 1906 and stored at the Art Institute of Chicago (AIC; Muir, Reference Muir, Groom and Shaw2014a; Muir et al., Reference Muir, Fiedler, Johnson and Erdmann2014) and the Water Lilies dated 1914–1916 and housed in the National Gallery in London (Roy, Reference Roy2007). The AIC has a collection of 33 paintings by Claude Monet, including the two Water Lilies. All 33 paintings have been investigated by X-radiography, infrared reflectography (IRR), ultraviolet light (UV), transmitted-light imaging, transmitted-infrared (IR) imaging, and photomicrography. Samples have been analyzed by X-ray fluorescence spectroscopy (EDXRF), UV fluorescence and polarized light microscopy (PLM), scanning electron microscopy, and energy-dispersive X-ray spectroscopy (SEM-EDS) (Muir, Reference Muir, Groom and Shaw2014a, Reference Muir, Gloria and Shaw2014b, Reference Muir, Gloria and Shaw2014c, Reference Muir, Gloria and Shaw2014d; Muir et al., Reference Muir, Fiedler, Johnson and Erdmann2014). Occasionally, Raman and surface-enhanced Raman spectroscopies (SERS) techniques have also been used. In addition, the London Water Lilies (1916) painting has been analyzed several times over time, employing GC-MS analyzes to identify the binder and SEM-EDS on cross-sections to characterize the pigments (Roy, Reference Roy2007).
Moreover, other paintings by Monet, containing different subjects, have been investigated, such as Argenteuil Basin with a Single Sailboat and Port-Goulphar, Belle-Ile (1874). The National Gallery of Ireland was engaged in a complex conservation project on Argenteuil Basin with a Single Sailboat which was badly damaged following vandalism in 2007. During the restoration, some samples from the painting and the canvas materials were analyzed, with EDXRF and SEM-EDS, to identify the chemical-staining dye of the binding medium. Finally, the Port-Goulphar, Belle-Ile (1887) oil painting, stored at the Art Gallery of New South Wales has been examined using SEM-EDS and X-ray fluorescence mapping (XRF) analysis of paint cross-sections to determine the complex construction of the painting (Dredge et al., Reference Dredge, Wuhrer and Phillips2003).
In this work, the Pink Water Lilies painting was analyzed applying an analytical protocol based on the complementary use of different noninvasive techniques (EDXRF and spectrophotometry) and micro-sampled for Fourier Transform Infrared spectroscopy (FTIR) and SEM-EDS, these samples were recovered after packing operations for an exhibition and impossible to replace. Ground, color layers and varnish of one sample were analyzed with FTIR spectroscopy and the cross-sections were investigated using UV fluorescence and polarized light microscopy and SEM-EDS. Furthermore, a plausible original position of the two fragments was determined by comparing the EDXRF data and the atomic percentages calculated with SEM-EDS on different areas of the two cross-sections. Particularly, the ratios between the widespread and achromatic zinc oxide with the chromatic elements (chromium and mercury) were considered and are most likely representative for the two cross-sections. The rare opportunity to carry out an investigation on the third “Water Lilies” painting of over 250 existing works gave us important information about the materials used by Monet in the first part of his career.
Materials and Methods
Noninvasive Analyses
X-Ray Fluorescence Analyses (EDXRF)
EDXRF analyses were performed with an Amptek MCA8000A system, with an X-ray generator tube mod. 36 kV XRG35, operating at 0.15 mA. The fluorescence was collected by a Si-PIN type X-ray detector manufactured by Amptek, filtered with a 1-mm thick aluminum disc. The signal was routed to an Amptek multichannel analyser. The EDXRF spectrum was recorded (measurement time 120 s) and processed with the dedicated Amptek PMCA acquisition software.
The instrument was calibrated using the elements in a brass alloy and a lead bar, in order to assign the correct energy (in keV), to each channel.
VIS Reflectance Spectrophotometry (RS)
Reflectance spectra were acquired with a Konica-Minolta CM-700d. The experimental conditions were the following: spectral range 400–700 nm; lighting geometry and observation d/8; lighting source D65; observation angle 8°; the UV radiation contribution was not considered, acquisition mode SCI and spot diameter 3 mm. Each spectrophotometric measurement was the average of three acquisitions. As the instrumental wavelength pitch was 10 nm, the estimated error was ±5 nm per measurement.
Pigments were identified both by comparing experimental spectrophotometric curves with those of standard pigments in oil (Cosentino, Reference Cosentino2014) and processing RS curves differently based on their colors. For the blue and the green hues, the maximum (λ MAX) of the reflectance spectrophotometric curve was calculated by applying the first derivative; for the red and pink hues as well as for red standard pigments, the second derivative was calculated, in the range between 550 and 650 nm, using the differentiate application of the Origin software. In this range, the intersection values with the y = 0 axis, corresponding to the inflection points, were taken into account.
Micro-Destructive Investigations
Two micro-samples were prepared for the cross-sectional analysis carried out by optical microscopy (OM) and SEM-EDS. Additionally, a small part of the sample referred to as n.M1 was employed for micro-FTIR analyses.
Fourier Transform Infrared Spectroscopy (FTIR)
FTIR spectroscopy analyses were performed using a Thermo Scientific Nicolet iN10 FT IR microscope instrument in transmission mode. A small fragment of the sample of n.M1 was mechanically separated and placed directly on a diamond cell. The sample was flattened on the diamond cell using a roller blade knife tool. The spectra were acquired in the 4,000–650 cm−1 spectral range using a liquid nitrogen-cooled MCT detector.
Sample Preparation
The n.M1 and n.M2 samples were embedded in a mounting polyester bicomponent resin (Mecaprex 2S by Presi) to obtain the relative cross-sections which, after cutting and polishing (with silicon carbide abrasive papers from 200 to 4,000 grit), were observed under an optical microscope and analyzed by SEM-EDS.
Optical Microscopy (OM) in Visible (VIS) and Ultraviolet (UV) Radiation
The samples were first observed with a Leica M125 zoom stereo microscope (magnification ratio 12.5:1), equipped with a Leica MC190 HD digital camera.
The cross-sections were observed with a Leitz DM RXP microscope (50×, 100×, and 200×) equipped with a Leica DFC 420C digital camera in VIS and UV fluorescence. A type A filter (BP 340–380 nm excitation filter, 400 nm dichromatic foil, LP425 barrier filter) and an H3 filter (BP 420–490 nm excitation filter, dichromatic foil 510 nm, barrier filter LP51) were used for the observations in UV fluorescence (50W HBO HG vapor lamp). Digital photos were recorded with the Leica Image 1000 software.
Scanning Electron Microscopy Analyses (SEM-EDS)
The cross-sections were analyzed by SEM-EDS in a Zeiss EVO 60 equipped with a lanthanum hexaboride filament operating at 20 keV. SEM images were collected in the backscattered electron (BSE) mode. EDS for elemental analysis was available with an X-Max 50 mm2 detector and AZtec analysis software provided by Oxford Instruments. The detector was a silicon drift type, with a resolution of 127 eV FWHM and a detection limit of about 0.1 wt% percentage from 0.3 to 3 μm in depth. The software module uses a standardless ZAF quantification system. EDS elemental analysis was performed in a low pressure mode (100 Pa), without a conductive coating. The spot analyses were expressed both as atomic and weight percentages: the contribution of carbon and oxygen was excluded to obtain stoichiometric ratios and to assist in pigments’ identification, as it was affected by the contribution of the embedding polyester resin.
Results and Discussion
Noninvasive Analyses
X-Ray Fluorescence and VIS Reflectance Spectroscopy Analyses
Most analysis locations chosen for EDXRF were also analyzed by VIS reflectance spectroscopy (Fig. 1 and Table 1). In all points, the evidence of numerous chemical elements suggests that more pigments were mixed together to obtain particular hues typical of Impressionism. In Monet's series paintings of the 1890s, the overall effects of light and atmosphere became one of his principal concerns. John House describes the “ever-changing envelope of colored air” that accompanied his pictures, subordinating while invigorating the physical objects depicted (House, Reference House1986). It is known that Monet started using oil paintings in 1856 for mastering an outside painting technique, although, he finished many of them in his studio.
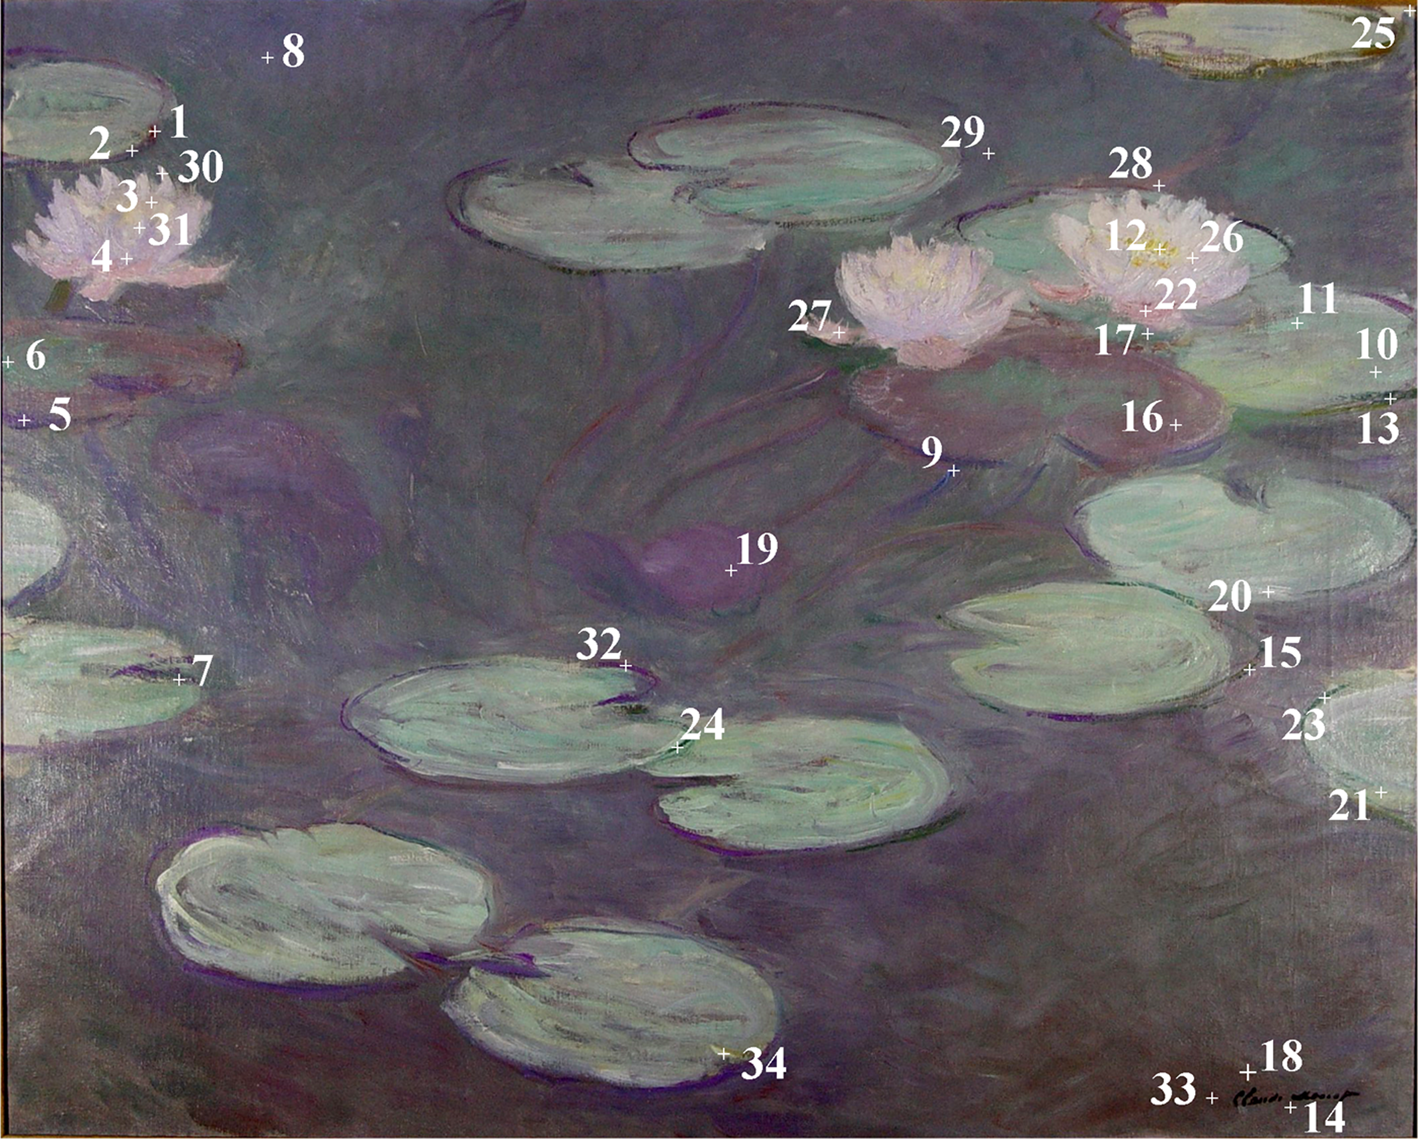
Fig. 1. EDXRF and VIS reflectance spectrophotometry areas of analyses on Pink Water Lilies painting (81.5 × 100 cm).
Table 1. EDXRF Net Counts.

Bold in the first column is reported the points of analyses performed on the same areas of the VIS reflectance spectrophotometry analyses. The points of analyses are shown in Figure 1.
Chemical elements detected by EDXRF (Table 1), such as the consistent presence of zinc and cobalt in all points, led to speculation on the pigments used by Monet. Certainly, zinc was related to zinc oxide, indicating that the colors are always mixed with this white pigment which had already been used in an oil medium by Leclaire in 1840, and, since 1850, had been produced on an industrial scale in Europe and the United States (Downs, Reference Downs1976; Picollo et al., Reference Picollo, Bacci, Magrini, Radicati, Trumpy, Tsukada, Kunzelman, Greenberg and Tobi2007). However, the presence of cobalt could be associated with more than one pigment. The EDXRF data were compared with the spectrophotometric data from the same points. Identifying pigments by EDXRF proved however complex, as it provides data not only from the surface layer but also from the layers below. On the other hand, the data from the reflectance spectra accounted just for pigments on the surface.
Ground layer
Along the edges and at the upper right of the Pink Water Lilies painting, Monet left the white ground uncovered in places, where the brush strokes appear very loose and open, as was already pointed out in the Irises painting (Roy, Reference Roy2007). In an unfinished area of the canvas (n. 25 in Table 1), the EDXRF analyses of the ground report a high number of counts for lead and fewer for zinc. It is possible to assume that lead white, 2PbCO3 ⋅Pb(OH)2, was employed for the ground. The presence of zinc, related to the zinc white pigment, ZnO, could be explained as a residue of the overlying pictorial material, rich in zinc white.
Paint layers
White areas
On the white areas, the EDXRF analyses (points n. 3, 20, 26, and 30 in Table 1) detected significant counts of zinc, associated with the zinc white, except for the white of the ground (point n. 25 in Table 1) where the Pb counts are higher (see the “Ground layer” section). The reflectance spectra of achromatic colors—color without any hue, like white, black, and shades of gray—have few characteristic bands or peaks in the visible range considered useful for their identification (Cosentino, Reference Cosentino2014) and they cannot be used for discriminating among those shades.
Blue areas
EDXRF detects the presence of cobalt, most likely related to the use of cobalt blue CoAl2O4, a pigment discovered in 1882 (Eastaugh et al., Reference Eastaugh, Walsh, Chaplin and Siddall2008). The blue area (n. 9 in Fig. 1) appears spread all over a purple layer. Indeed, cobalt could be ascribed to cobalt violet a cobalt arsenate Co3(AsO4)2 discovered in 1880, or to cobalt phosphate Co3(PO4)2, a darker variety, or to cobalt blue. Conversely, the presence of ultramarine blue cannot be ascertained with the EDXRF technique. The reflectance spectrum reveals the presence of a wide band in the blue-violet range spectrum (400–500 nm), showing the same trend of cobalt blue standard (Fig. 2). This band discriminates cobalt blue from ultramarine blue, where the band decreases from 450 to 480 nm. In this spectrum, a band goes to 550 nm, as a characteristic of cobalt violet according to Cosentino (Reference Cosentino2014). Finally, in the range from 600 to 700 nm, the curve suggests the presence of other pigments, orange-red hued: indeed, the EDXRF data from this point indicates the presence of mercury and arsenic, suggesting the occurrence respectively of vermilion and cobalt arsenate pigments.
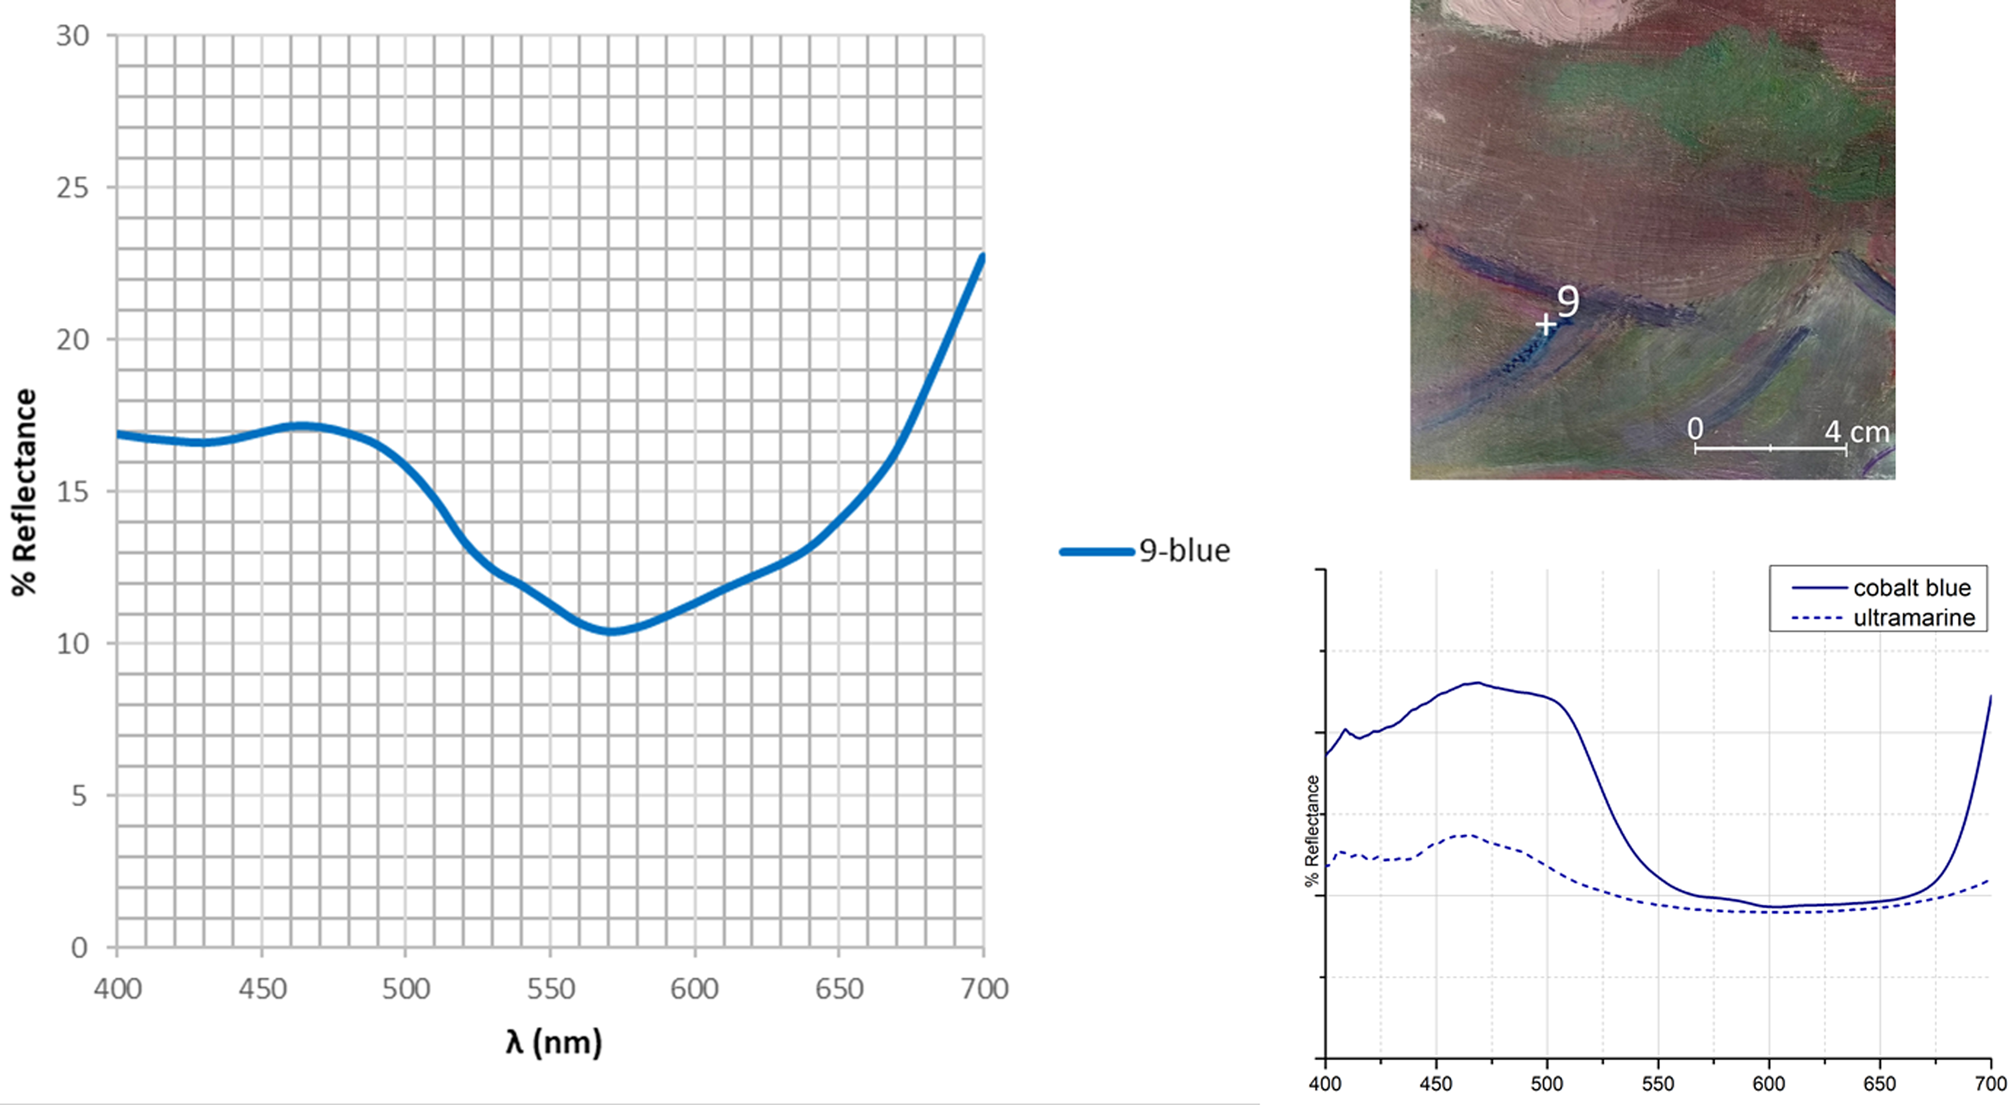
Fig. 2. The reflectance spectrum and the relative blue area investigated (n. 9 in Fig. 1). At the bottom right, the reflectance spectra of cobalt blue and ultramarine blue pigments considered as Ref. (Cosentino, Reference Cosentino2014).
Green and yellow areas
EDXRF analyses of the green areas show the ubiquitous presence of chromium, which may be associated with chromium oxide green Cr2O3 and hydrated chromium oxide green Cr2O3⋅2H2O pigments, which appear respectively opaque green and bright and transparent green. This hypothesis was confirmed by the spectral analysis (Fig. 3). By comparing the maximum values calculated in the 450–650 nm range with those obtained by the reference pigments in oil (Cosentino, Reference Cosentino2014), it was possible to identify hydrated chromium oxide green, known also as viridian, since the maximum value falls at 510 nm (n. 6, 11, 13, and 21). Only in the n. 13 spectrum, an additional maximum at 540 nm was observed, indicative of the anhydrous form.

Fig. 3. The reflectance spectra of green areas and relative photos of the areas investigated. In the table, the maxima values calculated for the spectrophotometric curves of green areas and standard pigments are reported (Cosentino, Reference Cosentino2014).
The spectrophotometric curve of the area n. 10 (Fig. 3) shows, together with the band at 540 nm, a band at 500 nm which it could be ascribed to the cadmium green pigment. Since cadmium appears to be absent in the EDXRF spectra, it might also be from a contributed effect of cobalt blue.
Indeed, it should take into account that the combined use of these techniques may present some problems in the identification of the pigments: it could be the case in point n. 15, with the reflectance spectrum at a maximum value of 520 nm, not matching the values of the reference pigments. The presence of multiple chemical elements in EDXRF data suggests a compositional complexity of the pictorial material which complicates the analytical identification of pigments.
In conclusion, as greens, it can assume the presence of the two chromium pigments. The use of emerald green, a copper acetoarsenite, Cu(C2H3O2)2⋅3Cu(AsO2)2 invented in 1814, attested in early Monet's works, can be excluded since copper was never found in the EDXRF analyses. Indeed, the emerald green disappeared from his palette owing to its tendency to react when used together with cadmium yellow or chrome yellow pigments (Roy, Reference Roy2007).
EDXRF performed on the saturated yellow of the upper right water lily (n. 12 in Table 1) revealed the presence of cadmium, related to cadmium yellow pigment, CdS. As to point n. 34 (Table 1), a greenish hue was accomplished with Cr and Co pigments, together with the cadmium yellow.
Red areas
The EDXRF analyses of the red area (n. 1 in Table 1) indicate the presence of mercury, related to vermilion, HgS: vermilion is among the few traditional pigments used by the artist. The attribution can be confirmed by the spectral analysis relative to the n. 1, with the same trend of the standard vermilion one (Fig. 4). Another confirmation can be obtained by calculating the inflection point in second derivatives from 550 to 650 nm: indeed, this spectral range could be used for distinguishing different red pigments. For example, the inflection points calculated for red lead and red cadmium (table in Fig. 4) fall respectively at 585 and 610 nm. Conversely, the inflection point for the area n. 1 falls at 600 nm like for the vermilion (Cosentino, Reference Cosentino2014). The presence of vermilion is ascertained, but in this case, it is not possible to decide if it is the only red pigment used by the artist.

Fig. 4. The reflectance spectrum of the red area and relative photo of the area investigated. In the table, the inflection points calculated in the second derivative (in the range between 550 and 650 nm) for the spectrophotometric curves of the red area and the standard pigments are reported (Cosentino, Reference Cosentino2014).
Pink and violet areas
In most of the pink (n. 22, 27, 28, and 29) and violet (n. 2, 5, 7, 8, 16, 19, and 32) areas, Zn and Co elements were detected, suggesting a mixture of cobalt violet and zinc white pigments. As observed in the AIC study, the first appearance of cobalt violet, as a dark variety that is cobalt arsenate, dates back to 1897 and was used regularly thereafter, while prior to 1897, purple tones were typically achieved through mixtures containing blue and red pigments (Muir et al., Reference Muir, Fiedler, Johnson and Erdmann2014).
Cobalt violet pigment can be also identified by the two characteristic bands in the reflectance spectrum, centered at 460 and 550 nm (spectra n. 2, 5, and 7 in Fig. 5; Corbeil et al., Reference Corbeil, Charland and Moffatt2002). Moreover, in the reflectance spectrum of area n. 2, a greater intensity of a band at approximately 500 nm was observed, that may be ascribed to cobalt blue, suggesting the use of a mixture of the two cobalt pigments.

Fig. 5. The reflectance spectra of the violet areas investigated. On the right, the images of the violet areas investigated.
In the n. 4 and n. 22 pink areas, the simultaneous presence of several pigments such as the cobalt blue (band at 500 nm), the cobalt violet (band at 550 nm), and the vermilion (inflection point at 600 nm) was in evidence (Fig. 5). This latter pigment is confirmed by EDXRF analyses in the spots n. 8, 16, 19, 22, 28, 29, and 32, showing the consistent presence of mercury (Table 1).
Many EDXRF points, regardless of the observed color, such as violet (n. 5, 7, 8, 16, 19, 32, and 33), blue (n. 9), green (n. 10, 13, 15, 17, 21, 23, and 24), pink (n. 22, 27, 28, and 29), and black (n. 14 and 18) areas, show the consistent presence of arsenic often linked to cobalt likely due to the arsenate cobalt pigment which was used in the foreground (Roy, Reference Roy2007). Generally, the simultaneous presence of lead, mercury, and arsenic elements does not enable unique identification and quantification by EDXRF of any pigments, as Kα and Kβ lines overlap, respectively, on the lead Lα line and on the mercury Lβ line. In the absence of mercury, the counts for arsenic were calculated on Kβ and for lead on Lβ to avoid potential interference. In the presence of mercury, arsenic may be hypothesized on a case-by-case basis, considering the related intensities of the peaks as a function of the concentration of mercury, lead, and arsenic. It can be observed that normally the lead Lα and Lβ lines have a similar intensity; in some points of pink or purplish-pink tones, however, the Lα line is more intense than the Lβ line (see the n. 22, 27, 28, and 29 in Table 1). Hence, the presence of arsenic could be inferred (Supplementary Fig. S1).
Black areas
Pure black is rarely used by the impressionist painters, although Monet signed this painting with a black pigment. On the black points of Monet's signature (points n. 14, letter M; n. 18, letter C), the EDXRF data (Table 1) show no significant differences from the underlying background color (n. 33). The relative reflectance spectrum (n. 14) reveals a very low reflectance with two weak bands centered at 500 and 600 nm, probably due to an underlying layer of color. Therefore it is plausible that an organic carbon-based pigment of animal or vegetable origin was used. Bone black was confirmed on some works analyzed by AIC from the earlier works, but this pigment does not show characteristic bands along the visible spectrum of light (Muir et al., Reference Muir, Fiedler, Johnson and Erdmann2014).
Micro-Destructive Analysis
Micro-FTIR Spectroscopy
FTIR spectroscopy analyses were carried out mainly to obtain information about the organic components in the ground layer, the binder of the color layer, and the varnish. In addition, some pigments were recognized. The early observations of the fragment show an inhomogeneous and wavy upper layer, which is mainly purple in color, but is also characterized by the red, blue, green, and yellow pigments of various sizes. This layer appears covered with a thick layer of a transparent varnish. The back of the sample shows the ground layer, of variable thickness, mostly whitish in the clearly visible the imprint of the canvas (Fig. 6d).

Fig. 6. (a) The probable area of origin of the sample; (b) OM image in VIS reflected light (recto) and (c) its magnification; and (d) OM image in VIS reflected light (verso).
The FTIR spectrum of the priming ground layer (Fig. 7) shows the typical vibrations of proteins (amide I band at 1,650 cm−1, mainly due to the C=O stretching and amide II at 1,544 cm−1, due to CNH deformation and OCN stretching) (Gruchow et al., Reference Gruchow, Machill, Thiele, Herm and Salzer2009). The protein signals may be attributed to collagen, a main component of an animal glue. Together with these signals, the bands at 1,435, 875, and 715 cm−1, due to the  ${{\rm C}{\rm O}_3}^{2-}$ group, could be ascribed to calcite, CaCO3 (Derrick et al., Reference Derrick, Stulik and Landry1999). Bands attributed to carbonate also show a peak at 1,405 cm−1 due to the ${{\rm C}{\rm O}_3}^{2-}$ antisymmetric stretching vibration of the basic lead carbonate, 2PbCO3⋅Pb(OH)2, also confirmed by the rocking deformations of the ${{\rm C}{\rm O}_3}^{2-}$ at 685 cm−1 (Garrappa et al., Reference Garrappa, Kočí, Švarcová, Bezdička and Hradil2020). The weak shoulder at 1,740 cm−1 could be assigned to the C=O asymmetric stretch of a lipidic binder.
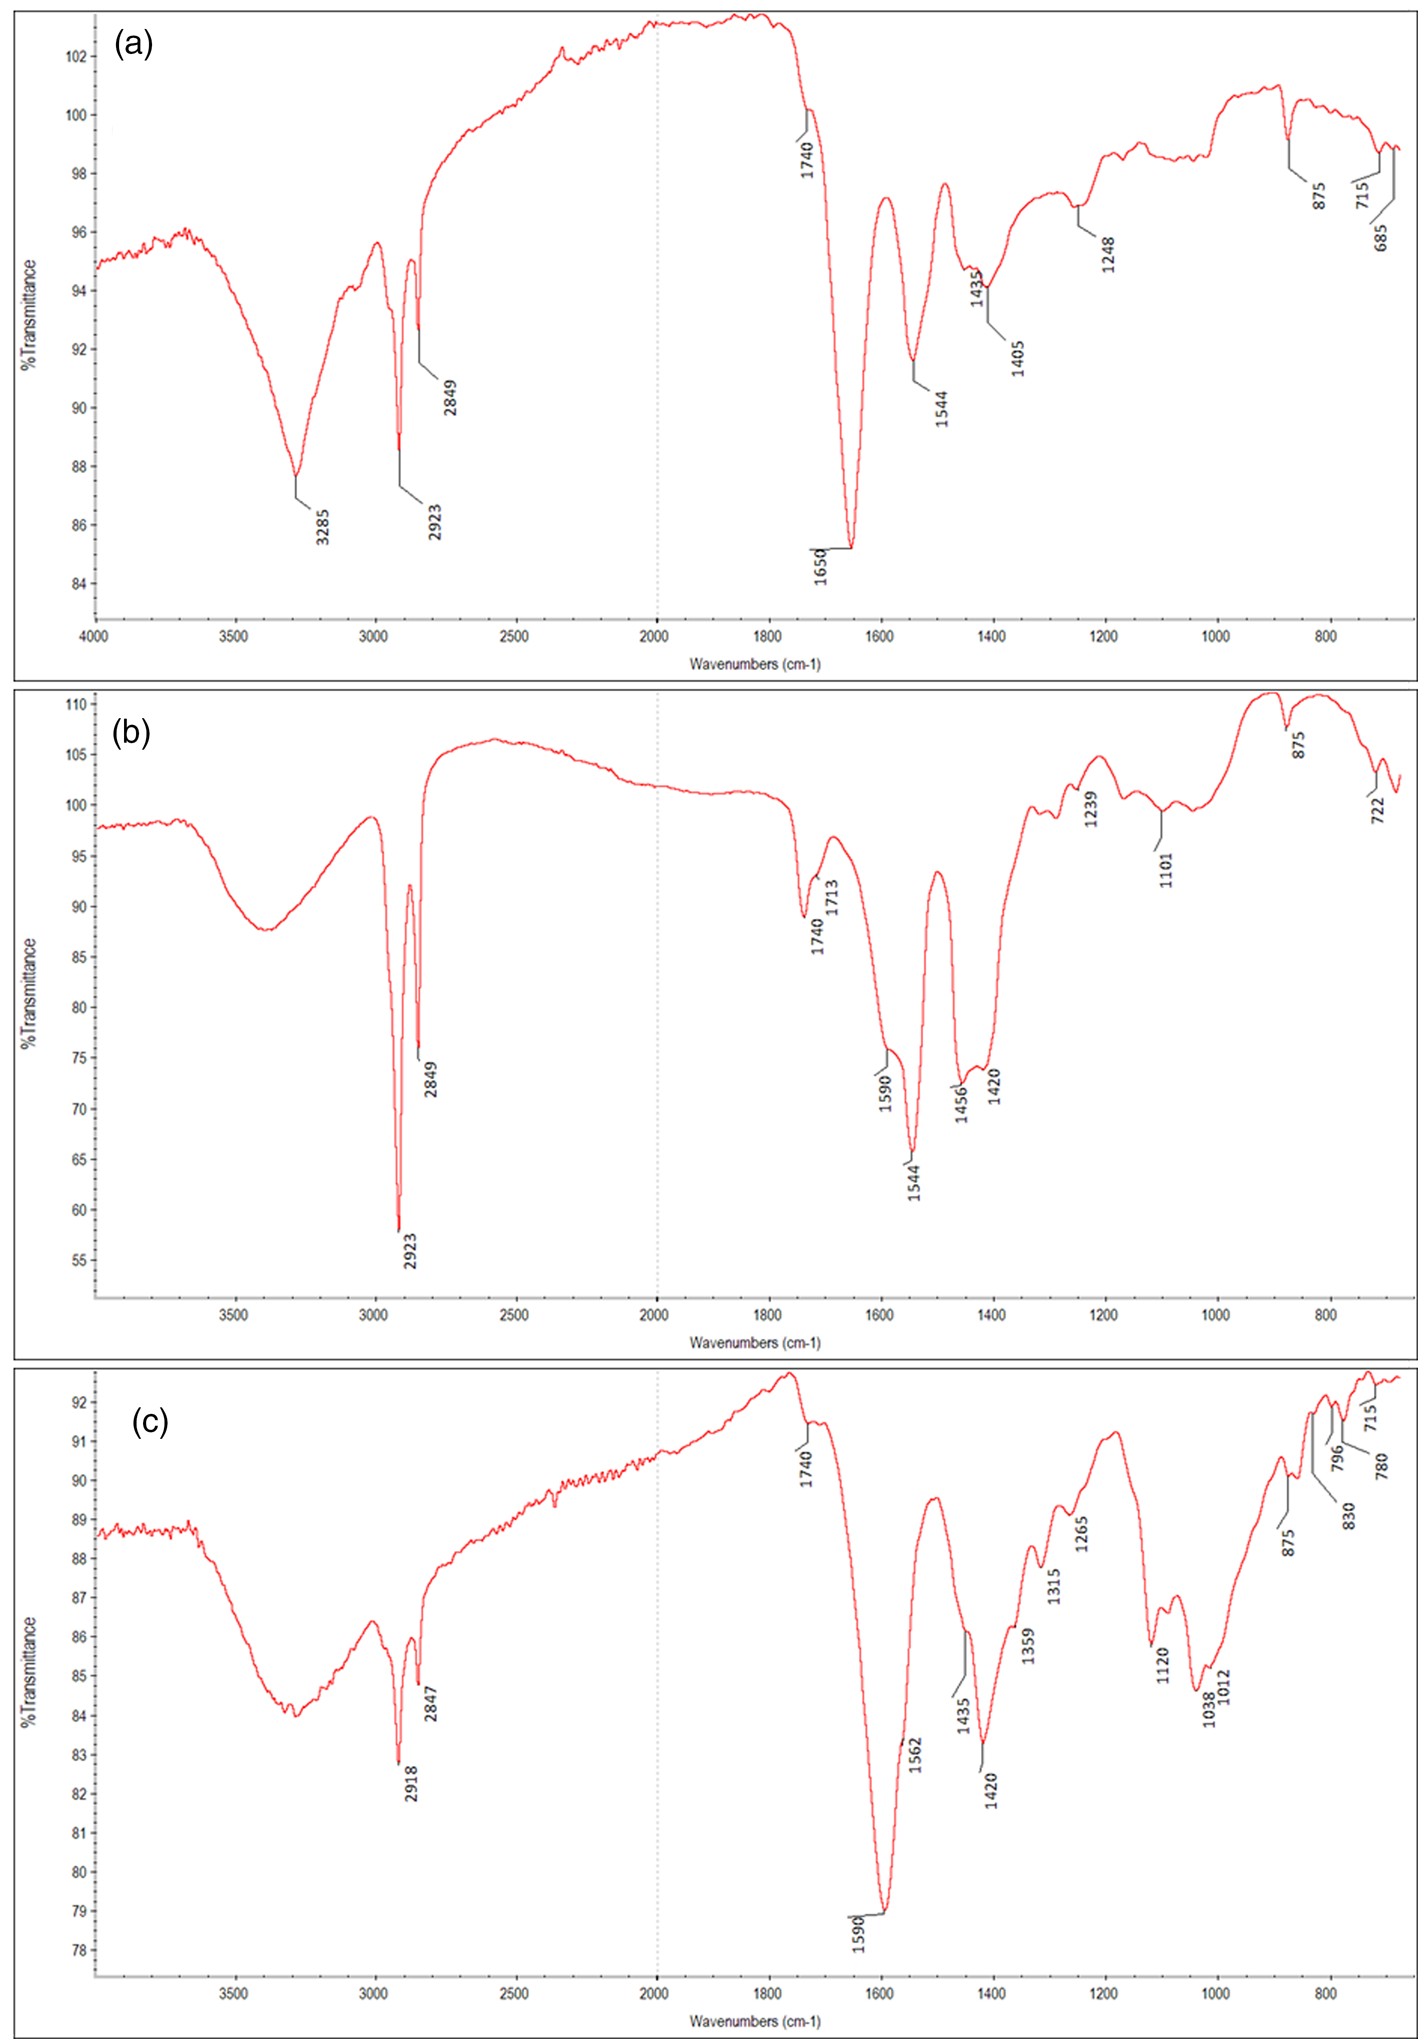
Fig. 7. The FTIR spectra of (a) the priming ground layer; (b) the carboxylate group of metallic soaps of the color layer, and (c) the lipidic binder of the color layer of the sample n.M1.
It could be assumed that the protein may be due to a glue used for a pre-priming layer of the canvas, which is followed by a ground layer constituted of lead white, and calcite mixed with an oil binder, as already reported in the technical reports of Monet's Argenteuil Basin with a Single Sailboat. Since the late 19th century, it was common that artists painted on canvases pre-primed by commercial manufacturers who sold pretreated, already ironed or in rolls for artists to stretch themselves (Callen, Reference Callen2000). This priming layer would be enough to cover the interstices and barely covering the raised points in the canvas, they would not crack. Over this layer, many artists, like Monet, applied the priming layer on their own canvases because of quality concerns, when they were looking for specific effects (Stols-Witlox et al., Reference Stols-Witlox, Ormsby, Gottsegen, Stoner and Rushfield2012). In fact, several recipes experimented with in this century discuss the effect of the binders of the preparatory layers on the stability of the paintings, focusing on the delamination and flaking of the aqueous ground layers and the influence of the absorption of the ground layer on the color changes in the aged paintings. In this painting, it would appear that a semi-absorbent ground with two alternating layers, one water-based and one oily, may have been employed. The spectrum obtained from the color layer (Fig. 7b) shows a peak centered at 1,590 cm−1, generally attributed to a metallic soap. Two distinct types of metal carboxylated species were studied: the first, thin bands featured, from pure references of crystalline metal complexes of long-chain saturated fatty acids, the so-called metallic soaps (e.g., at 1,538 cm−1 for zinc complexes and 1,510 cm−1 with a shoulder at 1,540 cm−1 for lead complexes). The latter in a wide band, corresponding to amorphous species of metallic carboxylates dispersed in the oil medium. In the FTIR spectrum, the broad band centered at 1,590 cm−1 could be mainly due to the presence of zinc carboxylates, whereas the band at 1,540 cm−1 may be ascribed to zinc stearate (Hermans et al., Reference Hermans, Keune, Van Loon and Iedema2015; Gabrieli et al., Reference Gabrieli, Rosi, Vichi, Cartechini, Buemi, Kazarian and Miliani2017; Ma et al., Reference Ma, Beltran, Ramer, Pavlidis, Parkinson, Thoury, Meldrum, Centrone and Berrie2019). Gabrieli et al. highlighted that the presence of Zn soaps seems strictly correlated to the zinc white pigment used also in mixtures with cobalt phosphate and cobalt violet paints (Gabrieli et al., Reference Gabrieli, Rosi, Vichi, Cartechini, Buemi, Kazarian and Miliani2017). The band at 1,410 cm−1 may be due to aluminum soap (Ma et al., Reference Ma, Beltran, Ramer, Pavlidis, Parkinson, Thoury, Meldrum, Centrone and Berrie2019) probably due to the red lake rather than to the addition of aluminum stearate introduced only in the 20th century (Tumosa, Reference Tumosa2001). The characteristic peaks of calcite are also observed (1,435, 875, and 715 cm−1) (Derrick et al., Reference Derrick, Stulik and Landry1999). Furthermore, a lipidic binder could be identified for the presence of some characteristic signals in the FTIR spectrum (Fig. 7c): the carbonyl band at 1,740 cm−1 and the CO stretching at 1,239, 1,170, and 1,101 cm−1 are diagnostic for the ester bonds of the triglyceride. The peak at 722 cm−1 is attributed to the out-of-plane deformation of the cis-CH and at 1,652 cm−1 to the cis-HC=CH stretching (Meilunas et al., Reference Meilunas, Bentsen and Steinberg1990). This confirms that Monet's technique was an oil painting. Finally, the FTIR spectrum (Supplementary Fig. S2) of a thin transparent yellowed varnish layer—due to a restoration intervention—covering the color layer reveals the bands at 2,932 and 2,856 cm−1, due to the stretching of the C–H of methyl and methylene groups. The band of the carbonyl group falls around 1,730 cm−1, whereas the second band, at lower wavelengths, is to ascribe to the C=O stretching of the free nonionized carboxylic acids. The band at 1,460 cm−1 comes from the bending vibrations of the C–H group, whereas the peak at 1,170 cm−1 can be assigned to the C–O stretching of the ester functional group. Results match with beeswax, a complex organic blend of numerous organic compounds, including mainly higher esters. Furthermore, hydrocarbons and free fatty acids are present as well (Svečnjak et al., Reference Svečnjak, Baranović, Vinceković, Prđun, Bubalo and Gajger2015).
Optical Microscopy in VIS and UV Light and SEM-EDS Analyses
The analyses of the cross-section of the n.M1 sample with the optical microscope by visible and ultraviolet light shows a white ground layer (n. 1 in Fig. 8a) giving strong fluorescence under UV light (Figs. 8c, 8d). A thick violet layer (n. 2 in Fig. 8a) evidences a homogeneous distribution of pigments of different sizes (up to 15 μm) and colors (white, green, blue, red, and yellow). The white grains under UV radiation (H filter) have the characteristic yellow fluorescence of zinc white (Carden, Reference Carden1991). The colored layer appears unevenly covered by a transparent and colorless varnish layer (Fig. 8c).

Fig. 8. (a) Optical micrograph with visible incident illumination of the polished cross-section of the M1 paint chip, where the background was cropped; optical micrographs of the polished cross-section of the M1 sample (b) in VIS reflected light, (c) under UV light (H3 filter), and (d) under UV light (A filter).
The SEM backscattered electron image of the paint cross-section shows the abundance of varying pigments within a small section of the painting (Fig. 9). The EDS spot analyses and the lead and calcium maps confirm the FTIR data indicating that the ground, consisting of a single layer and ranging from approximately 20 to 60 μm in thickness, contains lead white and calcium carbonate (EDS maps in Fig. 9 and EDS analysis n. 5, 9, and 10 in Table 2), as formerly disclosed in the study performed on Water Lily Pond, a 1900s painting (Muir, Reference Muir, Gloria and Shaw2014c). The widespread and consistent presence of zinc within the color layer justifies the use of zinc white, as an achromatic pigment. Considering the EDS maps and the spot analyses (Table 2 and Fig. 10), the following pigments/fillers may be identified: mercury is associated with sulfur, as mercuric sulfide, known as vermilion (analyses n. 2, 3, 4, and 22). Then, sulfur is also associated with cadmium, ascribed to cadmium sulfide, known as cadmium yellow (analyses n. 7, 16, 17, 25, and 26). Analyses n. 11, 12, 23, and 24 indicate the presence of chromium related to the oxide form, Cr2O3, or hydrated oxide, Cr2O3·2H2O. The use of chrome yellow could be excluded since there is no correspondence between the chrome and lead maps. More, the Pink Water Lilies was painted between 1887 and 1889. Monet had been using cadmium yellow pigments since 1880 up to the end of his life, having found them more stable than chrome yellow, which tended to darken (Newman, Reference Newman and West FitzHugh1997).
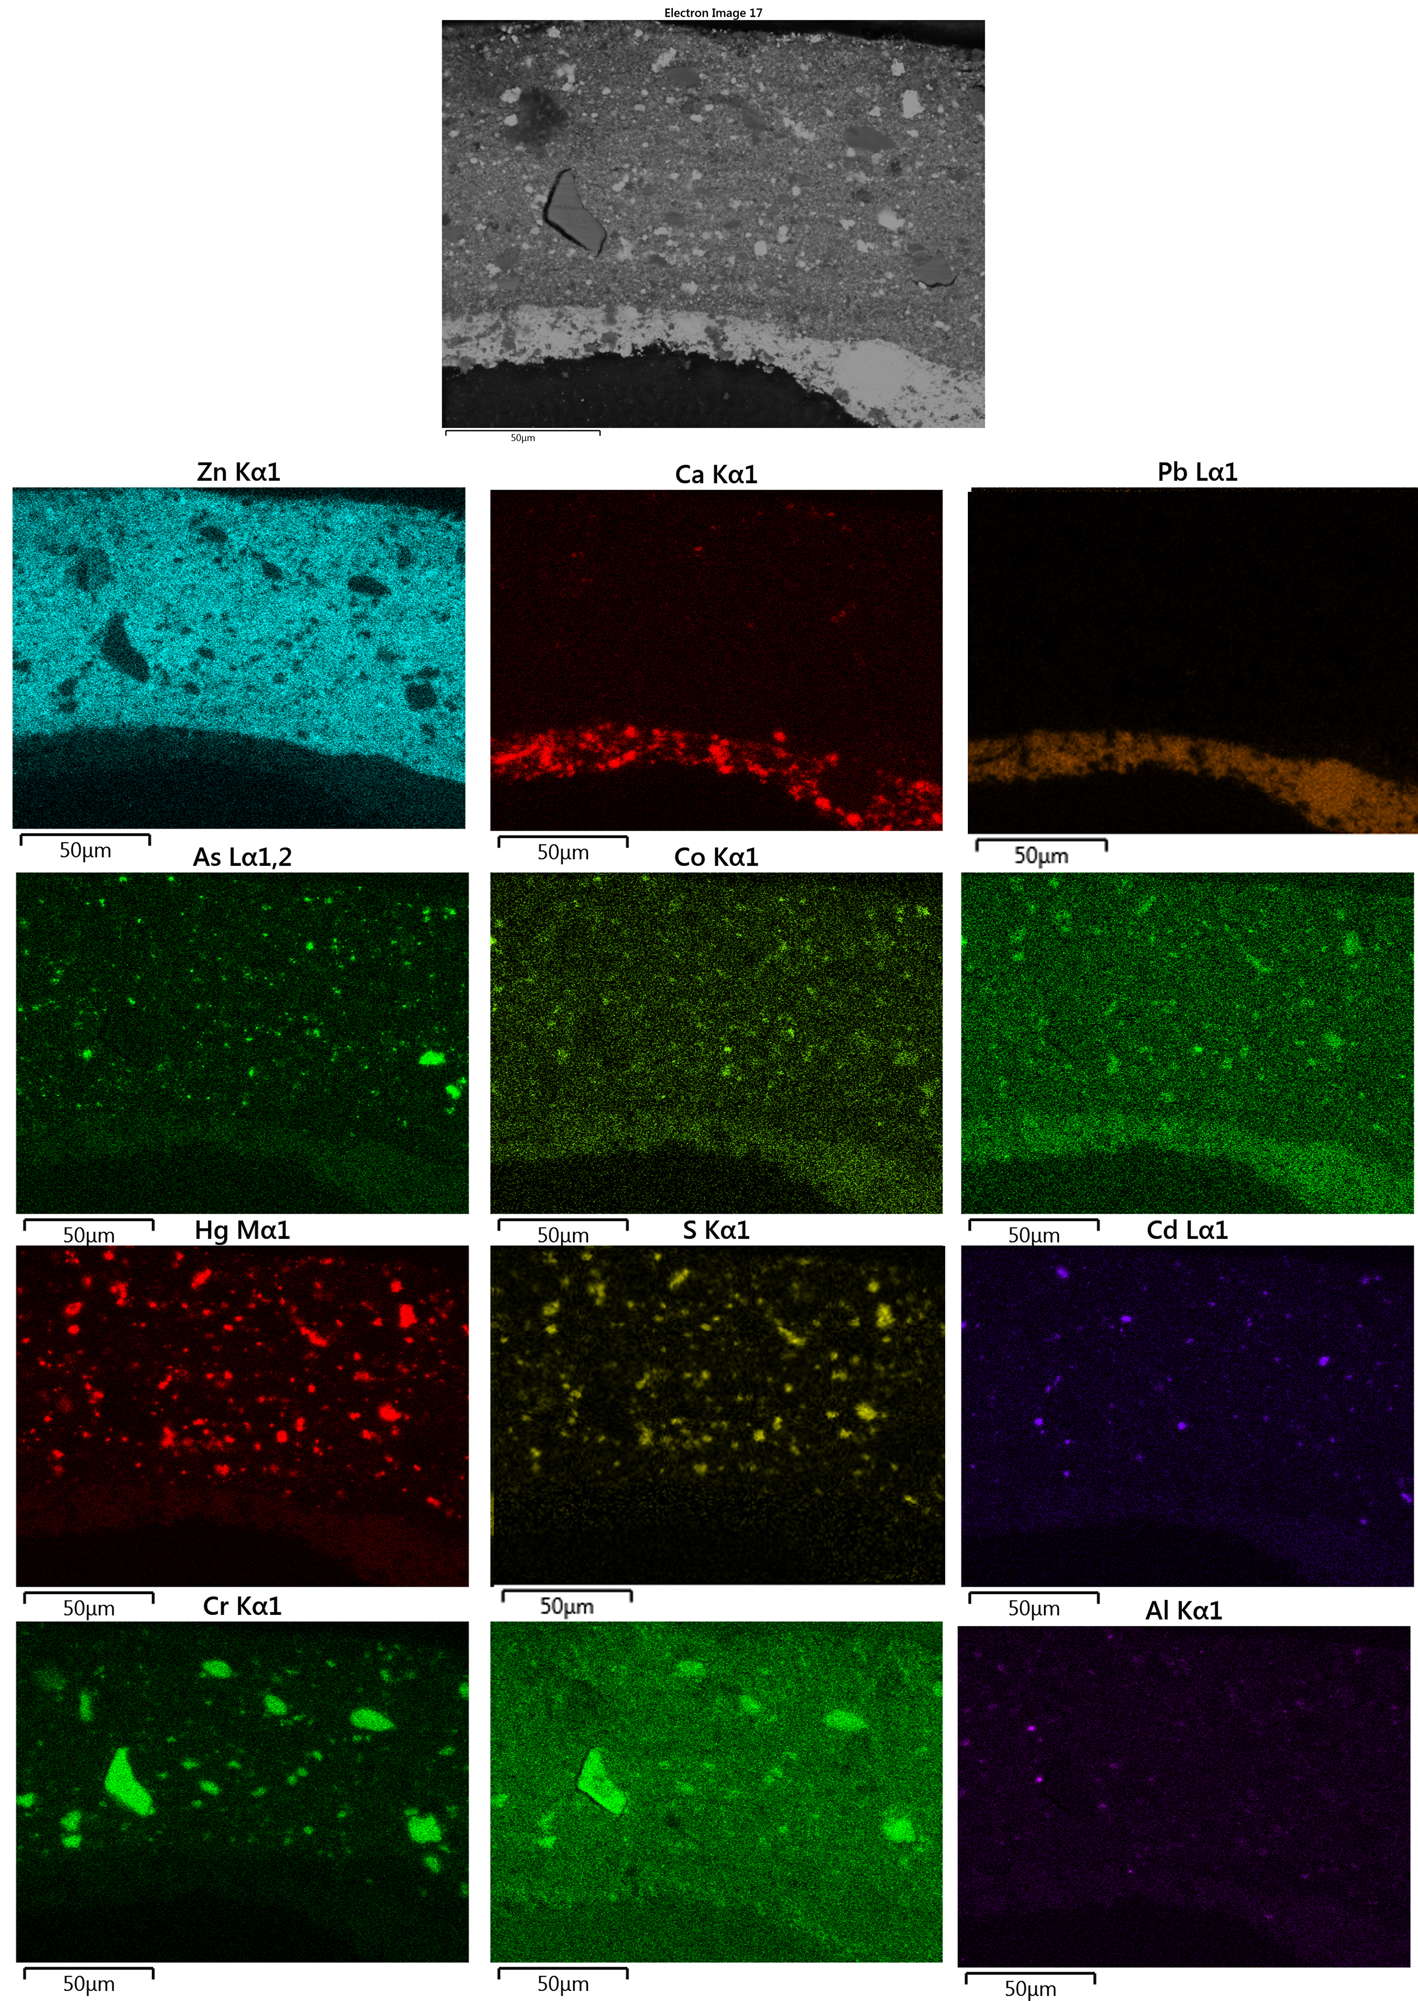
Fig. 9. Backscattered (BSD) image of the sample n.M1 and chlorine, lead, arsenic, cobalt, phosphorus, mercury, sulfide, cadmium, chromium, oxygen, zinc, aluminum, and calcium EDS maps.

Fig. 10. BSE images of the M1 sample and relative EDS point analysis (a) from no. 1 to 18 and (b) from no. 18 to 27 reported in Table 2.
Table 2. Atomic and Weight Percentages of Elements Detected in EDS Spots Shown in Figures 10a and 10b.

EDS data are all within 1% uncertainty.
Moreover, several cobalt-based pigments have also been identified. Where associated with phosphorus, the use of cobalt violet, a cobalt phosphate, Co3(PO4)2 (analyses n. 20 and 21), was ascertained; it is not possible, however, to identify the anhydrous or the hydrated form. The EDS maps show that cobalt violet is also present in the darker variety as cobalt arsenate Co3(AsO4)2. In association with arsenic, as well as with magnesium, cobalt forms magnesium cobalt arsenate. Indeed, since magnesium arsenate has the same structure as cobalt arsenate (Corbeil et al., Reference Corbeil, Charland and Moffatt2002; Eastaugh et al., Reference Eastaugh, Walsh, Chaplin and Siddall2008; Casadio et al., Reference Casadio, Bezúr, Fiedler, Muir, Trad and MacCagnola2012), mutual replacement of these compounds can quite easily occur (analyses n. 13, 14, 19, and 27 in Table 2). In the analysis n. 13, cobalt is also associated with aluminum, therefore the use of cobalt blue, CoAl2O4, cannot be excluded.
Furthermore, all the points have a relatively high percentage of zinc, that is zinc oxide as the white pigment. The silicon element associated with oxygen in a crystalline morphology could be due to the presence of quartz (EDS analysis n. 1 and spectrum n. 18 in Supplementary Fig. S3a). Finally, as regards the presence of aluminum (EDS spectrum n. 6 in Supplementary Fig. S3b), two hypothesis could put forward: either aluminum comes from the presence of an organic dye precipitated on an aluminum hydroxide base to form a red lake, or aluminum was added as color filler in the tube as an inhibitor in the drying of oil colors (Piva, Reference Piva1984). As the EDS maps on the cross-sections highlight the presence of grains of pigment, it is assumed that the most reliable hypothesis is a (red) lake pigment.
The cross-section of the sample n.M2 shows a discontinuous priming layer covered with an inhomogeneous and wavy color (Fig. 11a). The examination of the paint cross-section under UV radiation reveals that the white ground priming layer shows a strong fluorescence (Figs. 11c, 11d). The color layer appears thick and aqua green in color under visible light (layer n. 2 in Fig. 11a), although granules of different sizes and colors (white, green, blue, red, and yellow) are also clearly visible. As for the sample n. M1, the zinc white pigment evenly distributed in the color layer shows the characteristic yellow fluorescence under UV radiation.

Fig. 11. (a) Optical micrograph with visible incident illumination of the polished cross-section of the M2 paint chip where the background was cropped; optical micrographs of the polished cross-section of the M2 sample (b) in VIS reflected light, (c) under UV light (H3 filter), and (d) under UV light (A filter).
SEM-EDS maps and spot analyses (Fig. 12) highlight the use of lead white and calcite for the ground layer, while the color layer shows a widespread and consistent presence of zinc white. Moreover, the elemental maps and EDS point analyses allow us to recognize different pigments, already identified in the sample n.M1, although in a different amount, such as vermilion, cadmium yellow, and chrome green. Here too, albeit in traces, cobalt is associated with the arsenic relative to the cobalt arsenate variety of cobalt violet.
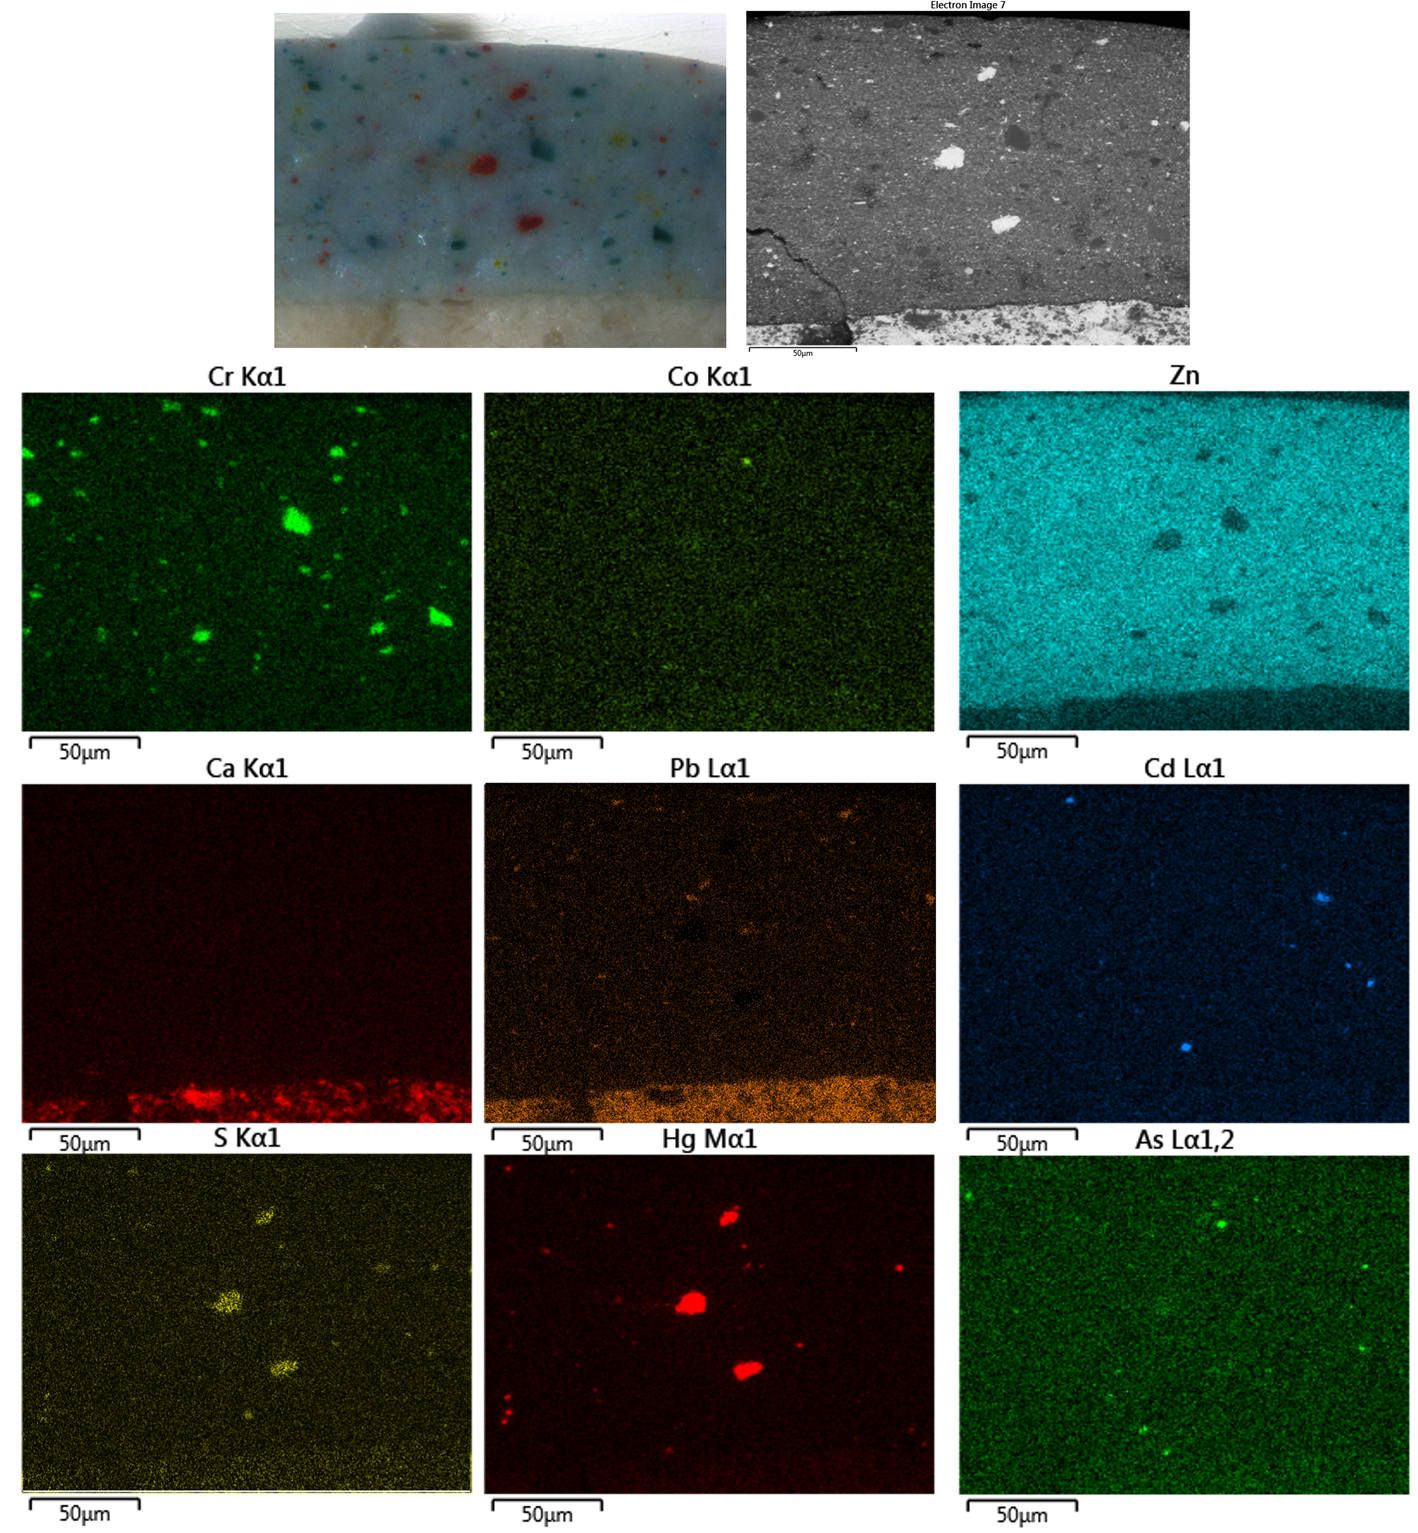
Fig. 12. Visible and BSD image of the sample n.M2 and arsenic, zinc, chromium, cobalt, sulfur, mercury, calcium, lead, cadmium, and potassium EDS maps.
Comparing both the EDXRF data with the atomic percentage calculated with SEM-EDS on different areas of the two cross-sections, we have tried to obtain a plausible original position of the two fragments based on the amount of the elements detected. Particularly, chrome and mercury were respectively considered as the characteristic chromatic elements for the violet (M1) and the green (M2) samples. Hence, these elements seem to be in ratio with the achromatic zinc oxide, homogeneously distributed in the layer. The Zn/Hg average value calculated over the entire thickness of the M1 section was about 18. The Zn/Hg ratios calculated for the EDXRF data show very similar values for the points n. 14 and 18 (respectively 17 and 14—other points show ratios up to 590), both on the violet foreground near the Monet's signature. Likewise, the Zn/Cr average value of the M2 cross-section of about 28 was compared with the EDXRF Zn/Cr values, giving similar values for the points n. 15, 23, and 24 (Fig. 1) on the darker green edges of the water lilies.
With vermillion, red lake, cobalt blue, viridian, and cadmium yellow pigments from previous studies (Dredge et al., Reference Dredge, Wuhrer and Phillips2003; Roy, Reference Roy2007; Muir et al., Reference Muir, Fiedler, Johnson and Erdmann2014), two chromium greens, the anhydrous and hydrated forms, were found in the painting. In addition, the SEM-EDS microanalyses and maps were useful to recognize four possibly adventitious cobalt varieties (cobalt aluminate, cobalt phosphate, magnesium cobalt arsenate, and cobalt arsenate), forming along the manufacturing process. Pigments were mixed with zinc oxide, atypical for Monet, who usually employed lead white (Dredge et al., Reference Dredge, Wuhrer and Phillips2003; Roy, Reference Roy2007; Muir et al., Reference Muir, Fiedler, Johnson and Erdmann2014). More, the analyses of organic fraction with FTIR gave us important information about the presence of a pre-priming and ground layers which were respectively realized with glue and oil binder. The pigments of the color layer were also mixed with a lipidic binder.
Conclusion
The noninvasive and micro-destructive analyses dealt with in this work yield new information regarding the materials used by Monet in the Pink Water Lilies painting.
Claude Monet's Pink Water Lilies was painted on a pre-primed linen canvas. The ground is off-white and consists of a single layer of lead white mixed with calcium carbonate in an oil binder.
The combination of the reflectance spectra with the EDXRF data enabled at the identification of the pigments used in the painting: cobalt blue and arsenate cobalt violet, vermillion, chromium green, and yellow cadmium. Two forms of chromium green pigments, both the anhydrous and hydrated forms, were recognized comparing the maximum values of their reflectance spectra. In some points, the green pigments are mixed with the yellow cadmium also detected for the yellow pistil of one water lily. In most of the pink and violet areas, zinc and cobalt elements were detected suggesting a mixture of cobalt violet and zinc white pigments. Zinc proved to be a ubiquitous element, suggesting Monet using a pre-mixed tube paint with a white pigment, in this case the zinc white. In 1841, J.G. Rand patented the first collapsible artist's paint tin tube that allowed to paint storage colors without desiccation. Renoir said, “Without tubes of paint, there would have been no Impressionism” (Callen, Reference Callen2000).
Although noninvasive analyses allow us to recognize many pigments, only with the SEM-EDS analyses on two cross-sections assent their presence, while suggesting the use of others. Indeed, the cross-sections give information on Monet's painting technique. A single color layer was observed in both samples, probably coming from the edges of the painting. In the color layer, a lot of pigments appear to be carefully and homogeneously mixed. Indeed, in the Pink Water Lilies painting, up to ten pigments (vermilion, cadmium yellow, chromium green in anhydrous and hydrated forms, three varieties of cobalt violet: cobalt phosphate, magnesium cobalt arsenate and cobalt arsenate, cobalt blue, quartz, and red lake) were identified, together with white zinc added as a filler.
The painting was signed by Claude Monet using black tones. There is no evidence in the use of mineral pigments, so it assumes that an organic black pigment was employed.
The linen canvas was pre-primed with a collagen-based glue. The ground is off-white and consists of a single layer where lead white was mixed with a calcium carbonate.
FTIR analyses confirmed that Monet used a drying oil as a binder and the presence of metal carboxylates (aluminum and zinc soaps) was also assessed. In the choice of pigments seems that Monet followed the list of “good paint” described by Vibert in his Science of Painting edited in 1891 (Vibert, Reference Vibert1891). The Roman painting belongs to the early production in Monet's career, when he made use of a complex mixture of colors, before changing his palette of pigments as well as his tendency to purer colors (Roy, Reference Roy2007). This rare opportunity to investigate a “Water lilies” paintings gave us important information about the materials used by Monet in the first part of his career.
Supplementary material
To view supplementary material for this article, please visit https://doi.org/10.1017/S1431927621013556.
Acknowledgments
Thanks to Rita Quaresima for revising the last Italian-English translation draft.


 Open access