


Introduction
Soil and groundwater contamination by recalcitrant organic substances such as polycyclic aromatic hydrocarbons or chloroethenes (perchloroethene, trichloroethene, dichloroethene, vinyl chloride) is a major health and environmental issue. Despite much progress, new effective methods for “in situ remediation” are still required. Among recent developments, the high reactivity and the large surface/volume ratio of materials with specific properties (active charcoal, nanoparticles) may offer advantages compared with existing solutions (Zhang, Reference Zhang2003). Zero-valent iron nanoparticles (nZVI) have demonstrated their efficiency in degrading problematic contaminants at the laboratory scale (e.g., nitrates, chlorinated solvents) (Fu et al., Reference Fu, Dionysiou and Liu2014; Stefaniuk et al., Reference Stefaniuk, Oleszczuk and Ok2016). However, in decontamination conditions, it has been seen that the efficiency of nZVI is dependent on their reactivity toward the contaminant as well as their accessibility to contaminants (Kocur et al., Reference Kocur, Lomheim, Molenda, Weber, Austrins, Sleep, Boparai, Edwards and O’Carrol2016). These two properties can potentially be affected by the presence of biofilms—that are the main form of living microorganisms in the environment as they offer them a protection against various environmental stresses (dehydration, pollution, predation, etc.). These biological structures are composed of microorganisms embedded in an extracellular matrix [extracellular polymeric substances (EPS)] and growing at an interface (solid/liquid, liquid/air, solid/air). Environmental biofilms are generally multispecies biofilms (i.e., biofilms composed of several species of microorganisms), in contrast to monospecies biofilms which are often used in in vitro studies. Biofilms are one of the components of a groundwater environment, akin to aquifer mineral composition (e.g., clay, sand), and therefore may have an impact on the efficiency of remediation approaches such as nanoremediation using nZVI. In this context, the use of microscopy offers the possibility of visualization of biofilm structures at different scales of magnitude. Coupling several approaches in microscopy can enable, where possible, imaging of the same sample at different resolutions (Lawrence et al., Reference Lawrence, Swerhone, Leppard, Araki, Zhang, West and Hitchcoxk2003; Wrede et al., Reference Wrede, Heller, Reitner and Hoppert2008).
Biofilm detection, observation, and analysis is possible with a large choice of microscopy approaches [e.g., fluorescence microscopy, scanning electron microscopy (SEM), confocal laser scanning microscopy, transmission electron microscopy (TEM)] coupled with a large choice of cell labeling [e.g., fluorescent in situ hybridization, 4’,6-diamidino-2-phenylindol (DAPI)] and exopolymeric substance labeling (e.g., lectins for EPS, dichlorodimethylacridinone for eDNA) (Surman et al., Reference Surman, Walker, Goddard, Morton, Keevil, Weaver, Skinner, Hanson, Cadwell and Kurz1996; Lawrence et al., Reference Lawrence, Swerhone, Leppard, Araki, Zhang, West and Hitchcoxk2003; Kämper et al., Reference Kämper, Vetterking, Berker and Hoppert2004; Zhang et al., Reference Zhang, Neu, Zhang, Bellenberg, Kuhlicke, Li, Sand and Vera2015). Each approach has its specific advantages, but also its drawbacks, the main two being the potential impacts of sample preparation (fixation, drying) on native morphologies and cell structures and the difficulties observing a biofilm associated with its growth substratum (solid), often leading to the removal of biofilms from substrata before observation (Surman et al., Reference Surman, Walker, Goddard, Morton, Keevil, Weaver, Skinner, Hanson, Cadwell and Kurz1996; Priester et al., Reference Priester, Horst, Van De Werfhorst, Saleta, Mertes and Holden2007).
To overcome the these drawbacks, the present study investigates the possibilities of coupling several approaches, taking into account that sample preparation and labeling differ according to the type of microscopy (Wrede et al., Reference Wrede, Heller, Reitner and Hoppert2008). The methodology was applied to an example of a multispecies biofilm interacting with nZVI. Biofilms were grown for several weeks either as flocs or on a solid surface [sand, polyvinyl chloride (PVC) tube]. The sampling, labeling, and treatment strategies were developed and adapted for each type of microscopy to access the surface or the inside of the biofilm, biofilm structure, and metal location. Special attention was given to the different problems caused by these specific samples, which are a mixture of “soft” hydrated biological samples and “high hardness” mineral particles. Due to the size of the bacteria and EPS filaments in the biofilm (a few microns at most), their observation is limited with optical microscopy. Thus, we applied high-vacuum SEM, variable pressure field-emission scanning electron microscopy (VP-FE-SEM), cryo-SEM, scanning transmission electron microscopy in the SEM (STEM-in-SEM) and TEM techniques.
Materials and methods
Table 1 summarizes the approaches tested in this study, in terms of biofilm growth, sampling, labeling, and treatment according to the microscopy techniques used.
Table 1 Sample Selection and Preparation and Observation Characteristics According to the Microscopy Used for Biofilm/nZVI Interaction Analysis.

SEM, scanning electron microscopy; EDS, energy dispersive X-ray spectrometry; STEM, scanning transmission electron microscopy; TEM, transmission electron microscopy; PVC, polyvinyl chloride; nZVI, zero-valent iron nanoparticles; NP, nanoparticle; DAPI, 4’,6-diamidino-2-phenylindol; SE, secondary electron; BSE, backscattered electron; BF, bright field; HAADF, high angle annular dark field; DF, dark field; EELS, electron energy loss spectroscopy.
Culture and sampling of biofilms
Biofilms were grown either in PVC tubes (inner Ø: 4.8 mm) or a continuous up-flow fixed-bed bioreactor (laboratory-scale column) (20 cm high; 2.5 cm in diameter) filled with sand (d50=0.51 mm) (Fig. 1). The main advantage of PVC tubes is the opportunity to easily and quickly obtain a large amount of biological material as flocs or biofilms attached to a smooth surface (i.e., the inner face of the PVC tube). The column approach was used in order for the biofilm to attach to the sand grains such as in a natural aquifer. However, the intrinsic characteristics of sand grains (rough and hard) limit the microscopic approaches that can be applied. For biofilm culture, a groundwater sample was used as the inoculum and microbial development was favored by supplementing the water with a nutritive solution (sodium acetate 10 mM and yeast extract 0.2 g/L) and an electron acceptor (NO3 −, solution of NaNO3 10 mM) (Hellal et al., Reference Hellal, Jolly, Michel, Mouvet, Wille and Ollivier2015). Anaerobic conditions (under N2 bubbling) were maintained as in a deep contaminated aquifer. The incubation temperature was maintained at 20°C.
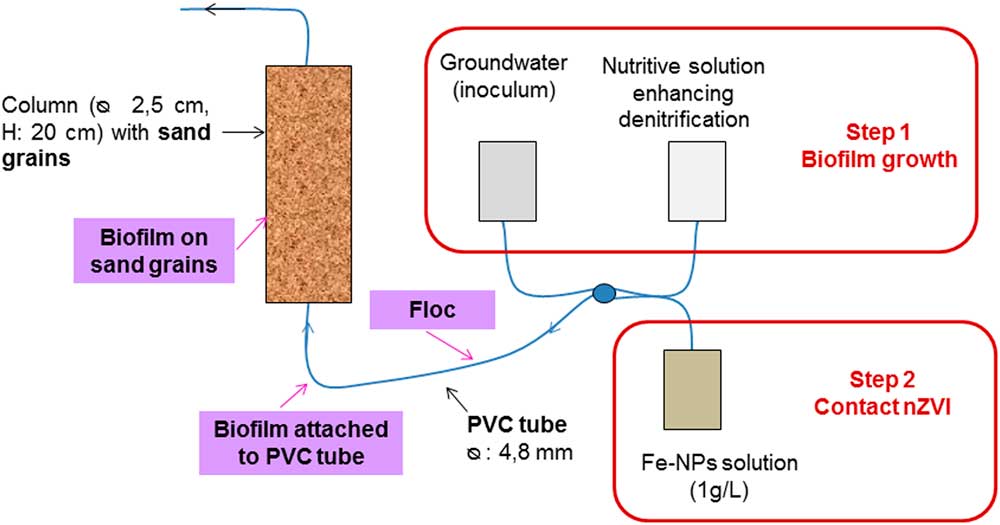
Figure 1 Device developed for the growth of biofilms as flocs [in polyvinyl chloride (PVC) tube] or attached on a surface (inner face of PVC tube or sand surface by sampling in the column).
First the biofilms were left to grow during 6 weeks without nZVI. Then a nZVI suspension (1 g/L, NANOFER 25 S, mean particle size ~50–80 nm; NanoIron, Rajhrad, Czech Republic) was continuously introduced into the PVC tube or column (1 g/L, 10 mL/min, for five poral volumes). Finally, biofilms were sampled as flocs in the PVC tube or as attached biofilms on the inner face of PVC tubes, or collected as attached to sand grains in the column. Biofilms attached to the inner face of the PVC tube were used either still attached to the PVC tubes, or detached from the tubes by removing the biofilm with a sterile scalpel (this allows to access the external face of the biofilm) and placing them on a SEM copper stub.
Biofilm labeling for fluorescence microscopy
Biofilms as flocs were first stained with DAPI for cell labeling and then with lectin for EPS detection (Michel et al., Reference Michel, Garrido, Roche, Challan Belval and Dictor2011). Briefly, flocs were incubated in the dark with a DAPI solution (5 µg/L) for 15 min. Samples were then washed with phosphate-buffered saline (PBS) 1× (NaCl 0.8 g/L, KCl 0.2 g/L, Na2HPO4 1.44 g/L, KH2PO4 0.24 g/L) and labeled with lectin PNA-FITC [Peanut Aglutinin, lectin from Arachis hypogaea (peanut) FITC conjugates; Sigma-Aldrich] or ConA-FITC [lectin from Canavalia ensiformis FITC conjugate; Sigma-Aldrich, St. Louis, MO, USA] (both lectins at 50 µg/mL in PBS 1× buffer) in the dark for 20 min. Samples were washed before observation in a fluorescent microscope (Zeiss Axio Imager Z1, Plan Neofluar ×100 objective (immersion); AxioVision 4.6 software). To avoid out of focus images and to decrease background fluorescence, a z-stack approach for fluorescent labeling imaging of the flocs was applied. Using this approach, 15 images of the same area in the biofilm were taken at different focus/depths over an overall distance of 0.3 µm, and then merged.
Lectin–gold labeling and sample preparation for observation for electron microscopy
Labeling with lectins coupled to gold particles (15 and 40 nm) (PNA and ConA; EY Laboratories, San Mateo, CA, USA—ready-to-use lectin solutions at a concentration of 10–20 µg/mL) was applied to the samples before SEM observations. Labeling was performed on the fresh biofilm immediately after sampling. Biofilms were washed once using PBS 1× buffer. They were then covered with the ready-to-use solutions of lectin coupled to gold clusters for 90 min in the dark. After removing the lectin–gold solution, biofilms were washed three times with PBS 1× buffer. For STEM-in-SEM and (S)TEM (in TEM), labeling was performed before glutaraldehyde fixation.
For STEM-in-SEM and (S)TEM (in TEM) observations, samples (lectin–gold labeled biofilms) were washed three times with cacodylate buffer (0.1 M, pH 7.2) and submitted to a prefixation step. For this, cells were fixed in 2.5% glutaraldehyde in Cacodylate buffer 0.15 M at pH 7.2 for 2 h, under vacuum. Samples were then postfixed in 1% osmium tetroxide for 1 h and extensively rinsed before inclusion in 2% agar gel (bacteriological quality) at 60°C. Agar was used to stabilize biofilm samples. Stabilizing samples in gel make them easy to cut into small pieces of 1 mm3 before dehydration and inclusion. Samples were dehydrated through a series of graded ethanol solutions from 70 to 100%. The specimens were infiltrated with a mixture of acetone–Epon (50/50) for 3 h then with pure Epon for 16 h. Finally, the specimens were embedded in DMP30-Epon for 24 h at 60°C. Ultrathin sections (80 nm) were obtained on a Leica UC6 microtome (Wetzlar, Germany), collected on copper hexagonal grids.
For STEM-in-SEM observations, samples (biofilm sections on copper grids) were coated with 2 nm Carbon in a Cressington 208C (Cressington, Watford, UK) or 0.5 nm Pt/Pd in a Cressington 208HR. Indeed, noncoated section on grids did not withstand the electron beam energy and serious degradation was observed when increasing magnification.
Cryo-SEM
Two different cryo-SEM options were used. The first option is the use of a high-vacuum Hitachi S4500 (Tokyo, Japan) cold-FEG SEM equipped with a Quorum Technology Polaron LT 7400 (Lewes, UK) cryo-SEM preparation system (including cryo-fracturation, gold coating). The samples were frozen in nitrogen slush at −210°C, and then transferred to the preparation chamber. No coating was applied on the samples. Cryo-fractionation (if necessary) was processed in the preparation chamber at −180°C. Cryo-fractionation allows observation of the internal organization (including the EPS network) of the biofilm. Then, SEM observations were performed at −108°C at low voltage (1 kV) using a secondary electron (SE) detector. A preobservation step at −70°C was applied in the SEM chamber to remove the ice layer formed on the surface of the sample during its transfer.
The use of a high-vacuum SEM at low voltage enabled good-quality SE images. However, low voltage conditions are not well adapted for performing backscattered electron (BSE) images, and most of all, energy dispersive X-ray spectrometry (EDS) analysis on noncoated samples. Thus, a Peltier stage (up to −50°C) was used in a VP-FE-SEM (Tescan Mira3XMU, Brno, Czech Republic). The samples were first frozen in a nitrogen slush at −210°C, then transferred to the cooled stage under low-vacuum conditions. Water was kept under solid state by using low-vacuum conditions (typical conditions used were T=−50°C and P=80 Pa nitrogen). Observations were performed at 15–25 kV using a low-vacuum SE detector (Jacka et al., Reference Jacka, Zadrazil and Lopour2003). This SE detector is adapted for working under variable pressure conditions, enabling organic matter visualization and the higher voltages allowed use of a BSE detector for the discrimination of mineral particles with high atomic numbers, that is, nZVI and lectin–gold labeling. EDS was used for chemical analysis using an EDAX Team EDS system with a silicon drift detector EDAX Apollo XPP (EDAX, Mahwah, NJ, USA) at a working distance of 15 mm (detector area 10 mm2, collection solid angle 5 msrad).
STEM-in-SEM and (S)TEM (in TEM)
Samples (biofilms attached to the inner face of PVC tubes) were prefixed with glutaraldehyde after lectin–gold labeling while still attached to their support, thus limiting manipulations for biofilm sampling (detachment from the PVC tube) and subsequent perturbation of its structure. It appeared that the biofilms then came off their support during the fixation process. This appeared to be an advantage for observations, as it was easier to make cross-sections on the fixed biofilm after its detachment from the growth support.
STEM-in-SEM analysis was conducted with a STEM detector used in the VP-FE-SEM using bright field (BF) and dark field (DF) imaging (Fig. 2) in combination with SE and BSE detectors. EDS analysis was performed for identifying particles using an EDAX Team EDS system.
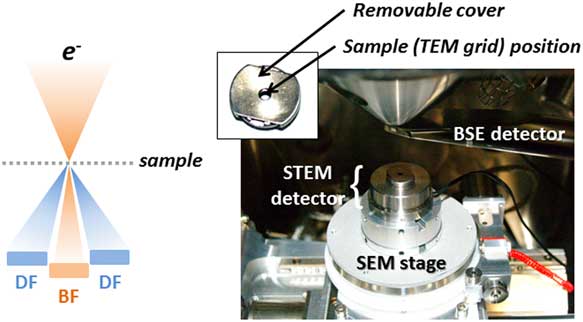
Figure 2 Scanning transmission electron microscopy (STEM)-in-scanning electron microscopy (SEM) detector on the Tescan Mira stage. BSE, backscattered electron; TEM, transmission electron microscopy; BF, bright field; DF, dark field.
TEM observations in combination with EDS analysis were performed on a Philips CM20 (Eindhoven, The Netherlands) LaB6 operated at 120 kV and a JEOL ARM200 F (Tokyo, Japan) Cold-FEG equipped with an EDS system JEOL Centurio (detection area 100 mm2, collection solid angle 0.98 srad) (JEOL, Tokyo, Japan) operated at 80 kV.
Results and Discussion
Fluorescent Microscopy
The interaction of biofilms (as flocs) with nZVI was initially analyzed using fluorescent microscopy after DAPI and lectins (as PNA-FITC and ConA-FITC) labeling, to target cells and EPS (as exopolysaccharides), respectively (Michel et al., Reference Michel, Wille, Jolly, Richard, Burel, Ollivier, Mouvet and Hellal2016). The two tested lectins-FITC positively labeled the studied flocs (Fig. 3). Lectin labeling was detected close to/around cells, strongly suggesting the presence of capsular exopolysaccharides (Fig. 3). nZVI aggregates (as black aggregates detected only in flocs in contact with nZVI) were embedded in the biofilm structure as shown on Figure 3, strongly suggesting that biofilms were able to interact with nZVIs and acted as a trap. However, with this technique, it was not possible to detect nZVIs as single particles, but as 0.5–5 µm aggregates. With varying focus, nZVI aggregates could not be observed. They were absent in deep zones of the flocs where cell density was very high, suggesting that they were only located at the periphery of flocs. Fluorescent microscopy can thus be considered here as an interesting, rapid and low-cost screening approach, but it was not precise enough to appreciate EPS and nZVI distribution in the studied biofilm (Table 2). Biofilm’s EPS labeling by lectins can also be achieved using electron microscopy. In this case, lectins have to be associated to a metal instead of a fluorescent dye. PNA and ConA (this time as PNA and ConA coupled to gold nanoparticles), as they gave a positive labeling using fluorescent microscopy, were thus tested for the labeling of the extracellular matrix of the studied biofilm in STEM experiments (Kämper et al., Reference Kämper, Vetterking, Berker and Hoppert2004). This approach takes more time and is more expensive than fluorescent microscopy but it offers the advantage of higher resolutions (Tables 1 and 2).

Figure 3 Fluorescent microscopy observations of biofilm (floc) with (b ,d) or without (a,c) nZVI contact. Flocs were labeled with DAPI (blue) and Lectin [(a),(b) in red: ConA. (c), (d) in pink: PNA; images were recolored for better observation/contrast of both labeling (DAPI and lectin) on the same image]. Flocs were labeled with DAPI (blue) and Lectin (here ConA) (red).
Table 2 Advantages and Drawbacks of Each of the Microscopy Technique Applied to the Biofilm/NP Interaction Studies (Michel et al., Reference Michel, Wille, Jolly, Richard, Burel, Ollivier, Mouvet and Hellal2016).
SEM, scanning electron microscopy; STEM, scanning transmission electron microscopy; TEM, transmission electron microscopy; NP, nanoparticle; EDS, X-ray spectrometry; EELS, electron energy loss spectroscopy.
Cryo-SEM
Cryo-SEM was applied to observe biofilm development and location of EPS (via lectins–gold labeling) and nZVI, and also to observe bacterial attachment onto sand grains. SEM observations were performed on bulk samples (with or without fractionation) of the sample in the preparation chamber on the Hitachi SEM. SE imaging enables the observation of the organic molecules and thus the biofilm on its own, biofilm colonization of sand grains, and their interactions with nZVI. In contrast, the location and identification of lectin–gold labels and nZVI is more efficient using a BSE detector and EDS microanalysis. Indeed, a gold coating layer (available on the cryo-SEM chamber of this SEM) could be a problem for applying EDS analysis for the identification of gold nanoparticles (from lectin–gold labeling) as well as the location of lectin–gold labeling and nZVI. This therefore required the use of a variable pressure SEM.
Biofilms grown on sand grains, put in contact with nZVI and then observed by cryo-SEM, are presented on Figure 4. SE image clearly shows the presence of a biofilm on the sand grain, and the interaction of nZVI with bacteria. EDS analysis was used to confirm the aggregates were nZVI and not ice. Sand grains are millimeter-sized and thus cannot be observed at this scale (view field 25.3 µm maximum). It appears that nZVI remained aggregated and did not disperse in the biofilm. This observation could indicate that the biofilm/nZVI interactions would be limited due to a small contact area.

Figure 4 Cryo-scanning electron microscopy (SEM) observation of a biofilm growth on a sand grain in the presence of nZVI (SE imaging, T=−50°C/P nitrogen=80 Pa) – red dotted arrow: bacteria/yellow dashed arrow: nZVI.
Only a few bacteria were visible on the sand grain surfaces in the cryo-SEM images (Fig. 4). When observed as floc (Figs. 5a–5d), the biofilm mainly consisted of a dense network of connected forms but without having the characteristics of distinguished single cells (Figs. 5b–5c). Figure 5d presents an accumulation of nZVI attached to the biofilm. nZVI was identified by SE and BSE imaging and EDS analysis (EDS spectra not shown) on the Tescan SEM. nZVI was identified on the Hitachi SEM by their size and shape – in comparison with images of nZVI collected on the Tescan SEM. The main hypothesis is that these forms are bacteria embedded in an EPS matrix, and are not really visible for this reason. Cutting slices of the biofilm for TEM/STEM observation can reveal further morphological information useful to the understanding of biofilm organization/composition and interactions with nZVI.
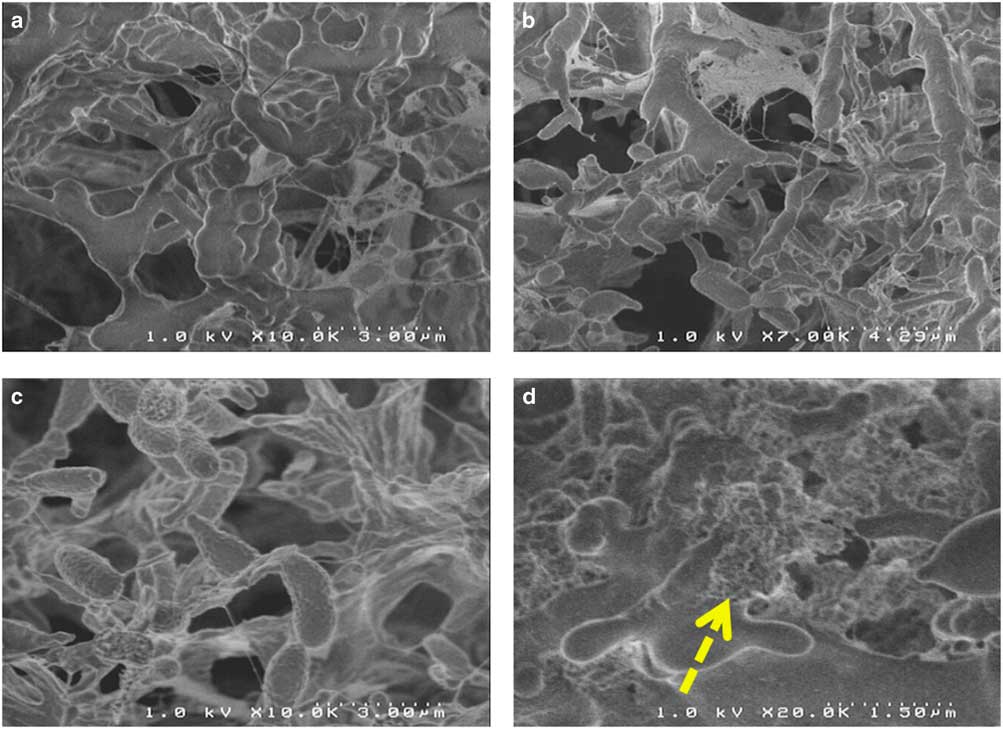
Figure 5 Cryo-scanning electron microscopy observations of biofilms. a,b,c: Flocs without nZVI; (d) flocs with nZVI (yellow dashed arrow).
STEM-in-SEM and (S)TEM (in TEM)
General remarks
By using the transmission mode in a SEM (STEM or STEM-in-SEM) performed in a SEM at 30 kV, both contrast and resolution are improved due to the lower accelerating voltage (compared with conventional TEM/STEM at, say 80 kV), which increases the cross-sections and reduces the interaction volume of the incident electron beam (Golla-Schindler, Reference Golla-Schindler2004; Tracy & Alberi, Reference Tracy and Alberi2004). High contrast of images from STEM-in-SEM results from the use of low voltages. On the other hand, high resolution is available thanks to limited interaction volume and low chromatic aberration (Bogner et al., Reference Bogner, Jouneau, Thollet, Basset and Gauthier2007). In addition to the flexibility of SEM for nanometric resolution imaging, ease of use compared with TEM allows to extend the usefulness and capabilities of the SEM. However, the imaging resolution is ultimately limited by the spatial broadening of the electron probe at the exit surface of the sample (Golla-Schindler, Reference Golla-Schindler2004). STEM-in-SEM is well suited to the observation of low-Z samples (Brown & Westwood, Reference Brown and Westwood2003; Barkay et al., Reference Barkay, Rivkin and Margalit2009; Guise et al., Reference Guise, Strom and Preschilla2011). However, the sample is thin, so the analyzed volume is highly reduced. Moreover, EDS geometry in the SEM is often not optimized for EDS analysis while using the STEM detector, on thin TEM-type samples. The collection solid angle is low, from a few millisteradian (msrad) to a few tens of msrad (except for special flat detectors positioned under the SEM pole piece). For example, for the EDS system on Tescan SEM, the solid angle is 5 msrad (with a detection area of 10 mm2). As a result, mapping on thin samples observed by STEM-in-SEM is difficult and requires long collection periods, which can cause problems at high magnification, due to stage drift. Another problem is the signal collection from the support and/or detecting diodes of the STEM detector of the SEM (e.g., a noticeable signal from Ti is observed in EDS spectra collected while using the STEM detector in the Mira, due to the sample holder of that detector). TEM EDS systems have been optimized over time and in particular, recent “large solid angle” EDS detectors have markedly increased the EDS efficiency (e.g., the JEOL Centurio detector on the system used in this study has a solid angle of 0.98 srad).
STEM-in-SEM has been applied successfully on TEM thin samples of biological samples (García-Negrete et al., Reference García-Negrete, Jiménez de Haro, Blasco, Soto and Fernández2015; Ferroni et al., Reference Ferroni, Signoroni, Sanzogni, Masini, Migliori, Ortolani, Pezza and Morandi2016), but to the authors knowledge, no application of STEM-in-SEM on biofilms has, hitherto, been reported in literature.
Influence of sample preparation
The electron microscopy observations [SEM, STEM-in-SEM, (S)TEM (in TEM)] of bio-mineral interfaces is challenged by sample preparation. For biological samples alone (without a solid growth substratum), several preparation, and observation methods have already been developed and evaluated (Lane, Reference Lane1970; Alhede et al., Reference Alhede, Qvortrup, Liebrechts, Høiby, Givskov and Bjarnsholt2012; Karcz et al., Reference Karcz, Bernas, Nowak, Talik and Woznica2012). High-vacuum SEM observation of biological samples, especially biofilms, is limited by the requirement of sample dehydration during preparation. SEM requires a complex and multi-step preparation which involves fixation, dehydration, drying, and coating with metal or carbon. A prefixation step involving incubation with glutaraldehyde in cacodylate buffer may also be necessary for samples that cannot undergo the fixation step immediately after sampling. This is the case for biofilms sampled in the field. All these steps may inflict damage to samples and morphological information can be altered, as, for instance, hydrated biofilms subjected to glutaraldehyde fixation and postfixation (osmium tetroxide), followed by ethanol or acetone dehydration, critical-point drying, and metal coating. The fixation with crosslinking agents (i.e., glutaraldehyde fixation) is used to stabilize the network structure of the biofilm. This step, together with the postfixation, is designed to prevent breakdown of biological structures. However, in some cases, swelling or shrinkage at the same time has been reported by some authors (Karcz et al., Reference Karcz, Bernas, Nowak, Talik and Woznica2012). Alternative methods have been applied, such as environmental scanning electron microscopy (ESEM; Stokes, Reference Stokes2008) and cryo-SEM. ESEM is an effective technique for imaging hydrated bacterial biofilms by preserving the EPS component without introducing common SEM chemical preparation artifacts. It is based on the application of differential-pumping systems and pressure-limiting apertures, which enables the introduction of gases (e.g., water vapor) into the specimen chamber at quasi-ambient pressure (5–20 Torr). ESEM has been applied successfully for the study of biofilms without the artifacts introduced by chemical preparation for conventional SEM (Little et al., Reference Little, Wagner, Ray, Pope and Scheetz1991; Priester et al., Reference Priester, Horst, Van De Werfhorst, Saleta, Mertes and Holden2007) and provides accurate images of humid biological samples without any preparation, and may also allow EDS microanalysis. However, Egerton-Warburton & Griffin (Reference Egerton-Warburton and Griffin1994) have noticed some variations in the anion content during ESEM analysis, this phenomenon has been attributed by these authors to interactions between anions and electrons in the interaction volume, and possible dehydration effects. Alternatively, cryo-SEM is the combination of high-vacuum or variable pressure SEM coupled to a cryo-stage for the observation of frozen samples by maintaining water in a quasi-stable solid state. This technique preserves the integrity of the biofilm structure, and fewer artifacts are noticed compared with dehydration–fixation techniques (Richard & Turner, Reference Richard and Turner1984). The main artifact noticed in this technique is the potential presence of a thin layer of ice formed during sample transfer that can be removed by a controlled preobservation step (temporary elevation of temperature to sublimate the superficial ice in the preparation chamber or the SEM chamber). Another artifact introduced to samples during freezing is the formation of ice crystals, when the freezing rate is too slow. For this reason, specific techniques such as plunge freezing and high-pressure freezing were developed (Moor et al., Reference Moor, Bellin, Sandri and Akert1980). Cryo-SEM techniques allow fractionation and/or metal coating of the sample inside the preparation chamber. Cryo-fractionation is a good way to access the interior of the biofilm (visualization of the EPS network).
Commercial Cryo-STEM-in-SEM detectors are not available and, to date, only “home-made” solutions exist, and consequently STEM-in-SEM observation requires chemical sample preparation (Dobberstein et al., Reference Dobberstein, Duan, Skepper and Hayles2006; Robins, Reference Robins2015).
Influence of accelerating voltage
STEM observations were performed between 10 and 30 kV on a dozen microtome sections of each sample. However, it appears that such biological samples are very sensitive to carbon contamination. Contamination is particularly visible in STEM imaging at low voltage (10 kV or less), compared with higher voltage (20–30 kV) that were thus chosen for STEM imaging in this study (data not shown). Then it is necessary to set up the SEM (focus, stigmatism …) next to the area of interest (by using beam shift, for example) before any image collection. Moreover, STEM resolution was strongly affected by accelerating voltage. Monte-Carlo simulations (CASINO 2.48 software; Drouin et al., Reference Drouin, Couture, Joly, Tastet, Aimez and Gauvin2007) were performed on thin samples (carbon sample, 80 nm, 2000 electron trajectories, beam radius 10 nm) at 5, 15, and 25 kV and compared with STEM BF/DF images obtained on the same area on one biofilm floc sample under the same imaging conditions (accelerating voltage, beam width) (Fig. 6). These simulations show the influence of the accelerating voltage on the STEM-in-SEM resolution and enabled comparison of the STEM-DF images obtained from the same area on one biofilm sample at these accelerating voltage conditions. Due to the low mean Z of the biological sample (composed mainly of carbon, hydrogen, nitrogen, oxygen), most of the electrons are transmitted with little or no energy loss at high accelerating voltage, but the dispersion of the electron trajectories increased strongly when lowering the high voltage. This effect provides an increase of the image contrast, as does the addition of osmium tetroxide as a contrasting agent for cell membranes during sample preparation. An accelerating voltage of 30 kV was chosen because it provided the best resolution and good contrast in STEM-in-SEM on biological samples.
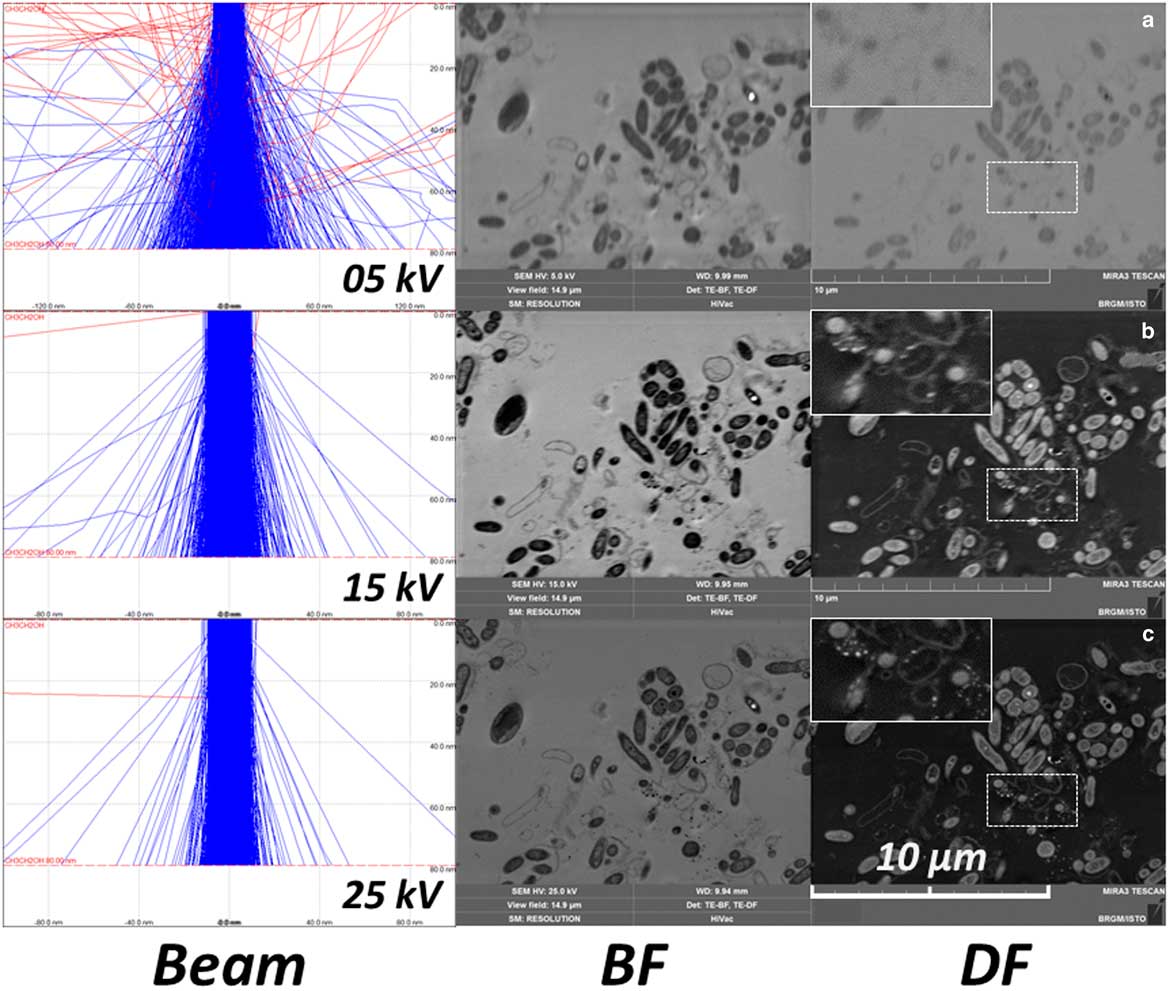
Figure 6 Monte-Carlo simulation of the beam dispersion on a carbon samples (thickness 80 nm, 2000 electrons, beam radius 10 nm) at (a) 5, (b) 15, and (c) 25 kV, and bright field (BF)/dark field (DF) images of a biofilm in the same conditions – detail (white rectangle) is a magnified view of the dotted white rectangle.
Imaging with STEM-in-SEM
STEM in the SEM offers the ability to simultaneously collect images using the STEM, SE, and BSE detectors. This combination of detectors is a great advantage for the discrimination of contrasts in the STEM-DF/BF images. An example of STEM-in-SEM observation (DF, BF) of the same area of a biofilm (an 80 nm microtomic section of a resin embedded biofilm floc sample) is presented in Figure 7, and compared with BSE and SE images (all images were simultaneously collected). Some bright particles are clearly visible in BF or DF images (with reverse contrast in the other). Due to the origin of contrast in STEM images, these bright particles can only be associated to a difference in composition or to diffraction contrast. BSE images of these particles can be used to discriminate between a strong diffraction contrast and high Z. SE image contrast was weak, no contrast was observed using this detector. This can be explained by an absence of topography and a very low difference in mean atomic Z which contributes a little to the signal detected by the SE detector. On this image, bright particles observed on the BSE image, together with DF images, were analyzed by EDS point analysis (on STEM-in-SEM—data not shown) and mapping (on STEM in TEM) (Fig. 8). The particles were composed of calcium and phosphorus.
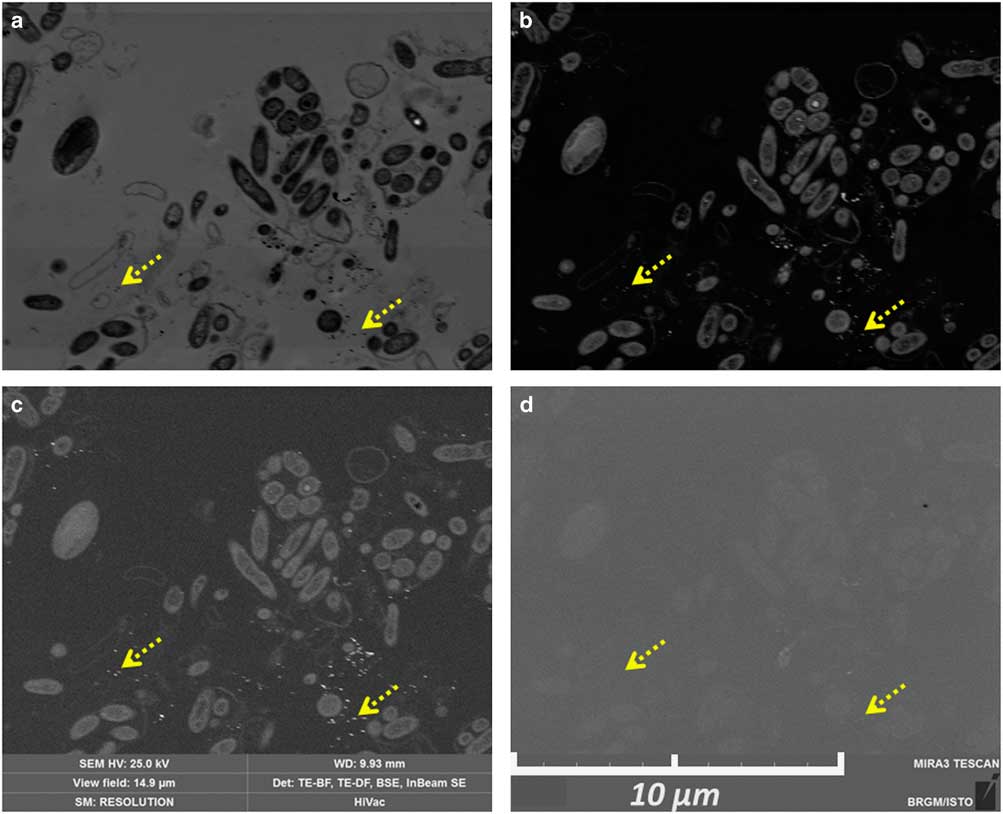
Figure 7 Observation by scanning transmission electron microscopy (STEM)-in-scanning electron microscopy (Tescan Mira) of a biofilm (80 nm microtomic section of a resin-embedded biofilm previously attached to the polyvinyl chloride tube). a: STEM bright field; (b) STEM dark field; (c) backscattered electron detector; (d) SE detector. Yellow dotted arrows indicate gold labeling on the same area.
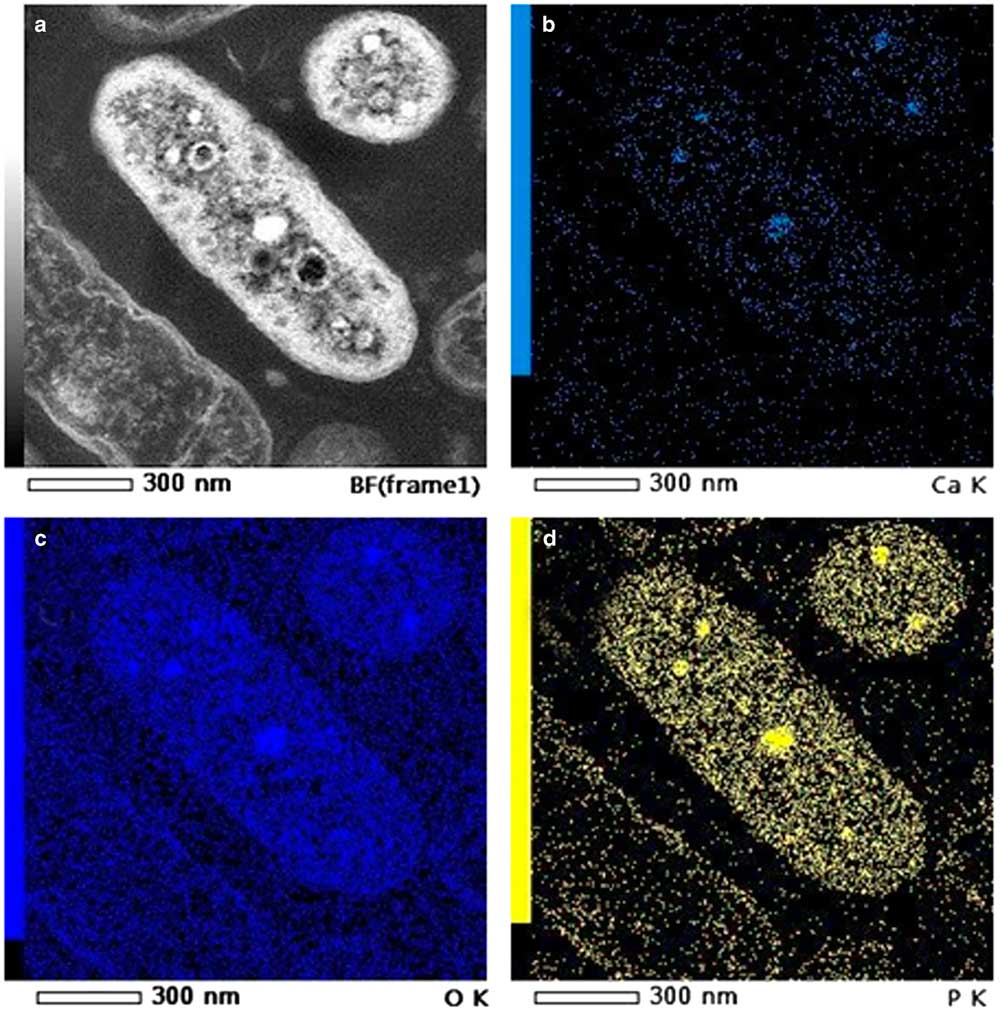
Figure 8 Energy dispersive X-ray spectrometry mapping on a bacteria (TEM 80 kV – JEOL ARM): (a) Scanning transmission electron microscopy-bright field; (b) calcium Kα; (c) oxygen Kα; (d) phosphorus Kα.
A comparison of TEM (Philips CM20 – 120 kV) and STEM-in-SEM (Tescan Mira – 30 kV) was performed. An example is presented in Figure 9. The SEM resolution was clearly acceptable for biological sample observation at this scale: cells can be easily distinguished (including details of membranes or cells or other nanometric details). Combined with other SEM detectors, it appears to be a great advantage for the study of microorganism–mineral interfaces. In addition, the use of STEM-in-SEM enables easy access with a continuous magnification and a high image resolution from very low magnification (i.e., millimetric scale, e.g., search of regions of interest) to high magnification (i.e., nanometric scale) images (Fig. 10). One can also notice the ease of use of the SEM when acquiring a large field of view compared with TEM. In STEM-in-SEM, it is not necessary to change magnification mode, as in the TEM, camera mode or type (say, high-resolution on-axis camera to side mount (“35 mm port”) large-field-of-view camera) and there is high contrast for samples with low contrast between phases (Guise et al., Reference Guise, Strom and Preschilla2011). As an example, the same area of an 80 nm section of the biofilm observed by STEM-DF is presented in Figure 10 at low (Fig. 10a), medium (Fig. 10b), and high (Fig. 10c) magnification. STEM-in-SEM images (Tescan Mira; Fig. 10d) show bacteria surrounded by gold labeling (yellow dotted arrows) and nZVI (red dashed arrows). Figure 11 shows STEM-DF (in TEM, JEOL ARM) images of gold labeling (Fig. 11a) and nZVI (Fig. 11b). Lectin–gold (here as ConA-Au and PNA-Au) labeling and nZVI can be easily differentiated by their size.
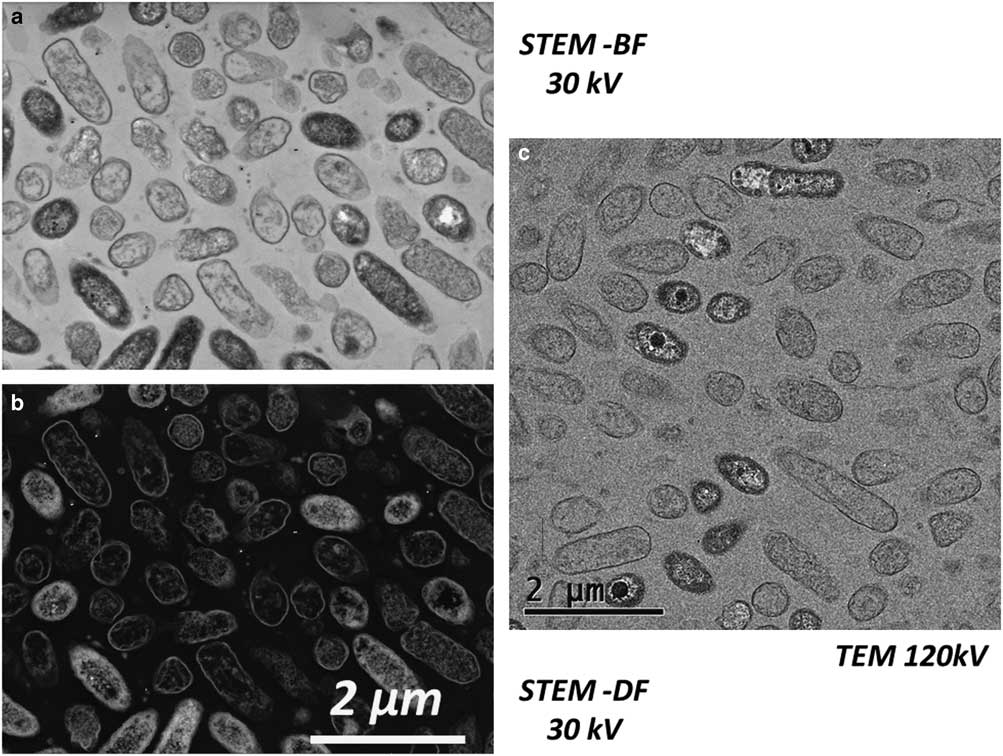
Figure 9 Comparison of scanning transmission electron microscopy (STEM)-in-scanning electron microscopy (Tescan Mira) at 30 kV and transmission electron microscopy (TEM) (Philips CM20) at 120 kV. a: STEM-bright field 30 kV; (b) STEM-dark field 30 kV; (c) TEM 120 kV (80 nm microtomic section of a resin-embedded biofilm floc sample).
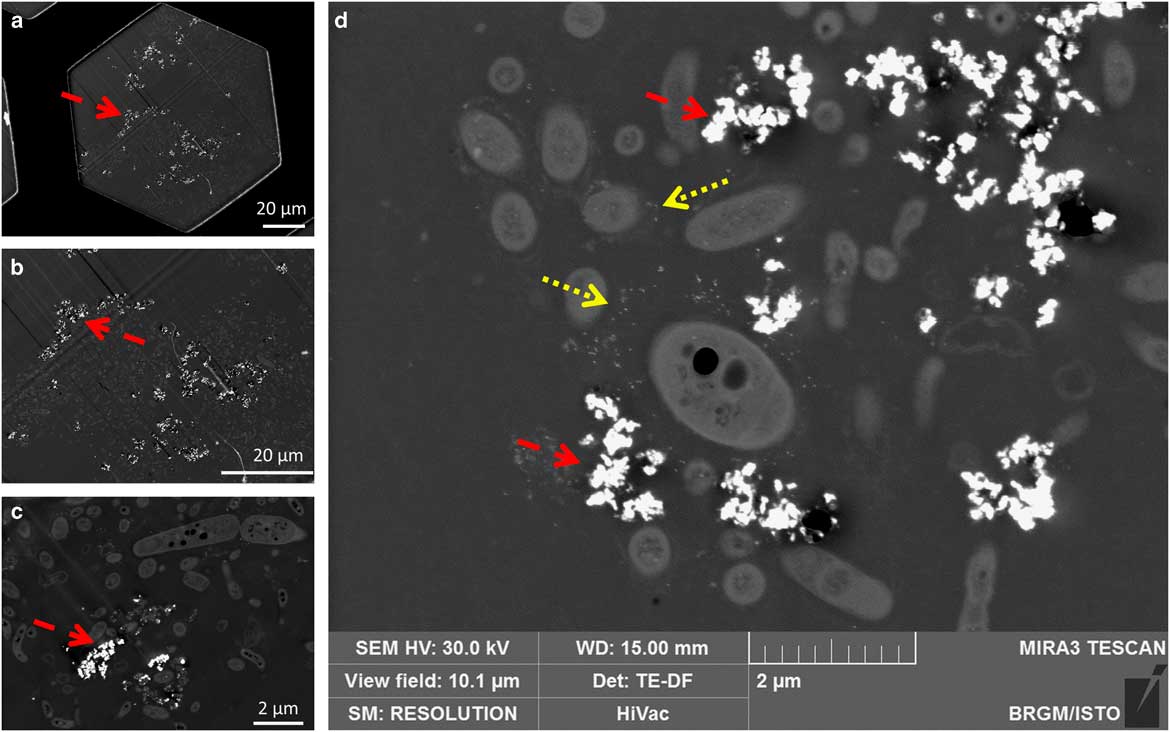
Figure 10 Distribution of nZVI (dashed red arrows) and EPS gold labeling (dotted yellow arrows) in a biofilm by scanning transmission electron microscopy-in-scanning electron microscopy (Tescan Mira): a: view field 148 µm (a complete grid hole); (b) 67.8 µm; (c) 12.6 µm; (d) 10.1 µm (a, b, c: images from the same area, d: images from a different area).
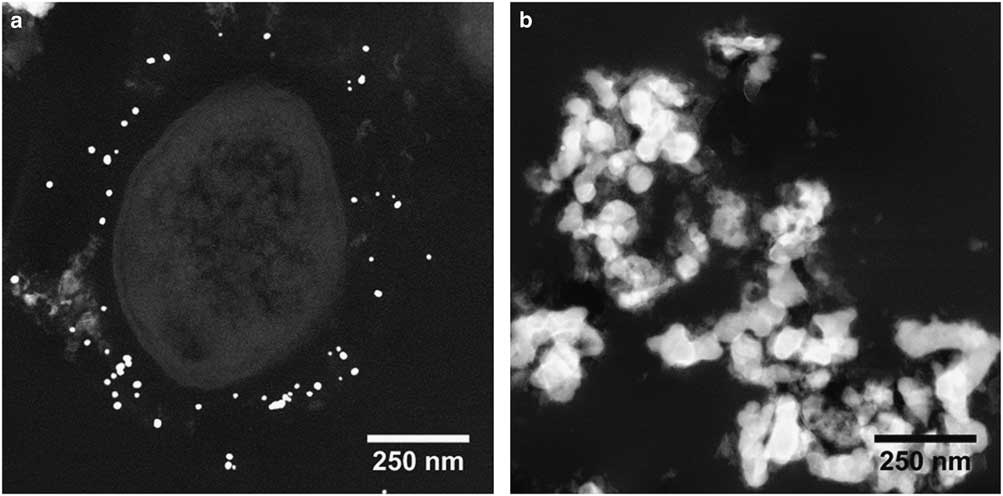
Figure 11 Differentiation of lectin (PNA and ConA)-Au labeling and nZVI by their size (scanning transmission electron microscopy – JEOL ARM200).
nZVI interaction with biofilm
Observations at high magnifications on transversal sections of the biofilm (perpendicular to the internal tube surface) were used to precisely observe the interaction between bacteria and nZVI (Fig. 10d). Lectin–gold labeling and nZVI are clearly distinguished because of their composition (Au versus Fe; EDS) and their difference in size (STEM-DF). Gold labeling appeared everywhere in the biofilm (around cells and in intercellular spaces—Figs. 7a–7c, yellow dotted arrows). However, no labeling was observed in contact with the membrane of the bacteria, but surrounded the cells at a distance of ~0.2–0.5 µm. This suggested that the targeted EPS were mainly capsular type EPS. nZVI were only present on or close to the surface of the biofilm. As with gold labeling, no nZVI were in direct contact with bacteria, which suggested that EPS formed a protective layer around them. No nZVI interactions with cell wall/membrane or intracellular nZVI were thus observed. This is in contradiction with previous studies on biofilms with silver zero-valent nanoparticles (nZVAg) that showed the nanoparticles closely associated with the bacterial cell surface with apparent invagination of the cell wall/membrane, as well as an intracellular location (Fabrega et al., Reference Fabrega, Renshaw and Lead2009). This could be potentially explained by the specific physical and chemical properties of each nanoparticle that would thus influence nanoparticle/biofilm interactions (Peulen & Wilkinson, Reference Peulen and Wilkinson2011). The fact that, in our study, nZVI did not directly interact with cells could potentially lead to a less toxic effect of nZVI on biofilms compared with those described for nZVAg (Choi et al., Reference Choi, Yu, Fernandez and Hu2010; Peulen & Wilkinson, Reference Peulen and Wilkinson2011; Mallerve et al., Reference Mallerve, Fernandes and Aspray2016). nZVI were found as aggregates embedded in the biofilm structure and located on the outside of the biofilm in contact with the medium. This is in agreement with results obtained by Choi et al. (Reference Choi, Yu, Fernandez and Hu2010), who showed that nZVAg aggregated with an average size of about 800 nm could penetrate to ~40 µm in a thick biofilm after 1h exposure. In our study, nZVI aggregates were bigger in size (about 1–5 µm). This could explain the shorter distance of nZVI aggregates penetration [7–11 µm in this study compared with 40 µm in the study of Choi et al. (Reference Choi, Yu, Fernandez and Hu2010)].
Using STEM-in-SEM imaging only, it was not possible to conclude—or exclude—a co-location of nZVI and gold labeling, that is, a connection and an interaction between nZVI and EPS. For this, elemental mapping appeared to be difficult or impossible due to the low gold content. EDS and/or electron energy loss spectroscopy (EELS) in the TEM are required for such analyses.
The presence of gold labeling together with nZVI was confirmed by EDS spectra (not shown) and mapping on Fe and Au on a nZVI aggregate in the JEOL ARM200 (Fig. 12). This co-location Fe/Au suggests an interaction between nZVI and EPS. Moreover, these results confirm that EPS are also present in intercellular spaces inside the biofilm. As in previous studies, this work underlined the role of EPS in nanoparticles/biofilm interaction (Moreau et al., Reference Moreau, Weber, Martin, Gilbert, Hutcheon and Banfield2007; Peulen & Wilkinson, Reference Peulen and Wilkinson2011). Here, the role of EPS labeled by lectins ConA and PNA was confirmed, but the presence and the role in nanoparticle interactions with other extracellular components, such as exopolysaccharides nontargeted by the two tested lectins or extracellular protein or DNA, can, of course, not be excluded. As an example, Moreau et al. (Reference Moreau, Weber, Martin, Gilbert, Hutcheon and Banfield2007) demonstrated the role of extracellular proteins. No, or very few, individual iron particles were detected. It also suggests that nZVI were present in the biofilm as aggregates in contact with EPS, but not directly with bacteria. It also confirms that no direct interaction between nZVI and microorganisms can be considered, because of the presence of a thick layer of EPS surrounding the bacteria. Biofilm/EPS composition thus plays an important role in biofilm/nanoparticle interactions, as well as biofilm structure. In particular, density of both exopolymers and bacteria has been demonstrated to be an important parameter controlling the diffusion of nanoparticles inside the biofilm (Peulen & Wilkinson, Reference Peulen and Wilkinson2011). Growth conditions that can influence biofilm density could thus influence biofilm/nanoparticle interactions (Peulen & Wilkinson, Reference Peulen and Wilkinson2011). In general terms, diffusion in a biofilm has been shown to be reduced due to the presence of microbial cells, extracellular polymers, and abiotic particles or gas bubbles that are trapped in the biofilm (Stewart, Reference Stewart2003). Bacterial cell wall hydrophobicity was also demonstrated to play a role in the diffusion of nanoparticles in biofilms (Habimana et al., Reference Habimana, Steenkeste, Fontaine-Aupart, Bellon-Fontaine, Kulakauskas and Brandet2011). In this study, TEM observations coupled to lectin labeling suggested that our biofilm was quite dense in terms of cells and EPS concentrations. In addition to the nanoparticle (NP)/EPS interaction suggested by our results, the high EPS/bacteria density could also explain that nZVI did not diffuse into the overall biofilm. Last, it can be hypothesized that even if the biofilm is very porous, the size of nZVI aggregates observed in biofilms is so big that the biofilm pores are rapidly plugged by the aggregates, thus preventing them from further entering the biofilm structure.

Figure 12 nZVI and lectin (PNA and ConA)-Au labeling co-location: Scanning transmission electron microscopy (JEOL ARM200) [(a) bright field, (b) dark field] and energy dispersive X-ray spectrometry mapping [(c) Fe Kα and (d) Au Lα].
Advantages and drawbacks of the tested microscopy methods for biofilm/nZVI observation studies
A comparison of the advantages and drawbacks of the microscopy methods applied to the study of biofilms/nZVI interaction are summarized in Table 2. Our results show that coupling EDS analysis with fluorescent, SEM and TEM microscopy techniques offers the possibility to access the inside and outside of the biofilm and thus enables biofilm/nZVI characterization at (i) the biofilm level, with the location and nature of nZVI (here as aggregates) at the surface of the biofilm structure, (ii) the cell level with the absence of cells/nZVI interaction, and (iii) the molecular level with the lectin labeling strongly suggesting a major role of EPS in nZVI/biofilm interaction. Moreover, the present study demonstrated that the three microscopy methods used are complementary approaches for a complete study of biofilm/nZVI interactions.
Each microscopy technique has its advantages and drawbacks that can be bypassed by the use of other techniques (Table 2). Moreover, preparing biofilm samples for accurate observations, especially when interacting with sand or metal elements such as nZVI, can prove difficult without modifying their structure. Many studies have been carried out using biofilms developed on a smooth surface (glass or flow cell experiments) and protocols that are developed are thus not applicable to most biofilms/substrata directly taken from the environment. Working with flocs using fluorescent microscopy is also not easy. Indeed, samples are thick and water rich (compared with biofilm grown on a substratum). Observation of flocs between slide and cover slide can result to the flocs moving during analysis (because of the presence of water inside the sample), and the thickness makes fluorescence detection in the deeper zones of the biofilm possible, thus leading to fluorescence that is out of focus. The coupling of several approaches in microscopy is thus an obligate approach and the best route to study biofilm/NP interaction with biofilms still attached to a “natural” substratum (sand grains in this study) that are usually porous, not flat, voluminous, and impossible to section.
Conclusion
Understanding biofilm organization and interactions with surrounding substratum and pollutants or particles can benefit from the array of existing microscopy tools such as fluorescent microscopy, cryo-SEM, STEM-in-SEM or (S)TEM (in TEM), and EDS. Microscopy is indeed a very powerful approach to characterize biofilms and has previously been used to study biofilm/nZVI interaction.
Cryo-SEM samples exhibited a low number of bacteria visible in the biofilm, but showed rather a network with forms whose shape and size are similar to that of bacteria. We suggested that these forms may be bacteria embedded in an EPS network, as was shown by lectin labeling. This hypothesis was confirmed by STEM-in-SEM observations on the microtome sections of the biofilm with lectin–gold labeling for EPS detection, which showed that the bacteria were encapsulated in a matrix of EPS. STEM-in-SEM analyses also showed nZVI aggregates on or near the surface (up to 10 µm) of the biofilm, but not in direct contact with bacteria. Complementary (S)TEM (in TEM)/EDS analysis also revealed that nZVI are connected to the EPS matrix, as confirmed by EDS mapping of gold and iron which exhibit co-location of lectin–gold (EPS markers) with iron aggregates. Then, the combination of fluorescent microscopy, cryo-SEM and STEM-in-SEM, supplemented by TEM/EDS analysis appeared to be an excellent tool for understanding the biofilm/mineral interface and interaction.
These observations enabled access to the inside and outside of the biofilm at different scales of magnitude, allowing to understand the behavior and the internal structure of biofilms in contact with mineral or metallic particles, and the ability of biofilms to fix nZVI or to bind to sand particles. This approach allows nZVI characterization (in terms of size distribution and aggregation) and location inside the biofilm (intracellular location, association with cells wall/membrane).
Acknowledgments
This work is in the projects BIOMEB and BIOSORP supported by BRGM Research Direction in collaboration with project NANOREM (FP7 2007–2013 Grand agreement No. 309517). The authors gratefully acknowledge the financial support provided to the PIVOTS project by the Région Centre—Val de Loire (ARD 2020 program and CPER 2015–2020) and the French Ministry of Higher Education and Research (CPER 2015–2020 and public service subsidy to Brgm). Cryo-SEM (Hitachi) and TEM (CM20) observations were performed at the Electron Microscopy Center at the University of Orleans (France) by A.R. and A.S.. TEM and STEM preparation were carried out by MRic TEM Biosit electron microscopy platform at the University of Rennes (France). TEM /EDS/EELS (Jeol ARM200F) analysis were performed at the Centre Raymond Castaing (Toulouse, France) and at the demonstration center of JEOL Ltd (Tokyo, Japan).


