


Introduction
The use of solute segregation to grain boundaries (GBs) has been determined to be a means to retard elevated temperature grain growth in nanocrystalline alloys (Chookajorn et al., Reference Chookajorn, Murdoch and Schuh2012; Darling et al., Reference Darling, Rajagopalan, Komarasamy, Bhatia, Hornbuckle, Mishra and Solanki2016). This “nanocrystalline stability” has been explained by both a thermodynamic concept—where the solutes reduce the GB energy—and a kinetic approach—where the solutes provide a velocity drag on the boundary or by creating secondary phase precipitates yielding a Zener pinning effect. To better understand the role of solutes in this stabilization method, characterization methods which enable high spatial and chemical sensitivity are required. Atom probe tomography (APT) provides an ideal microscopy technique to quantify such chemical partitioning effects at these atomistic length scales. However, APT reconstructions often have an associated loss of crystallographic information making analysis more general to microstructural features than specific details associated with those features, such as the GB type. This is because of the oversimplifying assumptions of single field evaporation for reconstruction and limited detection efficiency. Thus, one may know segregation is present but not know how that specifically links to the crystal structure. If such specific information was known, it would provide invaluable inputs to the verification and validation of atomistic models.
To overcome this issue, the use of cross-correlative electron microscopy with APT has been employed by multiple groups (Herbig et al., Reference Herbig, Raabe, Li, Choi, Zaefferer and Goto2014; Zhou et al., Reference Zhou, Yu, Kaub, Martens and Thompson2016). The results of these findings have revealed solute dependent segregation to specific GB types and networks as well as a better understanding of how solutes migrate and partition within microstructures. This includes precipitate formations on GBs and within grains. In this paper, we continue those types of studies as well as extend our investigation to understand how the charge-states of the solute change under field evaporation as a function of solute location within the nanocrystalline alloy.
During field evaporation, the atoms will have specific charge-states that are related to the crystallographic and chemical environments from which they originate. With such information, additional understanding about the solute's behavior can then be learned beyond just its spatially reconstructed location. For example, it has been reported that the field evaporation is linked to bonding behavior in metal alloys (Aruga et al., Reference Aruga, Nako, Tsuneishi, Hasegawa, Tao, Ichihara and Serizawa2013; Peralta et al., Reference Peralta, Broderick and Rajan2013). In the report by Peralta et al. (Reference Peralta, Broderick and Rajan2013), density functional theory simulations were compared with atom probe datasets to understand why multiple events, such as the formation of Al–Sc or Al–Al dimers, occurred. In the Aruga et al.’s (Reference Aruga, Nako, Tsuneishi, Hasegawa, Tao, Ichihara and Serizawa2013) study on the field evaporation of Al, Al–Mg and Al–Ag, the charge-state ratio (CSR) dependency was noted to depend on the evaporation field predicted from the calculated bond energies and measured work functions. Specific to Aruga et al.’s report, calculations revealed a higher evaporation field for the Al–Ag alloy and a lower evaporation field for the Al–Mg alloy as compared to pure Al, indicating that indeed the local chemical coordination environment was essentially affecting aluminum's field strength. We aim to further these types of studies by investigating the experimental charge-states of the field evaporated species in Cu(V) to better understand how the vanadium solute behavior may change as a function of spatial location within the nanocrystalline alloy.
Materials and Methods
The nanocrystalline case study material—Cu–7 at.% V—was deposited by magnetron co-sputtering from 99.95 at.% pure elemental copper and vanadium targets in an AJA ATC-1500 stainless steel chamber. The films were grown to an approximate thickness of 200 nm on 300 µm thick silicon [001] substrates with a 100 nm thick surface oxide between the film and substrate to prevent deleterious chemical reactions during annealing. After deposition, the films were annealed at 400°C in a custom-built vacuum chamber, which had a base pressure of <1 × 10⁻⁴ Pa, for 1 h.
The overall composition and local element distribution were characterized by cross-correlative precession electron diffraction (PED) and APT (Zhou et al., Reference Zhou, Yu, Kaub, Martens and Thompson2016). The required needle-shaped geometry was prepared in cross-section using a focused ion beam lift-out technique and annular milled in a TESCAN LYRA Focus Ion Beam (FIB)-field emission scanning electron microscope. The grain-to-grain mapping of the film was performed by PED using the Nanomegas ASTAR™ platform in an FEI Tecnai F20 scanning transmission electron microscope [S(TEM)] operated at 200 keV. The composition of the specimens was also mapped by energy dispersive X-ray spectroscopy (EDX) in the TEM. After TEM characterization, the specimens were field evaporated in a Cameca Instruments Local Electrode Atom Probe (LEAP™) 5000 XS operated over a range of specimen set points from 25 to 90 K and laser pulse energies between 50 and 200 pJ at a pulse repetition rate of 500 kHz for a 0.2% ions per pulse detection rate. The collected APT data were then reconstructed using the IVAS 3.8.0 software platform.
Results
Mass-Spectrum Analysis
Figure 1 shows a representative APT mass-spectrum for the Cu–7V film annealed at 400°C with the relevant peaks identified. In general, the dominant elemental Cu evaporated species was Cu1+ and CuH21+, with a much lower fraction of Cu2+ ions. Because of peak overlap of Cu1+ and CuH21+ at 65 Da, they are noted together as Cu(H2)1+, as shown in the mass spectrum of Figure 2. We will use this “parenthesis notation” with hydrogen throughout the remainder of the paper in the cases when the metal species is also summed with its metal hydride complex species, i.e., Cu1+ + CuH21+. The elemental vanadium evaporated as V2+, V1+, and VH1+ ions. We did note a very small number of VO2+, V2O2+, and O21+ ions which are associated with vanadium's activity with oxygen and is considered to be an unfortunate contamination effect that occurred during annealing. Regardless of this issue, the vast majority of the collected ions are in the metallic charge-states of the two primary metals with the reported running conditions always showing dominant Cu1+ and V2+ charge-states. The overall composition was measured as 7.12 at.% V and was in close agreement to the targeted Cu–7V. Note that the shaded features in Figure 1 only serve as guide for the eye to identify the peaks and were not the ranges used in either the quantification or reconstruction.
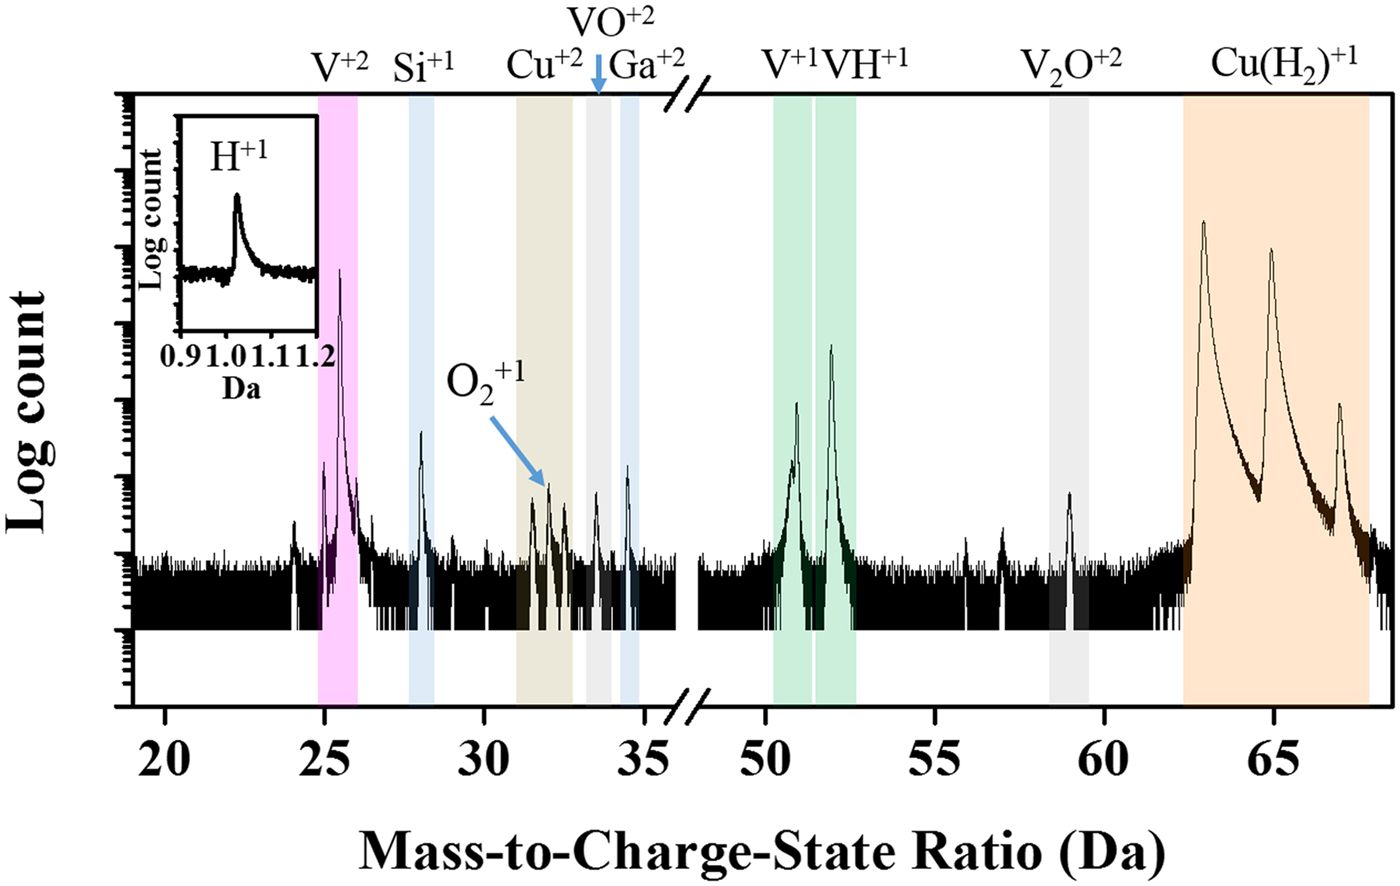
Fig. 1. Mass spectrum analysis for the Cu–7V/400°C film. Spectrum collected at 40 K/100 pJ. The embedded image shows the H1+ peak.
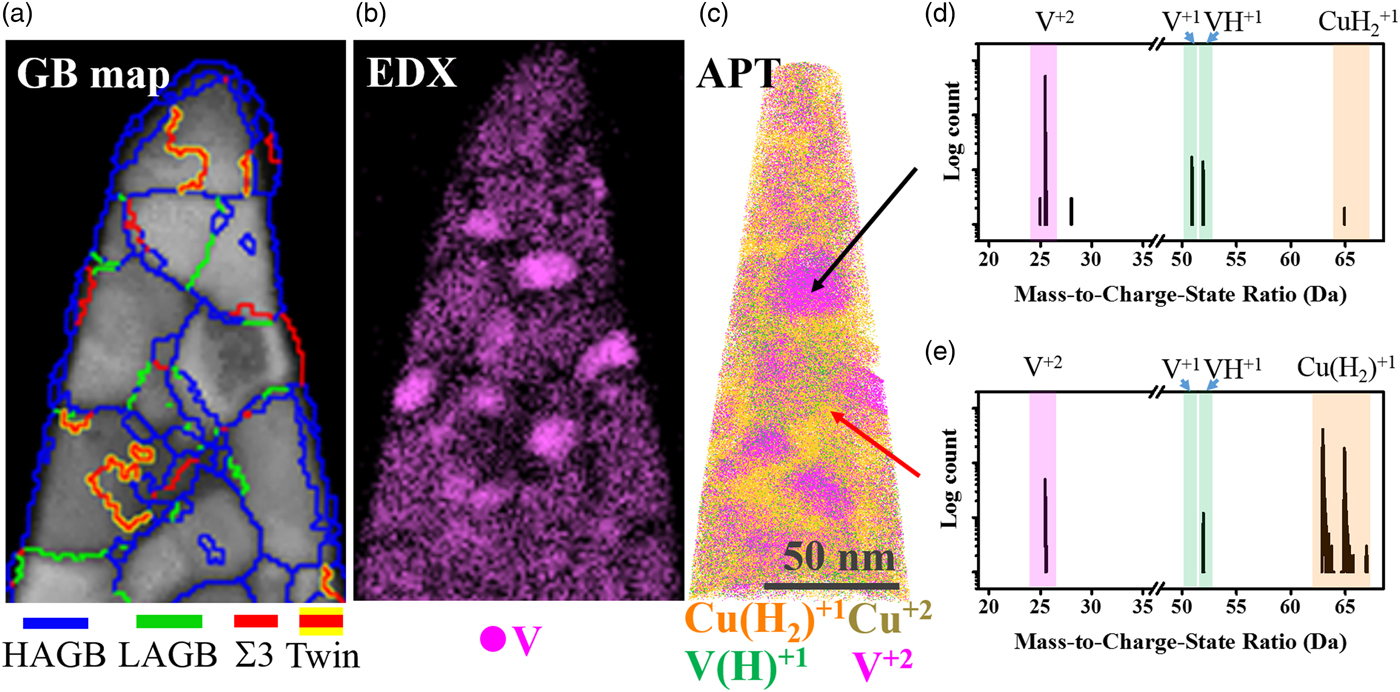
Fig. 2. Cross-correlative study of the Cu–7V/400°C film collected at 40 K/100 pJ. a: The PED GB map, (b) is the EDX map, and (c) is the 3-D APT reconstructions. d, e: The mass spectra from the precipitate region and matrix region under 40 K/100 pJ laser pulsing, respectively.
Cross-Correlative TEM and APT Study
Figure 2 shows the cross-correlative images for the Cu–7V/400°C film. Figure 2(a) shows a GB map of the specimen collected by PED, revealing high angle grain boundaries (HAGBs), low angle grain boundaries (LAGBs), Σ3, and twin boundaries. By comparing the GB map with the EDX map, Figure 2(b), the vanadium appears to have precipitated at the GB triple junctions. Figure 2(c) is the 3D atom probe reconstruction of the same specimen to reveal the vanadium precipitates [designated with the green color, V(H)1+, and purple color, V2+]. Again, the use of parenthesis for hydrogen is to denote that the vanadium metal count is summed together from both the element species, V1+, and the hydride complex, VH1+, as shown in the mass spectrum of Figure 2. The precipitates were spherical and evenly separated, which matched well with the EDX mapping giving confidence in the atom probe reconstruction. The precipitates were also observed only to be on HAGBs. When the film was deposited, it was in a metastable solid solution BCC A2 structure. Upon annealing, the vanadium came out of solution, nucleating, and growing at these boundaries. This is driven by the thermodynamic immiscibility of these two elements (Andersson et al., Reference Andersson, Helander, Hoglund, Shi and Sundman2002). Detailed investigation of the annealing process and subsequent nanocrystalline stability is the subject of another article.
The mass spectrum from the vanadium precipitate region is shown in Figure 2(d). In this vanadium-rich region, V2+, V1+, and VH1+ ions are observed, with a higher fraction of V2+ charge-states (note the log scale). It was also observed (not shown) that the VH1+ ions were qualitatively uniform throughout the V precipitate reconstruction, i.e., there was no obvious spatial preference for the hydride in the V precipitate. Regarding copper in the vanadium precipitate, only CuH21+ peaks (no Cu1+ peak) were observed. The mass spectrum within the matrix region, Figure 2(e), reveals that V2+ is still the highest vanadium peak, but has decreased in height relative to the VH1+ peak. Furthermore, the vanadium solute was detected ~4 times greater as VH1+ than compared to V1+ when in solution with copper. In this same matrix region, Figure 2(e), the Cu1+ was the dominant field evaporated solvent species with minor CuH21+ peaks.
Quantifying the CSR of the Vanadium Precipitates
It is evident from the mass spectrum in Figure 2, which was representative of very similar trends in all other field evaporating conditions, that the V2+/V(H)1+ CSR is dependent on the location where it is measured within the microstructure. Table 1 quantifies this CSR in each of these regions. By being a two-phase structure, we have explicitly defined features where the CSR was taken. This includes the following: the vanadium precipitate surface (which is delineated as the transition region between the matrix and precipitate), the precipitate core (which is where the CSR does not change), the collective precipitate (which is the surface plus core values), and the matrix which is the solid solution of vanadium in copper. For this analysis, we have used the identified vanadium precipitate indicated by the black arrow in Figure 2(c). Finally, the overall CSR for the specimen is tabulated in Table 1 from the total collected mass spectrum which now includes all precipitates and matrix values combined.
Table 1. CSR of V2+/V(H)1+ and V2+/V1+ as well as V Concentrations in Different Regions of the Cu–7V/400°C Film Collected at 40 K/100 pJ.
As noted earlier, a significant amount of hydride ions was observed to exist in the mass spectrum, with the vast majority of these ions within the copper matrix. As a result, Table 1 also includes the CSRs of only the elemental ratio, i.e., V2+/V1+, without considering the VH+ ions in the ratio. In these specific cases, this element only ratio results in quite different values when compared to ratios which include the hydride. For example, the V2+/V1+ CSR was as high as 46.4 while an equivalent region which includes the hydride complex places the V2+/V(H)1+ CSR closer to 3.4. Clearly, the presence of hydrogen has a profound effect on the charge-state evaporation of vanadium in the copper matrix and will be discussed further in the next section.
Along with Table 1, the proxigram for each of these defined features is shown in Figure 3. The 18 at.% vanadium isosurface was used to delineate the precipitate from the matrix. In general, the Cu(H2)1+ charge-state decreases rapidly with the V2+ charge-state, correspondingly increasing as one traverses from the matrix into the precipitate, Figure 3. This can be seen as the V2+/V(H)1+ CSR is 3.4 in the matrix, whereas at the surface of the precipitate this ratio rises to 9.6 and within the precipitate core it is 15.5. Clearly, vanadium has a CSR dependence depending upon which phase its field evaporates from. The lack of copper within this precipitate is associated with the aforementioned immiscibility.
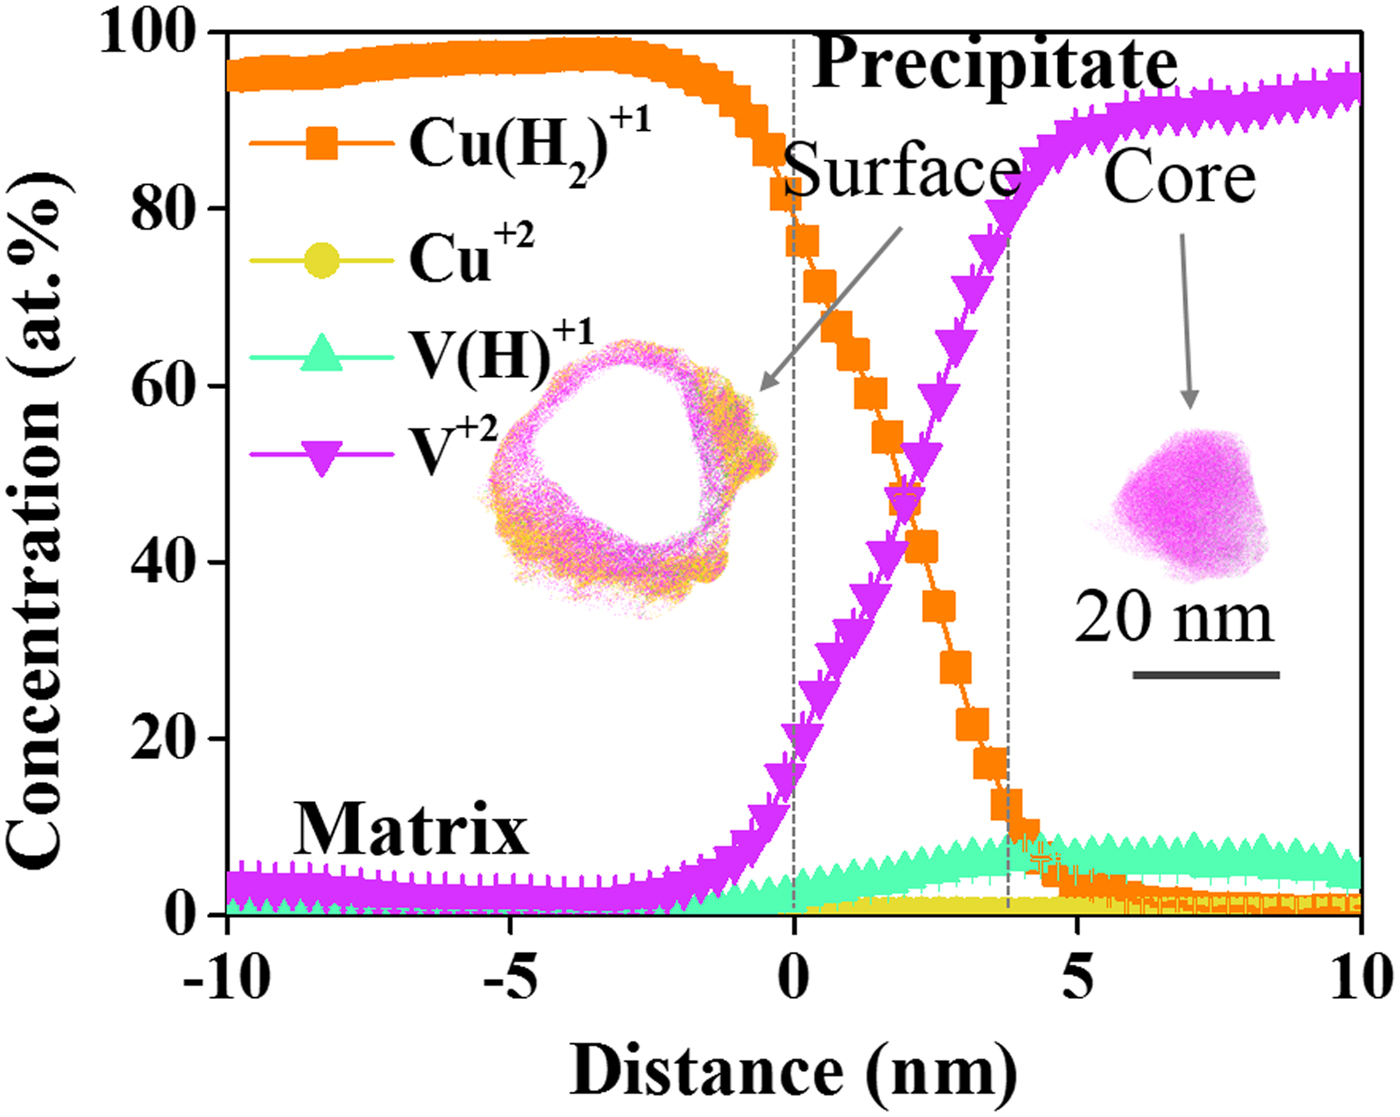
Fig. 3. Proxigram of precipitate found in the Cu–7V/400°C film collected at 40 K/100 pJ. The atom map of the precipitate is included in the figure.
Discussion
To understand the charge-state behavior of the alloy, we will quickly review the underlying physics of charge-state origins and subsequent experiments to better understand that behavior in this alloy. One of the earliest theories to explain field evaporation was proposed by Müller (Reference Müller1956). He suggested that the minimum evaporation field, F en, is given as:
 $$F_{{\rm en}} = \left( {\Lambda + \mathop \sum \limits_i I_i-n\phi} \right)^2/n^3e^3$$
where n is the different charge-states, Λ is an energy corresponding to the binding energy of an atom from its site,  $\sum\nolimits_i {I_i} $ is the summation of energy needed to ionize the atom to an n + ion state, ϕ is the work function, and e is the charge of an electron. From this equation, the different charge-state ions can form under different evaporation fields. From this concept the image-hump model (Müller, Reference Müller1956; Tsong, Reference Tsong1978) and the charge exchange model (Gomer, Reference Gomer1959; Gomer & Swanson, Reference Gomer and Swanson1963) were developed. Though these models have moderate success in predicting evaporation field behavior, they fail to explain the variation of the ion CSR with varying field evaporation conditions. For example, the relative abundance of different charge-states has been reported to be connected to the field strength (Barofsky & Müller, Reference Barofsky and Müller1968). Consequently, Reference Haydock and KinghamHaydock and Kingham developed a post-ionization theory to explain this behavior (Haydock & Kingham, Reference Haydock and Kingham1980). According to their model, in the first stage of evaporation, atoms field evaporate from the surface losing one or more electrons similar to the image-hump model. After reaching a critical distance from the surface, the initial ionized atom may then be post-ionized one or more times via tunneling electrons back to the sample surface. Thus, in their explanation, the number of electrons lost per ion can be explained as a function of the field strength. At a high field, more electrons can tunnel back to the sample resulting in a higher charge-state ion. This implies then that the field at the surface will have a profound effect on the resulting charge-state for an ion coming from that surface.
Using these ideas, Kingham reported the CSRs for elements which can be used to predict their associated field strengths (Kingham, Reference Kingham1982). One should note that Kingham's model for these field strengths is only valid for elemental species and are still rather approximate, with associated errors being upward of 20%. Nonetheless, this model and the values it can provide serve as a guide to understanding the behavior of the species with different charge states. Figure 4 is an adapted field strength plot for vanadium and copper charge-states with these states plotted as a function of field strength (x-axis) and the relative abundance of different charge-states (y-axis). Specifically, the abundance of different charge-states is given as the ratio of n i, the number of ions of charge-state i, divided by the total number of ion charge-states from 1 to k (with k being the highest charge-state considered), given as  $\sum\nolimits_{j = 1}^k {n_j} $.
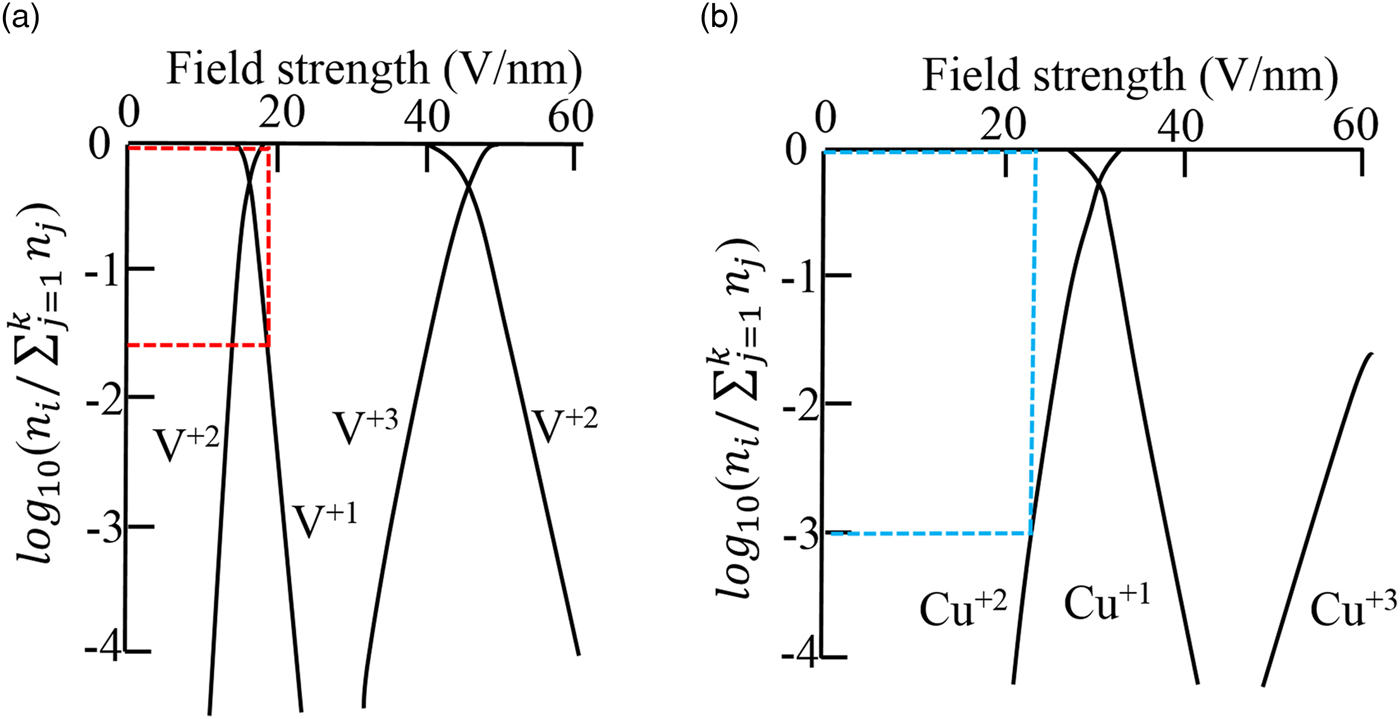
Fig. 4. a, b: were adapted from Kingham (Reference Kingham1982) that show the relative abundance of different charge-states in field evaporation plotted logarithmically against field strength. n i is the number of ions of charge-state i and k is the highest charge-state considered. The red lines in (a) corresponds to the condition that V atoms were evaporated from the precipitates and the blue lines in (b) indicated the condition that Cu atoms were evaporated from the matrix. The Cu–7V/400°C specimen was run at 40 K with a laser energy of 100 pJ.
The presence of the complex metal hydride in our experiments does complicate the use of the CSR from the Kingham diagrams in Figure 4. To be consistent with these diagrams, we have only used the elemental ratios from Table 1. First, consider the vanadium precipitates. Using the core V2+/V1+ ratio, which is ~39, this is plotted as the two red dashed lines in Figure 4(a), with the lower red line corresponding to the V1+ charge-state and the upper red line corresponding to the V2+ charge-state. At the two CSRs, the approximate field is 19 V/nm (Kellogg, Reference Kellogg1981; Kingham, Reference Kingham1982). Similarly, the Cu2+/Cu1+ ratio (albeit the matrix has V in solution with it) was ~0.001 and the corresponding blue dashed lines in Figure 4(b) indicate an approximate field of 23 V/nm (Kingham, Reference Kingham1982). As a side note, the image hump model places the V2+ and Cu1+ charge-states as being equivalent at 30 V/nm (Tsong, Reference Tsong1978). Using the Kingham model as a guide, this difference in the observed CSRs will now be discussed in terms of the following: (1) local magnification effects, (2) field strength, (3) variation as a function of temperature and laser pulsing differences, and (4) grain orientation variation.
Local Magnification Effects
A local magnification effect is normally observed in a reconstructed dataset when the specimen is field evaporated through a two-phase region (Miller & Hetherington, Reference Miller and Hetherington1991). This is manifested physically as a local change in the specimen curvature (Miller & Hetherington, Reference Miller and Hetherington1991; Larson et al., Reference Larson, Prosa, Ulfig, Geiser and Kelly2013b), with the atoms in the reconstruction exhibiting different densities in between the two phases under the single field (e.g., single radius) reconstruction approximation (Larson et al., Reference Larson, Prosa, Ulfig, Geiser and Kelly2013b; Miller & Forbes, Reference Miller and Forbes2014). Upon inspecting the post-field evaporated specimen in Figure 5(a), the specimen surface appears rather uniform; however, some slight perturbations are evident, marked by the black arrows, suggesting that indeed the field strengths are different. In a simulated study of field evaporation, Vurpillot et al. and Larson et al. (Vurpillot et al., Reference Vurpillot, Bostel, Menand and Blavette1999, Reference Vurpillot, Bostel and Blavette2000; Larson et al., Reference Larson, Gault, Geiser, De Geuser and Vurpillot2013a) suggested that even atomic scale morphology changes on the specimen surface could be very crucial in determining the field distribution at the surface, which then influences the local magnification. With these small surface perturbations, coupled with the predicted field strengths by (Kingham, Reference Kingham1982), the two species should exhibit a density variation in the reconstruction.
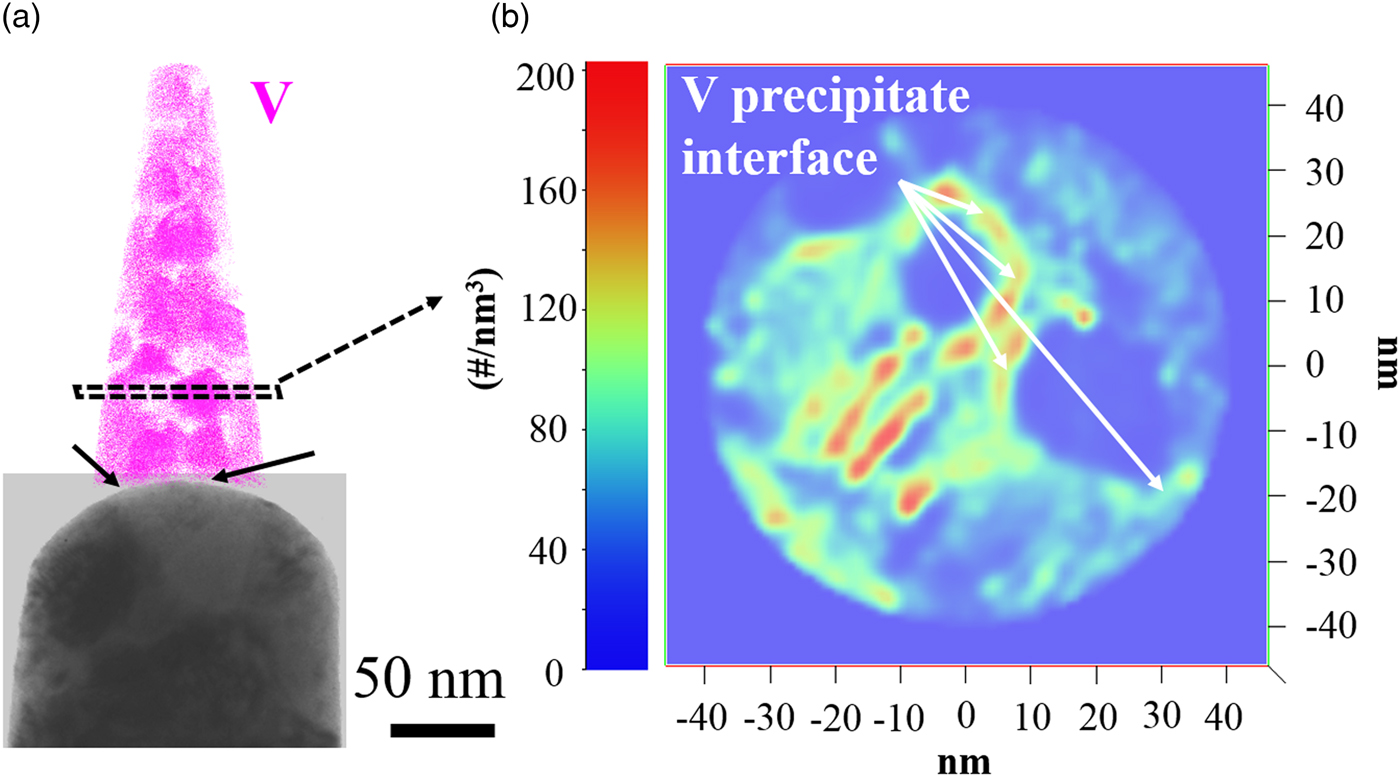
Fig. 5. a: Bright field image post-evaporation for the specimen extracted from the Cu–7V/400°C film collected at 40 K/100 pJ. The V ions map of the atom probe reconstruction was also included. b: 2D density map from the intersection showing in (a).
A 2D density map is shown in Figure 5(b), and was taken in cross-section from the region shown in Figure 5(a). It is apparent in this map that indeed a density variation does exist between the copper-rich and vanadium-rich regimes. The spherical shape of the vanadium precipitates is clearly evident and reveals regions of lower density. In contrast, the regions around these features have a green tint indicating higher density regions. There are even some red highlighted regions situated largely between the two phases and would be the highest density locations for this reconstruction. These high-density regions are an indication of trajectory overlaps from the precipitate and matrix created by geometric effects from the specimen variation as the two-phases field evaporated, but are reconstructed under the single field approximation (Marquis & Hyde, Reference Marquis and Hyde2010; Larson et al., Reference Larson, Geiser, Prosa and Kelly2012).
In a two-phase material, with each phase having a different field strength, under the single field approximation, the lower field phase will reconstruct with a higher density as compared to the higher field phase reconstructing with a lower density (Larson et al., Reference Larson, Gault, Geiser, De Geuser and Vurpillot2013a). Returning to Figure 5(b), the vanadium precipitates appear to be the lower density reconstructed phase as compared to the copper matrix. This would suggest that the vanadium field is larger than that of the copper in this alloy, which is different from the values predicted by the Kingham model (Fig. 4). Though the Kingham model appears to correctly note that a field difference should exist in the alloy, unlike the image hump prediction by Tsong (Reference Tsong1978), its predictions in terms of which element should have a higher field strength are inverted compared to the data seen in this study. Nevertheless, the Kingham model does appear to provide an accurate understanding of multiple charge-state formations post-ionization for each element in its respective phase, the predicted values for the fields appear less reliable in a strict comparison between elements suggesting that more theoretical work is required in this area.
Vanadium's Field Evaporation Behavior in the Copper Matrix
As seen in Figure 3, vanadium shows a pronounced change in its charge-state dependent upon which phase it field evaporates from, i.e., the solid solution matrix or the precipitate. When it is bound with similar vanadium atoms, the preferred charge-state of 2+ is evident, however when it is in solution with copper, the charge-state of 1+ becomes more apparent, all of which is indicated by the CSRs tabulated in Table 1. Using equation (1) as a simple guide, there is a premise that the bond strength, Λ, plays a role in field evaporation and should be a factor for consideration. For copper, the Cu–Cu bond strength is 3.540 eV whereas vanadium's V–V bond strength is 5.300 eV (Shen et al., Reference Shen, Kong, Gong, Lai and Liu2003). These bonding differences would then contribute to some part to the physical origins for different field strengths present for each phase. When vanadium is then in solution with copper, it has been reported to have a bond strength of 3.543 eV (Shen et al., Reference Shen, Kong, Gong, Lai and Liu2003), which is nearly equivalent to the pure copper element state, recall that copper has a preferred 1+ charge-state upon its evaporation. Though this does not specifically indicate that vanadium would also have to be in the same charge-state upon field evaporation, the similar bond strength and chemical coordination environment from which it is being evaporated from should have some influence. As seen experimentally, and in agreement with the Kingham diagram (Fig. 4), vanadium has a preference for a 2+ charge-state, but this is when it field evaporates from its equivalent vanadium chemical structure. Recall that any higher charge-state occurs post-ionization, which is linked to the chemical environment from which the species comes, since an electron must tunnel back to that surface. Recognizing that V1+ is less common, the higher presence of the vanadium hydride in the matrix grains provides insights into the evaporation events of this solute.
Nishikawa and Wada et al. each have reported that hydrogen can reduce the field strengths necessary to field evaporate a species (Nishikawa, Reference Nishikawa1983; Wada et al., Reference Wada, Uemori and Nishikawa1983). As such, this would then assist in the evaporation of the vanadium solute from the solid solution copper matrix, as the vanadium hydride was dominant in this phase, Figure 2(e). It is then likely that the hydrogen atoms were adsorbed on the surface with a strong chemisorption bond [as opposed to adsorption on the more noble copper where molecular hydrogen (H2) physisorbs by a weaker dipole interaction]. The presence of hydrogen adsorption is likely linked to it being a known ultrahigh vacuum contamination gas, that would be present in the atom probe analysis stainless steel chamber. Because of the chemisorption bond between vanadium and hydrogen atoms, there is less bonding available between the vanadium atom and the underlying atoms such that the vanadium hydride should evaporate at a lower field than vanadium. The near absence of a VH2+ peak would further suggest that some molecular VH+ ions may even post-ionize, but were much fewer than the atomic V+ ions seen in the spectra of Figure 1. Upon closer inspection of these peaks, one can even note that the V+ peak has an unusual shape, evident by a tail that moves toward the low mass end instead of the more conventional tail which moves toward the higher mass end. This would suggest that some VH2+ ions decomposed and immediately formed by post-ionization to V+ and H+. This can be confirmed by reviewing the H1+ peak at 1 Da, shown in the embedded image in Figure 1. Here, the H+ ions have a tail toward the higher mass values. Consequently, some of the counts in the V+ peak may actually be from vanadium hydride evaporation rather than from vanadium evaporation. Though other complex species were noted, including oxides, these were not considered to be as significant since they were at least an order of magnitude lower in counts compared to either the elemental or hydride ions. The only exception being when the laser pulse energy was increased which is now discussed below.
Temperature Effects
The field strength to field evaporate a species is known to also be a function of the temperature (Kellogg, Reference Kellogg1981), where a laser can yield a range of CSRs with changes in laser pulse energies (Marquis & Gault, Reference Marquis and Gault2008). Though one would ideally prefer to study CSRs by field evaporating in a voltage mode (where a fixed set point temperature exists), it was found that for this alloy, voltage pulsing was unsuitable. More than ten specimens (with specimen temperatures at either 40 or 90 K) were run, but only the 90 K set point specimens could yield a reasonable dataset of approximately 1 million atoms before fracturing. In comparison, the laser pulse runs would typically be 50 million atoms and the runs were intentionally concluded. Furthermore, the full width at half maximum mass resolving power (MRP) of the V2+ charge-state for the voltage run was 91, which was nearly ten times smaller than the specimen running with the 100 pJ laser energy with its value of 820, Figure 6(a).
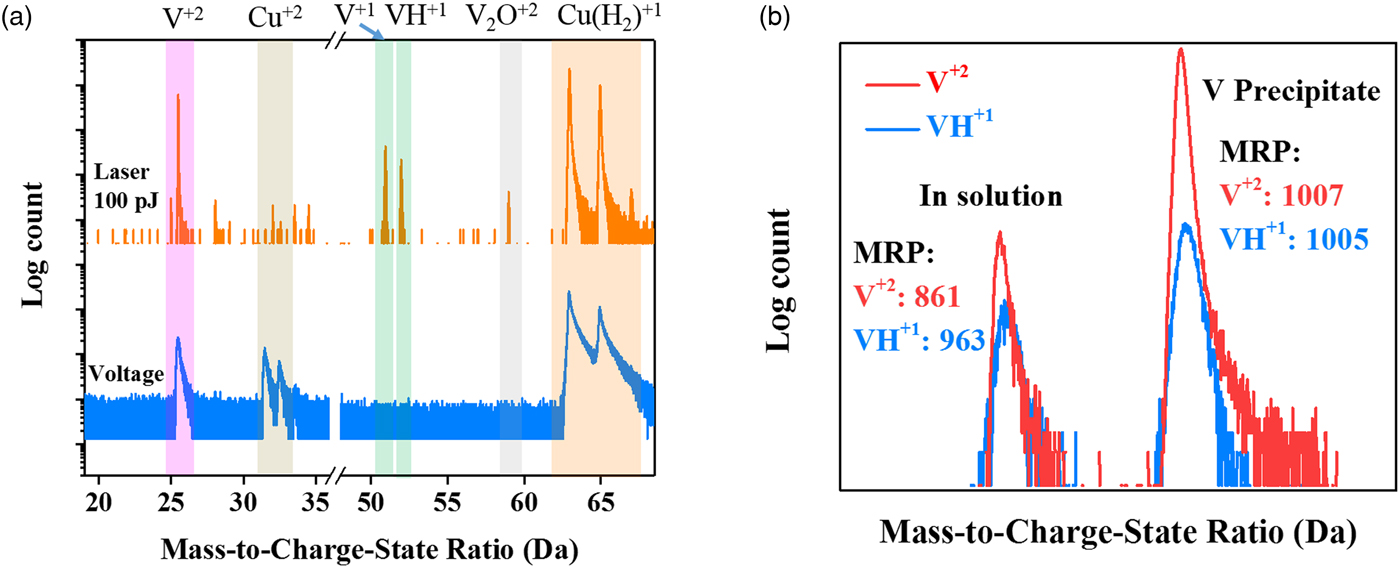
Fig. 6. a: Mass spectra analysis for the Cu–7V/400°C specimens with the set point temperature being 90 K and a 0.2% detection rate for a laser pulse run at 100 pJ and a voltage mode run. Both spectra contain approximately 1 million ions. b: Representative mass spectra from the volumes found in the solution and in the V precipitate in the Cu–7V/400°C film collected at 40 K/100 pJ, respectively. The V2+ peaks have been shifted to show together with VH1+ peaks.
Since the laser mode will contribute heat that assists in the evaporation, the thermal properties of the material need to be considered. At room temperature, the thermal conductivity of copper, k Cu, is ~400 W/m K whereas vanadium's k V is ~31 W/m K (Kittel, Reference Kittel2005). As the temperature dropped below 100 K, the thermal conductivities of both metals will increase with copper being approximately one order of magnitude higher in its value than vanadium (Berman & MacDonald, Reference Berman and MacDonald1952; Jung et al., Reference Jung, Schmidt and Danielson1977). This is a significant difference. However, the mass spectra for the V2+ and VH1+ charge-states, in and out of the precipitates, can provide clues to whether the temperature had a significant effect on the evaporation characteristics by the heat retention manifested in the thermal tails of each species in the mass spectrum. Figure 6(b) is an overlay of V2+ and VH1+ mass spectra inside and outside a precipitate. We did not see a notable difference in the shapes of the VH1+ and V2+ charge-states for vanadium in solution or in the precipitate, with each having a similar MRP. It would suggest that temperature contributions to the V2+/V(H)1+ ratio, with respect to the microstructural location, are not significant factors in the changes in the CSRs for vanadium between the two phases. We attribute the relatively similar thermal tail behavior for each phase to the small volume of these precipitates that are encased in a high thermal conducting matrix.
To further study the effect of temperature on the CSRs, a set of experiments was run at various specimen set point temperatures ranging from 25 to 90 K with a fixed 100 pJ laser energy. The mass spectra for the specimens run at these different specimens’ set points are nearly identical, as shown in Figure 7(a). The CSRs measured at different regions of these specimens are summarized in Figure 7(b). Unlike the prior discussion, which focused on one precipitate, here approximately ten precipitates were used and whose values account for the error values shown. The CSR of V2+/V(H)1+ was created by a π × 53 nm3 sphere that was placed either inside the precipitate or within the matrix. For all specimens, the CSRs were found to be higher in the precipitate region, orange lines, than in the matrix region, red line. However, there is no statistically different variation with the V2+/V(H)1+ CSRs at these base temperatures for this fixed laser pulse energy. The precipitates used in this analysis are delineated by 18 at.% V isoconcentration surfaces in the reconstructed images in Figure 7(c). The distribution and cluster morphology appeared to be quite similar as a function of base temperature as well.
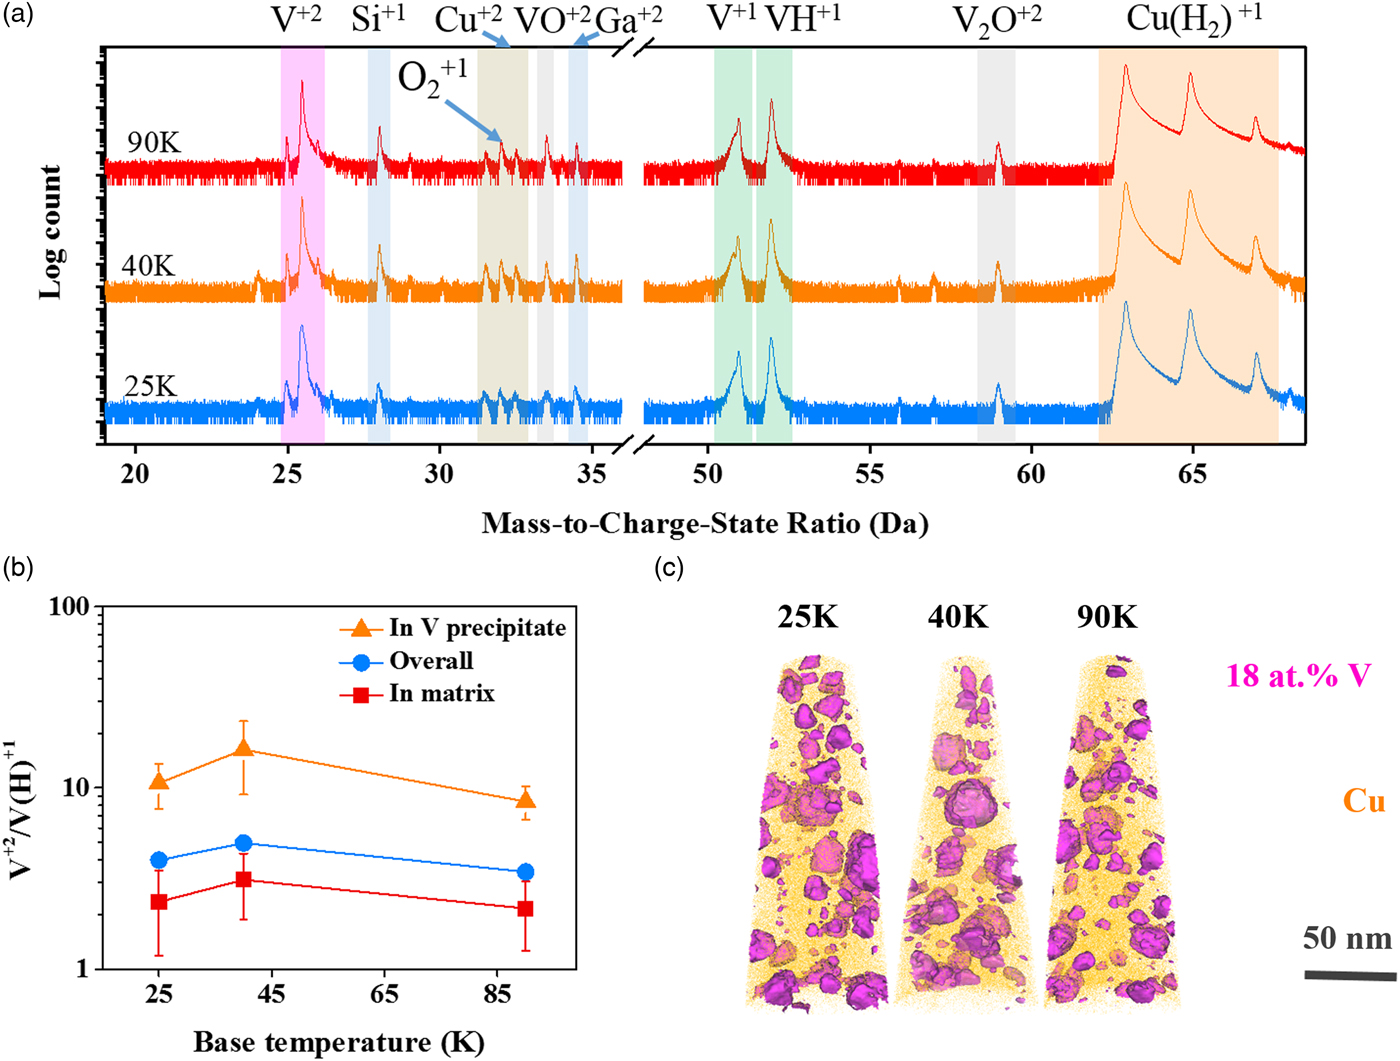
Fig. 7. a: Mass spectra analysis, (b) CSR of V2+/V(H)1+ measured in precipitates, in grain matrix, or for the overall specimen, and (c) atom probe reconstruction for the Cu–7V/400°C film running with a laser pulse energy of 100 pJ at 25, 40, and 90 K. 18 at.% V isosurfaces were embedded in the atom probe reconstruction to highlight the V precipitates.
In the next set of experiments, the base temperature was fixed at 40 K and the laser pulse energy was varied between 50 and 200 pJ with the evaporation rate held constant at 0.2%. Figure 8(a) shows the mass spectra for these experiments. Before discussing the CSR behavior, one of the interesting observations of the mass spectra as a function of laser energy is the evolution of the hydride peaks. With the increase of laser energy, a notable change in the relative ratio of the V1+ and VH1+ is apparent in the mass spectra but this hydride change is less apparent in the Cu1+ and CuH21+ peaks. This change in hydride behavior has been previously reported by Sundell to be a result of a reduction of hydrogen adsorption at low field strengths when using high laser pulse energies (Sundell, Reference Sundell2012). In addition, a clear onset of a V2O2+ peak forms as the laser energy increases, Figure 8(a). This is likely facilitated by the increased thermal energy provided by the laser for vanadium to react with intrinsic oxygen processed in the sample.
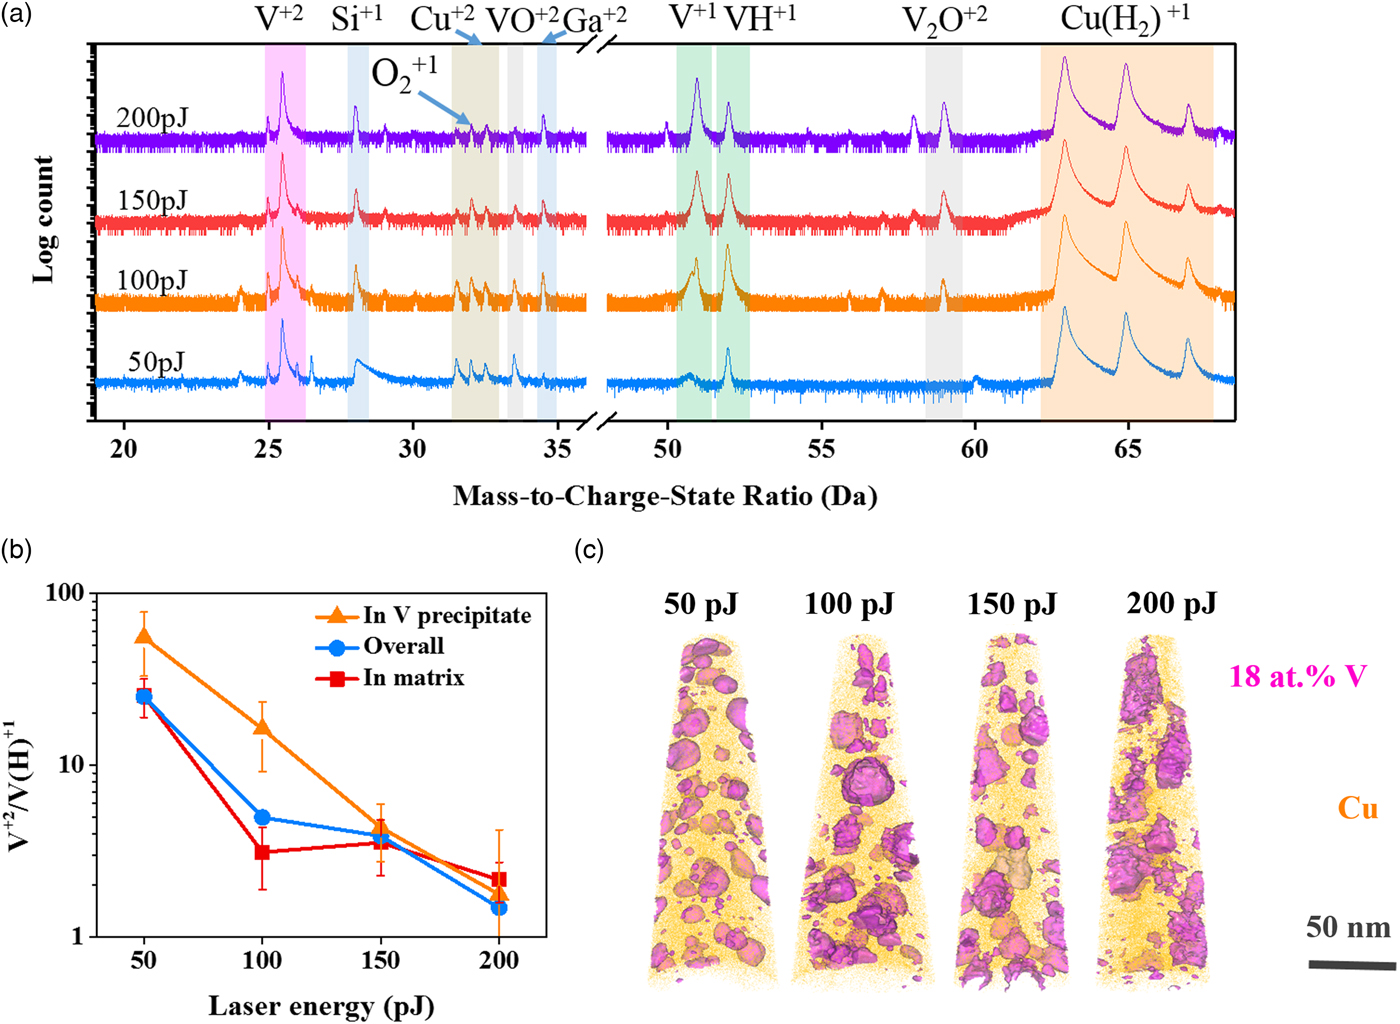
Fig. 8. a: Mass spectra analysis, (b) CSR of V2+/V(H)1+ measured in precipitates, in grain matrix, or for the overall specimen, and (c) atom probe reconstruction for the Cu–7V/400°C film running with different laser pulse energies at 40 K. 18 at.% V isosurfaces were embedded in the atom probe reconstruction to highlight the V precipitates.
With the increase in the laser energy, the evaporation field was reduced, resulting in a clear change in the V2+/V(H)1+ charge ratio, Figure 8(b). At the lowest energy of 50 pJ, the V2+/V(H)1+ ratio in the vanadium precipitate was quite high, ~50. Upon increasing the laser pulse energy, this ratio decreased, with the 200 pJ laser setting resulting in a V2+/ V(H)1+ ratio of ~2, Figure 8(b). Similarly, the V2+/V(H)1+ CSR decreased in the matrix from a high of ~25 at 50 pJ to a low of ~2 at 200 pJ, Figure 8(b). As in the prior analysis for a changing set point temperature, approximately ten precipitates were used in the analysis. All of the vanadium precipitates are shown in Figure 8(c) by the 18 at.% V isoconcentration surface that delineates them from the matrix. It is clearly apparent in this experiment with the variation in laser pulse energy that a more pronounced impact on the vanadium CSR occurred, with increasing pulse energy, enabling V2+ evaporation to be more readily observed in the matrix. What is particularly interesting, is that at energies of 150 pJ or higher, the ratios become equivalent between the precipitate and matrix. This similarity is attributed to the higher temperature that is throughout the specimen. At these higher temperatures, the required field to evaporate is reduced (Marquis & Gault, Reference Marquis and Gault2008), which consequently alters the differences to field evaporate vanadium from the precipitate and from the matrix. Inversely, at low temperature, the V2+/V(H)1+ CSRs appeared to be higher in the precipitate regions, which would indicate a higher evaporation field.
With increasing laser energy, the reconstructed images of Figure 8(c) also showed that the precipitates coarsen. This provides a cautionary warning for the use of high laser energies that can change the sample's initial microstructure. The ability to coarsen at these conditions is linked to the nanocrystalline nature of the sample with a high fraction of GBs that serve as fast-track diffusion pathways and available free surface from the geometric shape and size of the APT needle. This coarsening of the precipitates is clearest by comparing the composition maps of Figures 9a and 9b. Figure 9a is the 50 pJ map which shows distinct and spherical precipitates; at 200 pJ, Figure 9(b), these precipitates are larger and oblique in shape with evidence of coalescence between two precipitates.
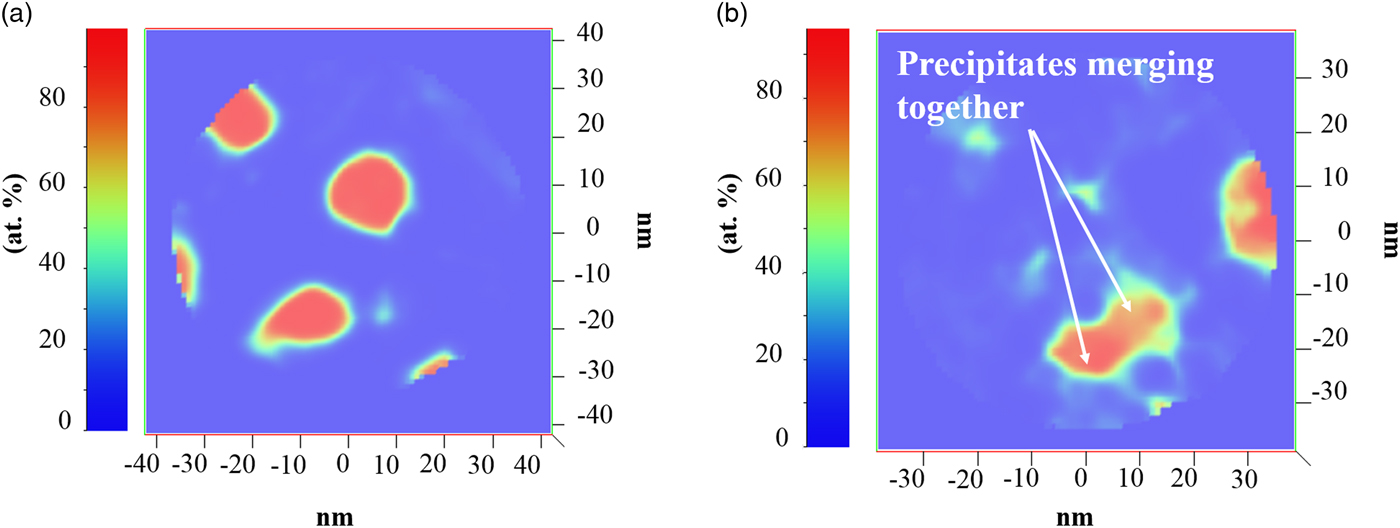
Fig. 9. The Cu–7V/400°C film: (a) 2D V concentration map for 50 pJ and (b) 2-D V concentration map for 200 pJ. White arrows indicate the merging of two precipitates.
Grain Orientation
Finally, the effect of crystallography is addressed. Since field evaporation will also be a function of the crystal orientation to the field (Loberg & Norden, Reference Loberg and Norden1968; Yao et al., Reference Yao, Withrow, Restrepo, Windl and Marquis2015), and the dataset collected has a cross-correlative PED scan, this effect can be quantified to the CSR and grain orientation. Here, we have quantified the V2+/V(H)1+ ratio within the matrix of each grain. Figure 10 is the PED map of each grain with the corresponding V2+/V(H)1+ ratio for each grain. The inverse pole figure shows the orientations colored to a viewing direction parallel to the specimen's field evaporation direction, whereas the labeled [uvw] are the crystal direction aligned parallel with the axis of the sample (field evaporation direction). The V2+/V(H)1+ ratios for each of these grains varied from 1.4 to 4.5. This difference, at the extremes, could appear to be linked to orientation. Nonetheless, if one looks at the V2+/V(H)1+ = 1.4 (dashed black box in Fig. 10), it was from a “green shaded” grain with a field evaporation texture near  $[12\; \; \bar{2}\; \; 11]$ whereas another grain, with a “light green shaded” grain (solid black line box in Fig. 10) also has a field evaporation texture near $[12\; \; 1\; \; \bar{8}]$ but a V2+/V(H)1+ = 3.6. A similar V2+/V(H)1+ = 4.5 ratio was observed for a “magenta shaded” grain (solid red line box in Fig. 10) which is closer to $[\; 13\; \; \; \bar{5}\; \; 3]$. Thus, the changes in the CSRs were not as readily apparent in the experimentally characterized grain orientations. This could be attributed to the influence of the laser pulse energy on the surface diffusion, which could mitigate the contributions of crystal orientation effects, as well as the previously discussed hydrogen presence that helps reduce the field strengths. Future work, where significant differences in orientation are present, would help concretely determine the extent of orientation effects on charge state ratios for this alloy. Regardless of the evident orientation differences, the rather modest variation of vanadium CSRs within the matrix between these orientations is rather low as compared to the CSR from the evaporation from the precipitates themselves. Thus, the differences of vanadium in the precipitate or in the matrix appear most strongly influenced by its chemical coordination environment than its crystallographic coordinated environment.
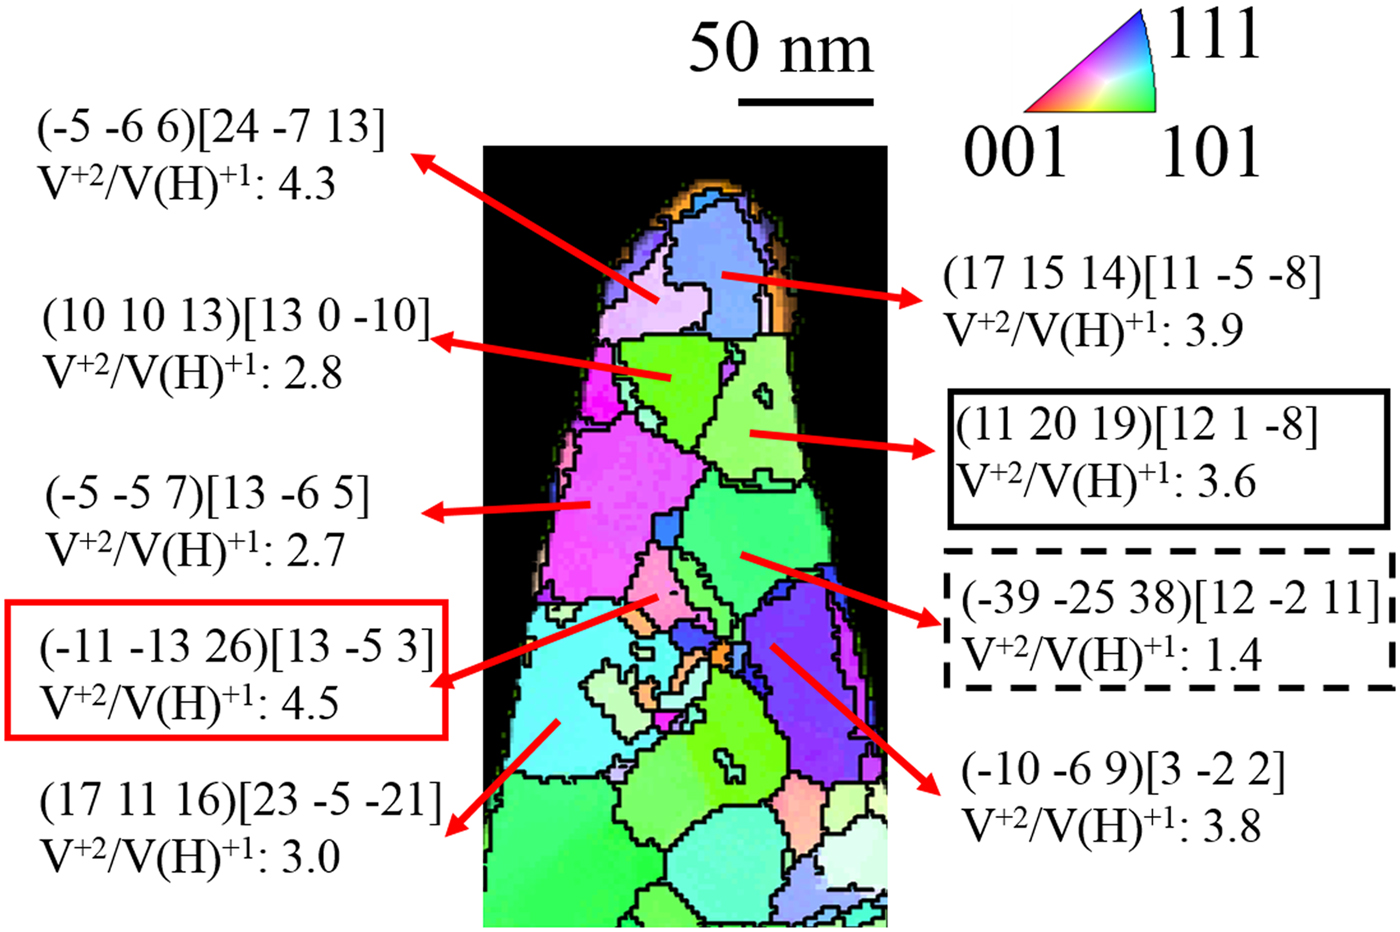
Fig. 10. CSR of V2+/V(H)1+ observed for grains with different orientations in the Cu–7V/400°C film collected at 40 K/100 pJ. The inverse pole figure shows the orientations colored to a viewing direction parallel to the specimen's field evaporation direction, or, alternatively, perpendicular to the electron beam direction. In this orientation, the specific (hkl)[uvw] values listed are parallel to the specimen's apex.
Conclusion
A cross-correlative PED and APT microscopy study was performed to study the segregation behavior in an annealed Cu–7V nanocrystalline alloy. From the collected mass spectrum, a V2+/V(H)1+ charge-state dependence was seen for vanadium, with this ratio significantly higher in the precipitate than in the matrix. The difference in the charge-states was discussed in terms of the Kingham charge-state model as well as hydride formation that was prevalent for the solute in the copper matrix phase. Though this model appears sufficient to describe higher charge-state behaviors created by higher field strengths during post-field ionization, the absolute field strength values (taken from the ratios) for V2+/V1+ and Cu2+/Cu1+ do not appear as accurate for direct comparison. Density variation maps revealed that the vanadium precipitates are at a higher field than the Cu matrix, where the Kingham model predicts vanadium to be a lower evaporating field than copper based on the observed CSR. This observation would hold even for the vanadium hydride ion because it would have a lower evaporation field strength than elemental vanadium ion.
The effect of temperature on the CSR was also investigated—at a fixed pulse laser energy of 100 pJ, but varied set point temperatures between 25 and 90 K, as well as at a fixed set temperature of 40 K, but varied pulse energy between 50 and 200 pJ. The fixed pulse laser experiment with different set point temperatures did not reveal any statistically significant change in the V2+/V(H)1+ CSR. In contrast, the fixed temperature set point with changing laser did reveal a significant change in the CSR, with the V2+/V(H)1+ CSR decreasing with increasing laser energy. At 150 pJ and higher energies, the CSR from the vanadium precipitate and the vanadium in the copper matrix was equivalent. This has been attributed to the higher temperature that can mitigate field strength differences needed for field evaporation. With the increased laser pulse energy, the precipitates did begin to coarsen.
Finally, the effect of grain orientation on the CSR of vanadium in the matrix was investigated. Of the changes noted, which were relatively minor, no clear variations could be linked to the grains’ orientations.
This study has shown that the CSR is complex and related to multiple variables, including phase composition and field evaporation conditions. Regardless of these complexities, the use of CSRs can lend insights into the chemical partitioning of solutes between phases and offers an area of fertile investigation in how the local chemical environment may alter solute field evaporation behavior.
Acknowledgments
The authors gratefully thank the National Science Foundation-DMR-1709803 for support of this research. We also acknowledge the fruitful technical discussions with Dr. Baptiste Gault.


