


INTRODUCTION
Urbanization dramatically transforms natural environments, perpetuating habitat loss and fragmentation worldwide and changing the original flora and fauna, but also concentrating resources and energy (Wagner Reference WAGNER2008). Together with increased density of humans, urbanized areas have higher temperatures, modified precipitation regimes, altered nutrient cycling and increased concentration of various xenobiotics (McKinney Reference MCKINNEY2006). Urbanization also promotes biotic homogenization, as only a few, usually non-native, species can tolerate the urban conditions (McKinney Reference MCKINNEY2006). As more than half of the world's population lives in cities (United Nations 2014), urban biodiversity is particularly valuable, both as a link between humans and nature and for providing ecosystem services (Millennium Ecosystem Assessment 2005).
In general, higher levels of urbanization cause a decline in ecosystem services (Eigenbrod et al. Reference EIGENBROD, BELL, DAVIES, HEINEMYER, ARMSWORTH and GASTON2011, Ferrante et al. Reference FERRANTE, LO CACCIATO and LÖVEI2014) and in biodiversity (see Ahrné et al. Reference AHRNÉ, BENGTSSON and ELMQVIST2009 for bumble bees; McKinney Reference MCKINNEY2008 for plants; Marzluff Reference MARZLUFF, Marzluff, Bowman and Donnelly2001 for invertebrates and vertebrates excluding birds; Sol et al. Reference SOL, GONZÁLEZ-LAGOS, MOREIRA, MASPONS and LAPIEDRA2014 for birds), although negative effects are not universal (Magura et al. Reference MAGURA, LÖVEI and TÓTHMÉRÉSZ2010, Marzluff Reference MARZLUFF2005, McKinney Reference MCKINNEY2008).
Birds are a flagship group in studies of urbanization on biodiversity, being a favoured group by many people, taxonomically well-known, and quick to react to environmental changes in easily detectable ways (Chazdon et al. Reference CHAZDON, PERES, DENT, SHEIL, LUGO, LAMB, STORK and MILLER2009, Gibson et al. Reference GIBSON, LEE, KOH, BROOK, GARDNER, BARLOW, PERES, BRADSHAW, LAURANCE, LOVEJOY and SODHI2011). Bird densities show both negative (Aronson et al. Reference ARONSON, LA SORTE, NILON, KATTI, GODDARD, LEPCZYK, WARREN, WILLIAMS, CILLIERS, CLARKSON, DOBBS, DOLAN, HEDBLOM, KLOTZ, KOOIJMANS, KÜHN, MACGREGOR-FORS, MCDONNELL, MÖRTBERG, PYŠEK, SIEBERT, SUSHINSKY, WERNER and WINTER2014) and positive (Galushin Reference GALUSHIN1971, Marzluff Reference MARZLUFF, Marzluff, Bowman and Donnelly2001, Sengupta et al. Reference SENGUPTA, MONDAL and BASU2014) responses to urbanization, and avian species richness can decrease with increasing urbanization (Chace & Walsh Reference CHACE and WALSH2006), or peak at intermediate levels of urbanization (Jokimäki & Suhonen Reference JOKIMÄKI and SUHONEN1993, Marzluff Reference MARZLUFF2005).
Our knowledge on the effects of urbanization on birds originates mostly from studies in the northern hemisphere (Aronson et al. Reference ARONSON, LA SORTE, NILON, KATTI, GODDARD, LEPCZYK, WARREN, WILLIAMS, CILLIERS, CLARKSON, DOBBS, DOLAN, HEDBLOM, KLOTZ, KOOIJMANS, KÜHN, MACGREGOR-FORS, MCDONNELL, MÖRTBERG, PYŠEK, SIEBERT, SUSHINSKY, WERNER and WINTER2014), while most biodiversity resides at lower latitudes (Huston Reference HUSTON1994), where the fastest growth in urbanization also occurs (United Nations 2014). Decreasing bird diversity was detected also in Central America (MacGregor-Fors Reference MACGREGOR-FORS2008) and Asia (Lin et al. Reference LIN, CHANG, CHU and CHENG2011).
To analyse effects of urbanization on bird assemblages in Central India, we used an urbanization gradient approach (Clergeau et al. Reference CLERGEAU, SAVARD, MENNECHEZ and FALARDEAU1998, Jokimäki & Suhonen Reference JOKIMÄKI and SUHONEN1993, Liker et al. Reference LIKER, PAPP, BÓKONY and LENDVAI2008) to examine the factors influencing bird assemblages.
We tested the following hypotheses: increasing omnivory and herbivory hypothesis (H1): as urbanization advances, much of the original diversity, including plants and their associated arthropods is destroyed (Wagner Reference WAGNER2008), so we expected that raptors and insectivores will decline, and omnivores and plant/seed eaters will increase as urbanization advances. Support for this hypothesis was found when examining the effects of urbanization on ground beetles in Denmark (Elek & Lövei Reference ELEK and LÖVEI2007). We also expected that the average body size of birds will gradually decrease with advancing urbanization (the decreasing body size hypothesis, H2). Urban habitats are characterized by larger and more frequent environmental fluctuations, and higher degrees of disturbance (McKinney Reference MCKINNEY2006), causing smaller windows of opportunity, which can be better exploited by smaller species, and their relative abundance will increase as urbanization advances. Large species are expected to diminish or disappear altogether (Cardillo et al. Reference CARDILLO, MACE, JONES, BIELBY, BININDA-EMONDS, SECHREST and ORME2005). Finally, we expected that as urbanization progresses, beta diversity will decrease (H3) – the assemblages will be more similar to each other with fewer local differences. This can be interpreted as a version of the homogenization hypothesis (McKinney Reference MCKINNEY2006): bird assemblages in more urbanized habitats will be less different from each other than in the original, rural, forest-associated habitats.
METHODS
Study area
The study was conducted in the area of Amravati city (Figure 1), in the state of Maharashtra, on the Deccan Plateau in Central India (20°56′–20°93′N, 77°45′–77°75′E, 343 m asl). This area is characterized by a tropical wet and dry climate with a mean annual temperature of 27°C, and a mean annual precipitation of 874 mm. The summer lasts from March to June, the monsoon season from July to October, and the winter from November to March. An urbanization gradient of five stages was selected on the basis of built-up surface and vegetation composition, as these two parameters are usually considered reliable indicators of human disturbance level (Pickett et al. 2011). The five-stage gradient included (1) rural forest, (2) industrial, (3) peri-urban, (4) suburban and (5) urban area (0%, 0–20%, <35%, 35–50%, >50% of built-up area, respectively, identified from Google Earth). Our selected stages were characterized by similar plant communities, although the dominant species were different. The rural forest was a forest reserve (20°53′N, 77°47′E) classified as Southern Tropical Dry Deciduous Forest by Champion & Seth (Reference CHAMPION and SETH1968), and dominated by Aegle marmelos Correa, Azadiractha indica A.Juss., Butea monosperma Taub., Calotropis procera Aiton, Cassia fistula L. and Gliricidia sepium Kunth. The land between the studied forest reserve and the urbanized area was occupied by rain-fed croplands of mixed cropping. The industrial stage (20°53′N, 77°45′E) was located at the south-eastern part of Amravati city, comprising an area of 200 ha, which was allocated by the government for industrial development. This area was under construction, and changed considerably for the duration of the study. The roads were tarmac, the average size of individual land parcels much bigger than in other areas. Nevertheless, the plant community was represented by the same dominant tree species during our study: Ailanthus excelsa Roxb., Eucalyptus obliqua L'Herit., Leucaena leucocephala de Wit, Psidium guajava L. and Ziziphus mauritiana Lam. The periurban stage (20°53′N, 77°45′E) was located at the periphery of Amravati city, with separate houses, plots of land and streets with little or no asphalt; and less than 35% of the surface was occupied by buildings. Virtually all individual households had gardens and kept domestic animals. The most common plant species were Ficus benghalensis L., Ficus racemosa L., Ficus religiosa L., Lantana camara L., Millettia pinnata Panigrahi and Tamarindus indica L. The suburban stage (20°56′N, 77°46′E) was a residential area dominated by the tree species Delonix regia Raf. and Michelia champaca L. and by the fruit trees Annona squamosa L., and Mangifera indica L. In this area, 35–50% of the total surface was covered with tarmac or occupied by buildings. Several individual households kept domestic animals and cultivated vegetable gardens. The urban stage (20°55′N, 77°45′E) was densely populated, including also the historical centre of the city, and more than 50% of the surface was covered with buildings. It was characterized by tree species of A. indica, Cocos nucifera L., F. religiosa, Polyalthia longifolia Sonn. and Terminalia catappa L. The centre of Amravati was ~6–7 km from the forest area, 4–5 km from the suburban stage, 2–3 km from the peri-urban stage and 4–8 km from the industrial area.
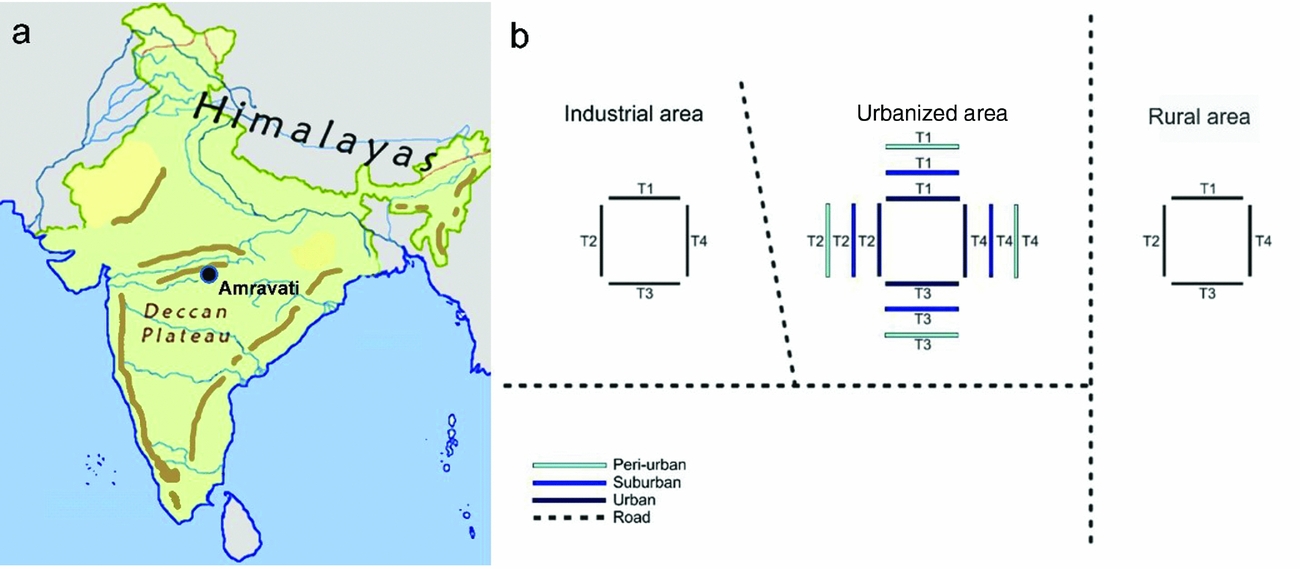
Figure 1. Location of Amravati city, Maharashtra State, on the Deccan Plateau, India (left panel), and the arrangement of census paths (right panel). Transects were indicated by ‘T’.
Bird survey methods
Bird presence and abundance were recorded during the breeding season (January–April), between 2010–2013, along four transects at each of the five urbanization stages (Verner Reference VERNER1985). Each transect was 3 km long and 50 m wide, and was walked at the same speed on sunny days from 06h00 to 09h00 on three days of each of the four months in each of the four years. Identification of birds was done using field guides (Ali Reference ALI2002, Grimmett et al. Reference GRIMMETT, INSKIPP and INSKIPP2001). Some species belonging to raptor, quail and warbler families (5–10% of the total number of observations) were excluded from the analysis as their species identification was uncertain. Additionally, data on several waterbirds (Actitis hypoleucos L., Amaurornis phoenicurus Pennant, Ardeola grayii (Sykes), Bubulcus ibis L., Egretta garzetta L. and Pseudibis papillosa (Temminck)) were excluded (2.6% of the total number of observations) as not all urbanization stages provided suitable habitat for them.
Statistical analysis
We selected the maximum numbers counted of each species over the three days of surveys in each month as representative of the bird abundance at that urbanization stage in that month. We tested for significant differences between the four months per year using Wilcoxon paired t-tests. As none of the comparisons showed significant differences, we kept the maximum value for each species. Diversity within transect and between urbanization stage was examined using an additive partitioning method (Lande Reference LANDE1996). This method considers α- (i.e. diversity at transect/year level) and β-diversity as additive components of the γ- (i.e. regional) diversity, and express them in the same units of species richness. This allows direct comparisons between α- and β-diversity within the same study (Crist & Veech Reference CRIST and VEECH2006) as well as between studies, when diversity is expressed as proportions (Anderson et al. Reference ANDERSON, CRIST, CHASE, VELLEND, INOUYE, FREESTONE, SANDERS, CORNELL, COMITA, DAVIES, HARRISON, KRAFT, STEGEN and SWENSON2011). As very little (2.7%) of the diversity was explained by differences among transects within an urbanization stage, we considered only year and urbanization stage as a factor in further analyses. We compared bird species richness for each urbanization stage/year using the Jaccard dissimilarity index (Magurran Reference MAGURRAN2003: Eq. 1).
 $$\begin{equation}
{C_j} = {\rm{ }}a/\left( {a{\rm{ }} + {\rm{ }}b{\rm{ }} + {\rm{ }}c} \right)
\end{equation}$$
$$\begin{equation}
{C_j} = {\rm{ }}a/\left( {a{\rm{ }} + {\rm{ }}b{\rm{ }} + {\rm{ }}c} \right)
\end{equation}$$
Where a is the number of species shared between two urbanization stages, and b and c the number of species found at only one of the stages (Henderson & Southwood Reference HENDERSON and SOUTHWOOD2016). In order to construct the dendrogram, we used ‘average linkage’ clustering method (Izenman Reference IZENMAN2008).
Although N-mixture models are technically appropriate to estimate absolute abundance by incorporating probability of detection (Barker et al. Reference BARKER, SCHOFIELD, LINK and SAUER2017), estimating the actual population size in each stage of the urbanization gradient was not the aim of this study. Moreover, N-mixture models do not perform well under low probabilities of detection (Duarte et al. Reference DUARTE, ADAMS and PETERSON2018). Therefore, we tested for differences in species richness and abundance using generalized linear mixed models, with bird size class and foraging preference as random factors. Foraging preferences were categorized as: insectivorous, omnivorous, predatory (when feeding on other vertebrates such as fish or mammals), herbivorous and frugivorous. Bird body size classes (a proxy for several categories of resource use, Peters Reference PETERS1986) were categorized as: small (6–45 g), medium (45–120 g), large (120–300 g) and very large (>300 g). Both categorizations were based on guilds and categories in Wilman et al. (Reference WILMAN, BELMAKER, SIMPSON, DE LA ROSA, RIVADENEIRA and JETZ2014). We tested if species presence/absence and total bird abundance varied along the five-stage gradient between years using binomial and Poisson distributions, respectively. To account for overdispersion, the Poisson GLM standard errors were corrected using a quasi-GLM model where the variance was given by ϕ×μ, where μ is the mean and ϕ the dispersion parameter (Zuur et al. Reference ZUUR, IENO, WALKER, SAVELIEV, Gail, Krickeberg, Samet, Tsiatis and Wong2009). Model selection was done through backward selection, by comparing AICs. All calculations were made using the R program version 3.0.2, and the package vegan.
RESULTS
During four years, our study assemblage included 89 bird species along the urbanization gradient, the majority of them were year-round residents (Appendix 1). The total species richness was higher in the rural (forest) and industrial zone stages, followed by the peri-urban, suburban and urban ones (73, 73, 54, 35 and 29 species, respectively). However, the number of species in the industrial zone decreased considerably after the first year of census, while the other stages did not show such striking between-year differences (Figure 2). The overall assemblage was composed of insectivorous species (44%), omnivores (31%), predators (10%), herbivores (9%) and frugivores (6%). Considering size distribution, nearly half of the species (48%) were small, while 24% were of medium size, 17% large and 11% very large.
Figure 2. Jacccard's dissimilarity indices for the bird species richness along the five-stage urbanization gradient, observed during censuses in 2010–2013, in and around Amravati city, Maharashtra State, India.
If abundance of individuals was considered, we observed almost the opposite of the trend observed for species richness: the urban stage had the highest number (41670 individuals), followed by the suburban (24409 ind.), peri-urban (17749 ind.), forest (15562 ind.) and industrial (13439 ind.) habitats. These values were directly comparable, because of the identical sampling effort at the various urbanization stages. Variation in abundance per year showed idiosyncratic patterns for each of the urbanization stages (Table 1). In the forest area in 2010 we observed fewer individuals than in the subsequent years; while in the industrial zone, the assemblage in 2010 showed a much higher number than later. In 2010, the record of bird individuals in the suburban area was more similar to 2013, due to the presence of large flocks of Hirundo concolor observed in those years. In the peri-urban area, the trend was the same as in the suburban one, but the dominant species was Columba livia throughout the study period. Finally, bird abundance in the urban area in 2010 was closer to 2011 than to the remaining years.
Table 1. Species richness and numbers of individuals by foraging category along the urbanization gradient near Amravati city, Maharashtra State, India, censused between 2010 and 2013. Values are yearly means ± SD.
The mean species richness per year of each of the foraging categories was always higher in the rural forest, with the exception of frugivorous species; the same was not found for bird count (Table 1). Along all the stages of the gradient there were more small species than big ones (small > medium > large > very large, Figure 3). The foraging preference pattern was common to the gradient too (insectivores > omnivores > predators > herbivores > frugivores), with the only exception being the suburban stage (omnivores > insectivores > predators > herbivores > frugivores, Figure 4). Although forest and industrial areas had the same species richness, the proportion of foraging categories was different. We found more predatory and herbivorous species in the forest than in the industrial area (9 and 8 vs. 7 and 6 species, respectively), and more insectivorous and frugivorous ones in the industrial than forest area (33 and 5 vs. 31 and 3 species, respectively). Very large species were found mostly in the forest area, whereas in the industrial stage they were replaced by medium-sized species. The results of the logistic regression showed that species presence/absence was significantly affected by urbanization stage (Table 2). Species number in the rural forest area was significantly higher than in all the other stages (with the exception of the industrial area in 2010). Moreover, temporal effect in year 2011 and 2012 was observed independently of the urbanization stage. Bird abundance was significantly higher in the urban and suburban stages compared with all the others (Table 3).
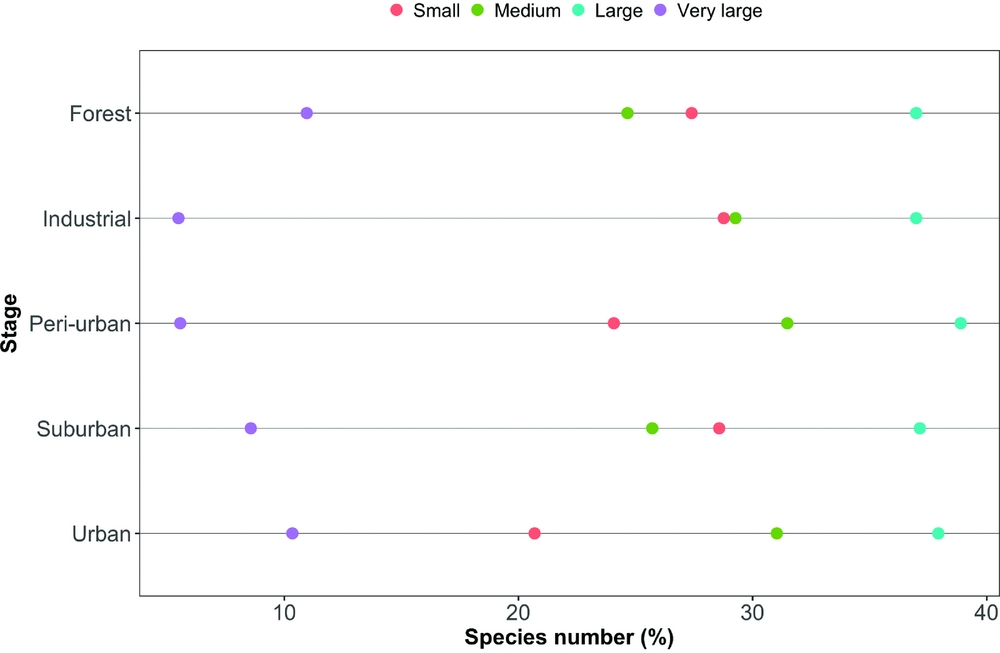
Figure 3. The composition by size classes of the bird assemblages along the five-stage urbanization gradient, observed during censuses in 2010–2013, in and around Amravati city, Maharashtra State, India.
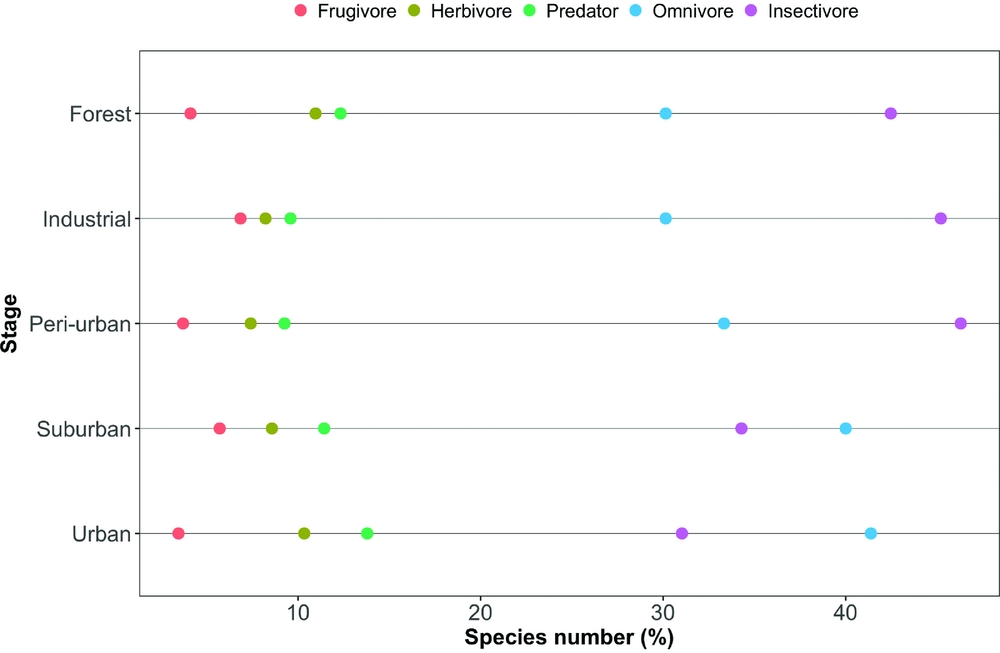
Figure 4. The composition by feeding categories of the bird assemblages along the five-stage urbanization gradient, observed during censuses in 2010–2013, in and around Amravati city, Maharashtra State, India.
Table 2. Summary results of the logistic regression for bird assemblages at Amravati city and surroundings, Maharashtra State, central India. The response variable of the model was presence/absence of species, and urbanization stage and year were fixed factors. Only significant values are shown.
Table 3. Summary result of the generalized linear model (Poisson family), with bird abundance as response variable, and urbanization stage as the fixed factor for the bird assemblages at Amravati city and surroundings, Maharashtra State, central India. Only significant values are shown.
The additive diversity partitioning indicated that of the overall diversity (gamma-diversity), alpha diversity (local diversity, i.e. at transect level) contributed 50.1% to the total diversity. Only 2.7% was explained by between-transect differences, and the remaining 36.2% by differences between urbanization stages.
DISCUSSION
By using an urbanization gradient, we found that bird species richness was negatively affected by urbanization, while the opposite was true for bird abundance, which is in accordance with previous results (reviewed in Marzluff Reference MARZLUFF, Marzluff, Bowman and Donnelly2001). In this study, we provided evidence that this pattern is true also for tropical regions. We registered a higher species richness in general than found in similar studies in the temperate zone, which is not surprising, as India's avian biodiversity contains 13% of the world species richness, ~1300 species (Grimmett et al. Reference GRIMMETT, INSKIPP and INSKIPP2001). The bird fauna of the various urbanization stages in this region originates from the rural bird fauna. Here we detected the effects of filtering mechanisms (Clergeau et al. Reference CLERGEAU, CROCI, JOKIMÄKI, KAISANLAHTI-JOKIMÄKI and DINETTI2006) that influenced the composition of bird assemblages in various urbanization stages.
We found support for H1, as the share of omnivorous and herbivorous species increased, both in terms of number of species and of individuals as urbanization progressed. The few species that are adapted to the overabundance of certain resources in urban centres will have a higher success than insectivores or predators as hypothesized. Although Galushin (Reference GALUSHIN1971) was impressed by the high number of predatory birds in New Delhi, he also commented on the very high numbers of the black kite (Milvus migrans), which are linked to carrion and rubbish, and that hunting birds are much more rare.
Consistently with our H2, large species were mostly restricted to the rural forest and in some cases, the industrial zones, and these hardly ever occurred in the more urbanized areas. This generated assemblages composed of smaller sized species – but still, the small insectivores (of which there are many in India, see Ali Reference ALI2002) were lacking. One reason could be that the insect food supply could be smaller in urban settings. An indirect indication of this is the loss of large carabid beetle species, and the generally decreasing trend of species sizes along, for example, temperate forest urbanization gradients (Magura et al. Reference MAGURA, LÖVEI and TÓTHMÉRÉSZ2010). Carabids form an important food resource for birds (Lövei & Sunderland Reference LÖVEI and SUNDERLAND1996), and trends found in this family could reflect the overall trends of arthropod sizes with increasing levels of urbanization.
Diversity partitioning indicated that local (α) diversity contributed 50.1% to the overall (γ) diversity of 89 species identified in the region of study. Another 36.2% was found at urbanization stage level and only 2.7% of the diversity was found at within-stage level (β diversity), indicating fairly homogeneous assemblages. By partitioning β diversity into components, we found species richness (species loss) was more important than species replacement for the pattern of β diversity along the urban gradient. The urbanization in this region may create very similar conditions for birds, because the within-zone spatial variability contributed little to the overall pattern of diversity. Bird assemblages are strongly affected by habitat structure and availability of food. The supply of anthropogenic food in an urban centre and water in the gardens of residential suburban and peri-urban areas may contribute to bird richness (Blair Reference BLAIR1996, McKinney Reference MCKINNEY2002). Furthermore, structural biodiversity across urban parks and rural forest could also be important determinants (Diaz et al. Reference DIAZ, ARMESTO, REID, SIEVING and WILLSON2005, Newton Reference NEWTON1994).
The basis of such changes can be behavioural. The reactions of the Acadian flycatcher (Empidonax virescens) to urbanization in Ohio, USA, include higher levels of turnover in site occupancy, smaller-sized birds settling in urban areas, that show lower site fidelity and higher nest predation (Rodewald et al. Reference RODEWALD, KEARNS and SHUSTACK2013). This is probably true for between-species situations as well, but this hypothesis needs testing.
Our results could be extended by a systematic analysis of bird functional diversity in tropical areas, to test whether biotic homogenization also occurs under tropical conditions, and whether the reduced bird diversity would profoundly influence the functioning of urban ecosystems. With the continuing decline of biodiversity worldwide (Butchart et al. Reference BUTCHART, WALPOLE, COLLEN, VAN STRIEN, SCHARLEMANN, ALMOND, BAILLIE, BOMHARD, BROWN, BRUNO, CARPENTER, CARR, CHANSON, CHENERY, CSIRKE, DAVIDSON, DENTENER, FOSTER, GALLI, GALLOWAY, GENOVESI, GREGORY, HOCKINGS, KAPOS and LAMARQUE2010), and the increasing urbanization, especially in the megadiverse regions of the world (Puppim de Oliveira et al. Reference PUPPIM DE OLIVEIRA, BALABAN, DOLL, MORENO-PEÑARANDA, GASPARATOS, IOSSIFOVA and SUWA2010), biodiversity-friendly management of urban areas could bring substantial global benefits.
ACKNOWLEDGEMENTS
We thank K. Morey, M. Nawarkhele and C. Shrivastav for help during fieldwork, C. H. Knudsen for preparing the map, and the anonymous reviewers for comments. Author contributions: MK, ND, RK and PB designed the study, fieldwork was performed by MK, ND and RK, data analysis by MF, IT, TI and GL and writing by MK, MF, IT and GL, with comments from the other authors. Authorship is by the first-and-last principle.
Appendix 1. List of the birds observed along the urbanization gradient in Amravati city, Maharashtra State, central India, with their food preferences, and body size class. Species nomenclature follows Ali (Reference ALI2002). Food preference and body size extracted from Wilman et al. (Reference WILMAN, BELMAKER, SIMPSON, DE LA ROSA, RIVADENEIRA and JETZ2014). Body size classes: small (6–45 g), medium (45–120 g), large (120–300 g) and very large (>300 g).


